

Key Insights
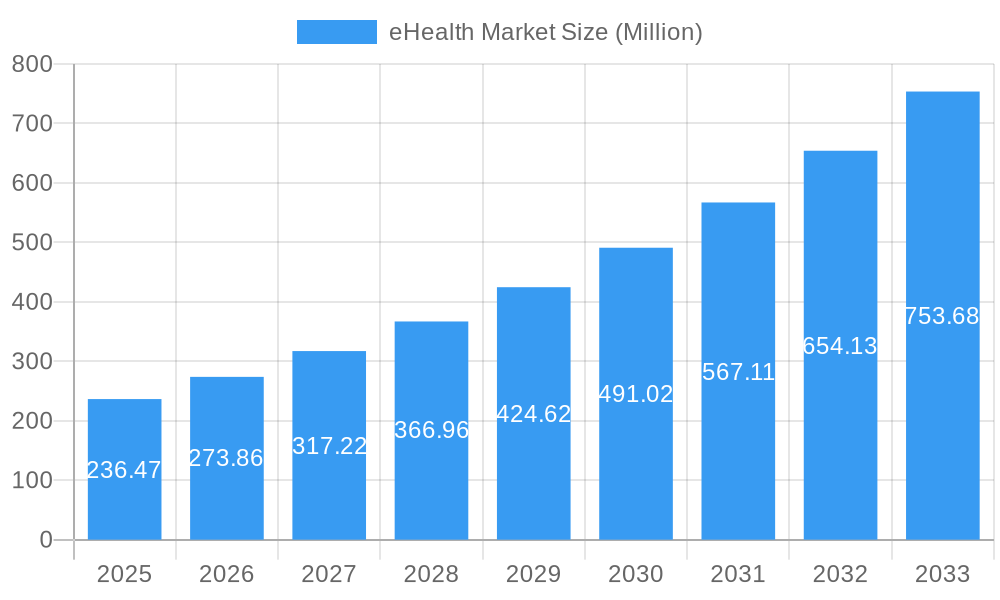
The global eHealth market, valued at $236.47 million in 2025, is poised for significant growth, exhibiting a Compound Annual Growth Rate (CAGR) of 16.02% from 2025 to 2033. This expansion is driven by several key factors. The increasing prevalence of chronic diseases necessitates remote patient monitoring and telehealth solutions, fueling demand for e-prescribing, electronic health records (EHRs), and clinical decision support systems (CDSS). Furthermore, rising healthcare costs and the need for improved efficiency are pushing healthcare providers and payers towards adopting cost-effective eHealth technologies. Government initiatives promoting digital health infrastructure and the increasing smartphone penetration, particularly in emerging economies, are also contributing to market growth. The market is segmented by end-user (hospitals, insurance companies, other end-users), component (EHRs, e-prescribing, CDSS, telemedicine, other components), and type of service (monitoring, diagnosis, therapeutic, and other services). North America currently holds a dominant market share, driven by robust technological advancements and high healthcare spending, but the Asia-Pacific region is anticipated to witness substantial growth in the coming years due to increasing healthcare expenditure and rising internet penetration.
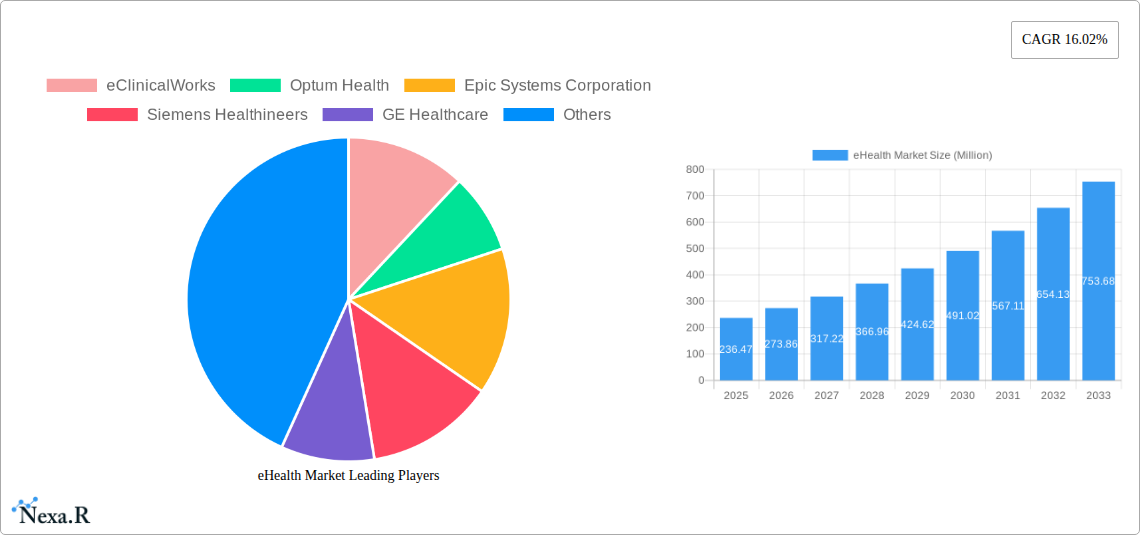
eHealth Market Market Size (In Million)
Competition in the eHealth market is intense, with major players like eClinicalWorks, Optum Health, Epic Systems Corporation, and others vying for market share. The market’s growth trajectory, however, is not without challenges. Data security and privacy concerns, interoperability issues between different eHealth systems, and the need for extensive training and infrastructure development pose significant restraints. Addressing these challenges through robust cybersecurity measures, the development of standardized data exchange protocols, and effective user training programs will be crucial for sustained market growth. Strategic partnerships, mergers, and acquisitions are likely to play a significant role in shaping the competitive landscape in the coming years, with companies focusing on innovation and expanding their service offerings to gain a competitive edge. The future of eHealth looks bright, with substantial opportunities for growth and innovation across all segments and regions.
eHealth Market Company Market Share
eHealth Market Report: 2019-2033
This comprehensive report provides a detailed analysis of the eHealth market, encompassing market dynamics, growth trends, regional dominance, product landscapes, key players, and future outlook. The study period covers 2019-2033, with 2025 as the base and estimated year. The forecast period extends from 2025 to 2033, and the historical period analyzed is 2019-2024. This report is invaluable for industry professionals, investors, and stakeholders seeking a deep understanding of this rapidly evolving sector.
eHealth Market Dynamics & Structure
The eHealth market is characterized by a dynamic interplay of technological innovation, regulatory frameworks, and competitive pressures. Market concentration is moderate, with several key players holding significant market share, but a substantial number of smaller players also competing. Technological advancements, particularly in AI and machine learning, are driving significant innovation, enabling more personalized and efficient healthcare delivery. However, data privacy concerns and regulatory complexities (e.g., HIPAA compliance in the US) present considerable barriers to entry and growth. Mergers and acquisitions (M&A) activity is prevalent, with larger companies strategically acquiring smaller players to expand their product portfolios and market reach. The increasing adoption of telemedicine and remote patient monitoring is further reshaping the market landscape.
- Market Concentration: Moderate, with top 5 players holding approximately xx% market share in 2024.
- Technological Drivers: AI, machine learning, big data analytics, cloud computing.
- Regulatory Frameworks: HIPAA (US), GDPR (EU), and varying regional regulations impact market dynamics.
- M&A Activity: xx deals recorded in 2024, valued at approximately $xx million.
- End-User Demographics: Significant growth driven by aging populations and rising prevalence of chronic diseases.
- Competitive Landscape: Intense competition driven by technological advancements and increased demand.
eHealth Market Growth Trends & Insights
The eHealth market is experiencing robust growth, driven by increasing healthcare costs, technological advancements, and a rising demand for convenient and accessible healthcare services. The market size expanded from $xx million in 2019 to $xx million in 2024, exhibiting a CAGR of xx%. This growth trajectory is projected to continue, with a forecasted CAGR of xx% from 2025 to 2033, reaching an estimated market value of $xx million by 2033. Market penetration of eHealth solutions is increasing across various segments, with the adoption of electronic health records (EHRs) and telemedicine services leading the charge. Consumer behavior is shifting towards digital healthcare platforms, driven by convenience, cost-effectiveness, and enhanced accessibility. Technological disruptions, such as the integration of AI-powered diagnostic tools, are transforming healthcare delivery models, promising improved patient outcomes and operational efficiency. The increasing adoption of wearable health devices and remote patient monitoring systems is further fueling market expansion.
Dominant Regions, Countries, or Segments in eHealth Market
North America currently holds the largest market share in the eHealth sector, driven by robust technological infrastructure, high healthcare expenditure, and favorable regulatory environment. However, Asia-Pacific is expected to exhibit the highest growth rate during the forecast period, fueled by increasing healthcare investments, rising smartphone penetration, and government initiatives promoting digital health.
By End User:
- Hospitals: The largest segment, driven by the need for efficient patient management and improved operational efficiency.
- Insurance Companies: Significant growth driven by the need for streamlined claims processing and improved risk management.
- Other End Users: This segment includes individual consumers, research institutions, etc., and is also showcasing substantial growth.
By Component:
- Electronic Health Records (EHRs): Remains the dominant component, driven by increasing regulatory mandates and the need for improved data management.
- Telemedicine: Experiencing rapid growth due to increased convenience and accessibility.
- Clinical Decision Support Systems (CDSS): Growing adoption driven by the need for improved diagnostic accuracy and treatment efficacy.
By Type of Service:
- Monitoring Service: Significant growth driven by the increasing adoption of wearable health devices and remote patient monitoring systems.
- Diagnosis Service: Growth fueled by advancements in AI-powered diagnostic tools.
eHealth Market Product Landscape
The eHealth market boasts a diverse range of products, including electronic health records (EHRs), telemedicine platforms, clinical decision support systems (CDSS), and remote patient monitoring devices. Product innovation focuses on enhancing user experience, improving data security, integrating AI and machine learning capabilities, and developing more personalized healthcare solutions. Key performance indicators include user adoption rates, data accuracy, system uptime, and patient satisfaction scores. Unique selling propositions often center on superior user interfaces, robust security features, integration with existing healthcare systems, and innovative analytical capabilities.
Key Drivers, Barriers & Challenges in eHealth Market
Key Drivers:
- Increasing healthcare costs and the need for cost-effective solutions.
- Growing adoption of smartphones and internet connectivity.
- Government initiatives promoting digital health.
- Technological advancements in AI, machine learning, and big data analytics.
Challenges and Restraints:
- Data privacy and security concerns.
- Lack of interoperability between different healthcare systems.
- High implementation costs and technical complexities.
- Regulatory hurdles and compliance requirements.
Emerging Opportunities in eHealth Market
- Expansion into underserved markets and regions.
- Development of AI-powered diagnostic tools and personalized medicine solutions.
- Integration of wearable sensors and IoT devices for remote patient monitoring.
- Growth of telehealth and virtual care services.
Growth Accelerators in the eHealth Market Industry
Technological breakthroughs, particularly in artificial intelligence and machine learning, are driving significant growth. Strategic partnerships between technology companies and healthcare providers are accelerating the adoption of eHealth solutions. Government initiatives promoting digital health and increasing investments in healthcare infrastructure are further fueling market expansion. Market expansion into emerging economies presents significant opportunities for growth.
Key Players Shaping the eHealth Market Market
- eClinicalWorks
- Optum Health
- Epic Systems Corporation
- Siemens Healthineers
- GE Healthcare
- Koninklijke Philips NV
- CompuMed Inc
- Veradigm LLC
- athenahealth Inc
- Boston Scientific Corporation
- Oracle Cerner
Notable Milestones in eHealth Market Sector
- January 2023: India's National Health Authority launched an incentive scheme to promote digital health records, boosting adoption rates.
- January 2023: Health Services Management (HSM) partnered with Sound Physicians Telemedicine Services, expanding telemedicine reach in Texas, Indiana, and Florida.
In-Depth eHealth Market Market Outlook
The eHealth market is poised for continued robust growth, driven by technological advancements, increasing healthcare spending, and favorable government policies. Strategic partnerships and investments in innovative solutions will further accelerate market expansion. The focus on personalized medicine, remote patient monitoring, and AI-powered diagnostic tools will shape the future of the eHealth landscape. Untapped markets in developing economies present significant opportunities for growth and expansion.
eHealth Market Segmentation
-
1. Component
- 1.1. Electronic Health Records
- 1.2. e-Prescribing
- 1.3. Clinical Decision Support Systems
- 1.4. Telemedicine
- 1.5. Other Components
-
2. Type of Service
- 2.1. Monitoring Service
- 2.2. Diagnosis Service
- 2.3. Therapeutic and Other Services
-
3. End User
- 3.1. Hospitals
- 3.2. Insurance Companies
- 3.3. Other End Users
eHealth Market Segmentation By Geography
-
1. North America
- 1.1. United States
- 1.2. Canada
- 1.3. Mexico
-
2. Europe
- 2.1. United Kingdom
- 2.2. Germany
- 2.3. France
- 2.4. Italy
- 2.5. Spain
- 2.6. Rest of Europe
-
3. Asia Pacific
- 3.1. China
- 3.2. Japan
- 3.3. India
- 3.4. Australia
- 3.5. South Korea
- 3.6. Rest of Asia Pacific
-
4. Middle East and Africa
- 4.1. GCC
- 4.2. South Africa
- 4.3. Rest of Middle East and Africa
-
5. South America
- 5.1. Brazil
- 5.2. Argentina
- 5.3. Rest of South America
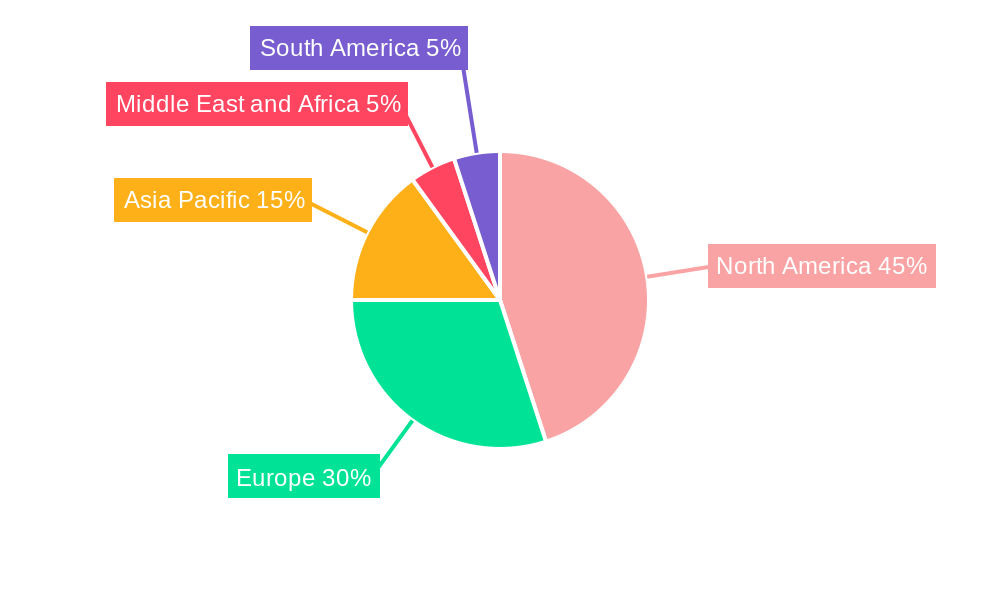
eHealth Market Regional Market Share
Geographic Coverage of eHealth Market
eHealth Market REPORT HIGHLIGHTS
| Aspects | Details |
|---|---|
| Study Period | 2020-2034 |
| Base Year | 2025 |
| Estimated Year | 2026 |
| Forecast Period | 2026-2034 |
| Historical Period | 2020-2025 |
| Growth Rate | CAGR of 16.02% from 2020-2034 |
| Segmentation |
|
Table of Contents
- 1. Introduction
- 1.1. Research Scope
- 1.2. Market Segmentation
- 1.3. Research Objective
- 1.4. Definitions and Assumptions
- 2. Executive Summary
- 2.1. Market Snapshot
- 3. Market Dynamics
- 3.1. Market Drivers
- 3.2. Market Restrains
- 3.3. Market Trends
- 3.4. Market Opportunities
- 4. Market Factor Analysis
- 4.1. Porters Five Forces
- 4.1.1. Bargaining Power of Suppliers
- 4.1.2. Bargaining Power of Buyers
- 4.1.3. Threat of New Entrants
- 4.1.4. Threat of Substitutes
- 4.1.5. Competitive Rivalry
- 4.2. PESTEL analysis
- 4.3. BCG Analysis
- 4.3.1. Stars (High Growth, High Market Share)
- 4.3.2. Cash Cows (Low Growth, High Market Share)
- 4.3.3. Question Mark (High Growth, Low Market Share)
- 4.3.4. Dogs (Low Growth, Low Market Share)
- 4.4. Ansoff Matrix Analysis
- 4.5. Supply Chain Analysis
- 4.6. Regulatory Landscape
- 4.7. Current Market Potential and Opportunity Assessment (TAM–SAM–SOM Framework)
- 4.8. NRP Analyst Note
- 4.1. Porters Five Forces
- 5. Market Analysis, Insights and Forecast 2021-2033
- 5.1. Market Analysis, Insights and Forecast - by Component
- 5.1.1. Electronic Health Records
- 5.1.2. e-Prescribing
- 5.1.3. Clinical Decision Support Systems
- 5.1.4. Telemedicine
- 5.1.5. Other Components
- 5.2. Market Analysis, Insights and Forecast - by Type of Service
- 5.2.1. Monitoring Service
- 5.2.2. Diagnosis Service
- 5.2.3. Therapeutic and Other Services
- 5.3. Market Analysis, Insights and Forecast - by End User
- 5.3.1. Hospitals
- 5.3.2. Insurance Companies
- 5.3.3. Other End Users
- 5.4. Market Analysis, Insights and Forecast - by Region
- 5.4.1. North America
- 5.4.2. Europe
- 5.4.3. Asia Pacific
- 5.4.4. Middle East and Africa
- 5.4.5. South America
- 5.1. Market Analysis, Insights and Forecast - by Component
- 6. Global eHealth Market Analysis, Insights and Forecast, 2021-2033
- 6.1. Market Analysis, Insights and Forecast - by Component
- 6.1.1. Electronic Health Records
- 6.1.2. e-Prescribing
- 6.1.3. Clinical Decision Support Systems
- 6.1.4. Telemedicine
- 6.1.5. Other Components
- 6.2. Market Analysis, Insights and Forecast - by Type of Service
- 6.2.1. Monitoring Service
- 6.2.2. Diagnosis Service
- 6.2.3. Therapeutic and Other Services
- 6.3. Market Analysis, Insights and Forecast - by End User
- 6.3.1. Hospitals
- 6.3.2. Insurance Companies
- 6.3.3. Other End Users
- 6.1. Market Analysis, Insights and Forecast - by Component
- 7. North America eHealth Market Analysis, Insights and Forecast, 2020-2032
- 7.1. Market Analysis, Insights and Forecast - by Component
- 7.1.1. Electronic Health Records
- 7.1.2. e-Prescribing
- 7.1.3. Clinical Decision Support Systems
- 7.1.4. Telemedicine
- 7.1.5. Other Components
- 7.2. Market Analysis, Insights and Forecast - by Type of Service
- 7.2.1. Monitoring Service
- 7.2.2. Diagnosis Service
- 7.2.3. Therapeutic and Other Services
- 7.3. Market Analysis, Insights and Forecast - by End User
- 7.3.1. Hospitals
- 7.3.2. Insurance Companies
- 7.3.3. Other End Users
- 7.1. Market Analysis, Insights and Forecast - by Component
- 8. Europe eHealth Market Analysis, Insights and Forecast, 2020-2032
- 8.1. Market Analysis, Insights and Forecast - by Component
- 8.1.1. Electronic Health Records
- 8.1.2. e-Prescribing
- 8.1.3. Clinical Decision Support Systems
- 8.1.4. Telemedicine
- 8.1.5. Other Components
- 8.2. Market Analysis, Insights and Forecast - by Type of Service
- 8.2.1. Monitoring Service
- 8.2.2. Diagnosis Service
- 8.2.3. Therapeutic and Other Services
- 8.3. Market Analysis, Insights and Forecast - by End User
- 8.3.1. Hospitals
- 8.3.2. Insurance Companies
- 8.3.3. Other End Users
- 8.1. Market Analysis, Insights and Forecast - by Component
- 9. Asia Pacific eHealth Market Analysis, Insights and Forecast, 2020-2032
- 9.1. Market Analysis, Insights and Forecast - by Component
- 9.1.1. Electronic Health Records
- 9.1.2. e-Prescribing
- 9.1.3. Clinical Decision Support Systems
- 9.1.4. Telemedicine
- 9.1.5. Other Components
- 9.2. Market Analysis, Insights and Forecast - by Type of Service
- 9.2.1. Monitoring Service
- 9.2.2. Diagnosis Service
- 9.2.3. Therapeutic and Other Services
- 9.3. Market Analysis, Insights and Forecast - by End User
- 9.3.1. Hospitals
- 9.3.2. Insurance Companies
- 9.3.3. Other End Users
- 9.1. Market Analysis, Insights and Forecast - by Component
- 10. Middle East and Africa eHealth Market Analysis, Insights and Forecast, 2020-2032
- 10.1. Market Analysis, Insights and Forecast - by Component
- 10.1.1. Electronic Health Records
- 10.1.2. e-Prescribing
- 10.1.3. Clinical Decision Support Systems
- 10.1.4. Telemedicine
- 10.1.5. Other Components
- 10.2. Market Analysis, Insights and Forecast - by Type of Service
- 10.2.1. Monitoring Service
- 10.2.2. Diagnosis Service
- 10.2.3. Therapeutic and Other Services
- 10.3. Market Analysis, Insights and Forecast - by End User
- 10.3.1. Hospitals
- 10.3.2. Insurance Companies
- 10.3.3. Other End Users
- 10.1. Market Analysis, Insights and Forecast - by Component
- 11. South America eHealth Market Analysis, Insights and Forecast, 2020-2032
- 11.1. Market Analysis, Insights and Forecast - by Component
- 11.1.1. Electronic Health Records
- 11.1.2. e-Prescribing
- 11.1.3. Clinical Decision Support Systems
- 11.1.4. Telemedicine
- 11.1.5. Other Components
- 11.2. Market Analysis, Insights and Forecast - by Type of Service
- 11.2.1. Monitoring Service
- 11.2.2. Diagnosis Service
- 11.2.3. Therapeutic and Other Services
- 11.3. Market Analysis, Insights and Forecast - by End User
- 11.3.1. Hospitals
- 11.3.2. Insurance Companies
- 11.3.3. Other End Users
- 11.1. Market Analysis, Insights and Forecast - by Component
- 12. Competitive Analysis
- 12.1. Company Profiles
- 12.1.1 eClinicalWorks
- 12.1.1.1. Company Overview
- 12.1.1.2. Products
- 12.1.1.3. Company Financials
- 12.1.1.4. SWOT Analysis
- 12.1.2 Optum Health
- 12.1.2.1. Company Overview
- 12.1.2.2. Products
- 12.1.2.3. Company Financials
- 12.1.2.4. SWOT Analysis
- 12.1.3 Epic Systems Corporation
- 12.1.3.1. Company Overview
- 12.1.3.2. Products
- 12.1.3.3. Company Financials
- 12.1.3.4. SWOT Analysis
- 12.1.4 Siemens Healthineers
- 12.1.4.1. Company Overview
- 12.1.4.2. Products
- 12.1.4.3. Company Financials
- 12.1.4.4. SWOT Analysis
- 12.1.5 GE Healthcare
- 12.1.5.1. Company Overview
- 12.1.5.2. Products
- 12.1.5.3. Company Financials
- 12.1.5.4. SWOT Analysis
- 12.1.6 Koninklijke Philips NV
- 12.1.6.1. Company Overview
- 12.1.6.2. Products
- 12.1.6.3. Company Financials
- 12.1.6.4. SWOT Analysis
- 12.1.7 CompuMed Inc
- 12.1.7.1. Company Overview
- 12.1.7.2. Products
- 12.1.7.3. Company Financials
- 12.1.7.4. SWOT Analysis
- 12.1.8 Veradigm LLC
- 12.1.8.1. Company Overview
- 12.1.8.2. Products
- 12.1.8.3. Company Financials
- 12.1.8.4. SWOT Analysis
- 12.1.9 athenahealth Inc
- 12.1.9.1. Company Overview
- 12.1.9.2. Products
- 12.1.9.3. Company Financials
- 12.1.9.4. SWOT Analysis
- 12.1.10 Boston Scientific Corporation
- 12.1.10.1. Company Overview
- 12.1.10.2. Products
- 12.1.10.3. Company Financials
- 12.1.10.4. SWOT Analysis
- 12.1.11 Oracle Cerner
- 12.1.11.1. Company Overview
- 12.1.11.2. Products
- 12.1.11.3. Company Financials
- 12.1.11.4. SWOT Analysis
- 12.1.1 eClinicalWorks
- 12.2. Market Entropy
- 12.2.1 Company's Key Areas Served
- 12.2.2 Recent Developments
- 12.3. Company Market Share Analysis 2025
- 12.3.1 Top 5 Companies Market Share Analysis
- 12.3.2 Top 3 Companies Market Share Analysis
- 12.4. List of Potential Customers
- 13. Research Methodology
List of Figures
- Figure 1: Global eHealth Market Revenue Breakdown (Million, %) by Region 2025 & 2033
- Figure 2: Global eHealth Market Volume Breakdown (K Unit, %) by Region 2025 & 2033
- Figure 3: North America eHealth Market Revenue (Million), by Component 2025 & 2033
- Figure 4: North America eHealth Market Volume (K Unit), by Component 2025 & 2033
- Figure 5: North America eHealth Market Revenue Share (%), by Component 2025 & 2033
- Figure 6: North America eHealth Market Volume Share (%), by Component 2025 & 2033
- Figure 7: North America eHealth Market Revenue (Million), by Type of Service 2025 & 2033
- Figure 8: North America eHealth Market Volume (K Unit), by Type of Service 2025 & 2033
- Figure 9: North America eHealth Market Revenue Share (%), by Type of Service 2025 & 2033
- Figure 10: North America eHealth Market Volume Share (%), by Type of Service 2025 & 2033
- Figure 11: North America eHealth Market Revenue (Million), by End User 2025 & 2033
- Figure 12: North America eHealth Market Volume (K Unit), by End User 2025 & 2033
- Figure 13: North America eHealth Market Revenue Share (%), by End User 2025 & 2033
- Figure 14: North America eHealth Market Volume Share (%), by End User 2025 & 2033
- Figure 15: North America eHealth Market Revenue (Million), by Country 2025 & 2033
- Figure 16: North America eHealth Market Volume (K Unit), by Country 2025 & 2033
- Figure 17: North America eHealth Market Revenue Share (%), by Country 2025 & 2033
- Figure 18: North America eHealth Market Volume Share (%), by Country 2025 & 2033
- Figure 19: Europe eHealth Market Revenue (Million), by Component 2025 & 2033
- Figure 20: Europe eHealth Market Volume (K Unit), by Component 2025 & 2033
- Figure 21: Europe eHealth Market Revenue Share (%), by Component 2025 & 2033
- Figure 22: Europe eHealth Market Volume Share (%), by Component 2025 & 2033
- Figure 23: Europe eHealth Market Revenue (Million), by Type of Service 2025 & 2033
- Figure 24: Europe eHealth Market Volume (K Unit), by Type of Service 2025 & 2033
- Figure 25: Europe eHealth Market Revenue Share (%), by Type of Service 2025 & 2033
- Figure 26: Europe eHealth Market Volume Share (%), by Type of Service 2025 & 2033
- Figure 27: Europe eHealth Market Revenue (Million), by End User 2025 & 2033
- Figure 28: Europe eHealth Market Volume (K Unit), by End User 2025 & 2033
- Figure 29: Europe eHealth Market Revenue Share (%), by End User 2025 & 2033
- Figure 30: Europe eHealth Market Volume Share (%), by End User 2025 & 2033
- Figure 31: Europe eHealth Market Revenue (Million), by Country 2025 & 2033
- Figure 32: Europe eHealth Market Volume (K Unit), by Country 2025 & 2033
- Figure 33: Europe eHealth Market Revenue Share (%), by Country 2025 & 2033
- Figure 34: Europe eHealth Market Volume Share (%), by Country 2025 & 2033
- Figure 35: Asia Pacific eHealth Market Revenue (Million), by Component 2025 & 2033
- Figure 36: Asia Pacific eHealth Market Volume (K Unit), by Component 2025 & 2033
- Figure 37: Asia Pacific eHealth Market Revenue Share (%), by Component 2025 & 2033
- Figure 38: Asia Pacific eHealth Market Volume Share (%), by Component 2025 & 2033
- Figure 39: Asia Pacific eHealth Market Revenue (Million), by Type of Service 2025 & 2033
- Figure 40: Asia Pacific eHealth Market Volume (K Unit), by Type of Service 2025 & 2033
- Figure 41: Asia Pacific eHealth Market Revenue Share (%), by Type of Service 2025 & 2033
- Figure 42: Asia Pacific eHealth Market Volume Share (%), by Type of Service 2025 & 2033
- Figure 43: Asia Pacific eHealth Market Revenue (Million), by End User 2025 & 2033
- Figure 44: Asia Pacific eHealth Market Volume (K Unit), by End User 2025 & 2033
- Figure 45: Asia Pacific eHealth Market Revenue Share (%), by End User 2025 & 2033
- Figure 46: Asia Pacific eHealth Market Volume Share (%), by End User 2025 & 2033
- Figure 47: Asia Pacific eHealth Market Revenue (Million), by Country 2025 & 2033
- Figure 48: Asia Pacific eHealth Market Volume (K Unit), by Country 2025 & 2033
- Figure 49: Asia Pacific eHealth Market Revenue Share (%), by Country 2025 & 2033
- Figure 50: Asia Pacific eHealth Market Volume Share (%), by Country 2025 & 2033
- Figure 51: Middle East and Africa eHealth Market Revenue (Million), by Component 2025 & 2033
- Figure 52: Middle East and Africa eHealth Market Volume (K Unit), by Component 2025 & 2033
- Figure 53: Middle East and Africa eHealth Market Revenue Share (%), by Component 2025 & 2033
- Figure 54: Middle East and Africa eHealth Market Volume Share (%), by Component 2025 & 2033
- Figure 55: Middle East and Africa eHealth Market Revenue (Million), by Type of Service 2025 & 2033
- Figure 56: Middle East and Africa eHealth Market Volume (K Unit), by Type of Service 2025 & 2033
- Figure 57: Middle East and Africa eHealth Market Revenue Share (%), by Type of Service 2025 & 2033
- Figure 58: Middle East and Africa eHealth Market Volume Share (%), by Type of Service 2025 & 2033
- Figure 59: Middle East and Africa eHealth Market Revenue (Million), by End User 2025 & 2033
- Figure 60: Middle East and Africa eHealth Market Volume (K Unit), by End User 2025 & 2033
- Figure 61: Middle East and Africa eHealth Market Revenue Share (%), by End User 2025 & 2033
- Figure 62: Middle East and Africa eHealth Market Volume Share (%), by End User 2025 & 2033
- Figure 63: Middle East and Africa eHealth Market Revenue (Million), by Country 2025 & 2033
- Figure 64: Middle East and Africa eHealth Market Volume (K Unit), by Country 2025 & 2033
- Figure 65: Middle East and Africa eHealth Market Revenue Share (%), by Country 2025 & 2033
- Figure 66: Middle East and Africa eHealth Market Volume Share (%), by Country 2025 & 2033
- Figure 67: South America eHealth Market Revenue (Million), by Component 2025 & 2033
- Figure 68: South America eHealth Market Volume (K Unit), by Component 2025 & 2033
- Figure 69: South America eHealth Market Revenue Share (%), by Component 2025 & 2033
- Figure 70: South America eHealth Market Volume Share (%), by Component 2025 & 2033
- Figure 71: South America eHealth Market Revenue (Million), by Type of Service 2025 & 2033
- Figure 72: South America eHealth Market Volume (K Unit), by Type of Service 2025 & 2033
- Figure 73: South America eHealth Market Revenue Share (%), by Type of Service 2025 & 2033
- Figure 74: South America eHealth Market Volume Share (%), by Type of Service 2025 & 2033
- Figure 75: South America eHealth Market Revenue (Million), by End User 2025 & 2033
- Figure 76: South America eHealth Market Volume (K Unit), by End User 2025 & 2033
- Figure 77: South America eHealth Market Revenue Share (%), by End User 2025 & 2033
- Figure 78: South America eHealth Market Volume Share (%), by End User 2025 & 2033
- Figure 79: South America eHealth Market Revenue (Million), by Country 2025 & 2033
- Figure 80: South America eHealth Market Volume (K Unit), by Country 2025 & 2033
- Figure 81: South America eHealth Market Revenue Share (%), by Country 2025 & 2033
- Figure 82: South America eHealth Market Volume Share (%), by Country 2025 & 2033
List of Tables
- Table 1: Global eHealth Market Revenue Million Forecast, by Component 2020 & 2033
- Table 2: Global eHealth Market Volume K Unit Forecast, by Component 2020 & 2033
- Table 3: Global eHealth Market Revenue Million Forecast, by Type of Service 2020 & 2033
- Table 4: Global eHealth Market Volume K Unit Forecast, by Type of Service 2020 & 2033
- Table 5: Global eHealth Market Revenue Million Forecast, by End User 2020 & 2033
- Table 6: Global eHealth Market Volume K Unit Forecast, by End User 2020 & 2033
- Table 7: Global eHealth Market Revenue Million Forecast, by Region 2020 & 2033
- Table 8: Global eHealth Market Volume K Unit Forecast, by Region 2020 & 2033
- Table 9: Global eHealth Market Revenue Million Forecast, by Component 2020 & 2033
- Table 10: Global eHealth Market Volume K Unit Forecast, by Component 2020 & 2033
- Table 11: Global eHealth Market Revenue Million Forecast, by Type of Service 2020 & 2033
- Table 12: Global eHealth Market Volume K Unit Forecast, by Type of Service 2020 & 2033
- Table 13: Global eHealth Market Revenue Million Forecast, by End User 2020 & 2033
- Table 14: Global eHealth Market Volume K Unit Forecast, by End User 2020 & 2033
- Table 15: Global eHealth Market Revenue Million Forecast, by Country 2020 & 2033
- Table 16: Global eHealth Market Volume K Unit Forecast, by Country 2020 & 2033
- Table 17: United States eHealth Market Revenue (Million) Forecast, by Application 2020 & 2033
- Table 18: United States eHealth Market Volume (K Unit) Forecast, by Application 2020 & 2033
- Table 19: Canada eHealth Market Revenue (Million) Forecast, by Application 2020 & 2033
- Table 20: Canada eHealth Market Volume (K Unit) Forecast, by Application 2020 & 2033
- Table 21: Mexico eHealth Market Revenue (Million) Forecast, by Application 2020 & 2033
- Table 22: Mexico eHealth Market Volume (K Unit) Forecast, by Application 2020 & 2033
- Table 23: Global eHealth Market Revenue Million Forecast, by Component 2020 & 2033
- Table 24: Global eHealth Market Volume K Unit Forecast, by Component 2020 & 2033
- Table 25: Global eHealth Market Revenue Million Forecast, by Type of Service 2020 & 2033
- Table 26: Global eHealth Market Volume K Unit Forecast, by Type of Service 2020 & 2033
- Table 27: Global eHealth Market Revenue Million Forecast, by End User 2020 & 2033
- Table 28: Global eHealth Market Volume K Unit Forecast, by End User 2020 & 2033
- Table 29: Global eHealth Market Revenue Million Forecast, by Country 2020 & 2033
- Table 30: Global eHealth Market Volume K Unit Forecast, by Country 2020 & 2033
- Table 31: United Kingdom eHealth Market Revenue (Million) Forecast, by Application 2020 & 2033
- Table 32: United Kingdom eHealth Market Volume (K Unit) Forecast, by Application 2020 & 2033
- Table 33: Germany eHealth Market Revenue (Million) Forecast, by Application 2020 & 2033
- Table 34: Germany eHealth Market Volume (K Unit) Forecast, by Application 2020 & 2033
- Table 35: France eHealth Market Revenue (Million) Forecast, by Application 2020 & 2033
- Table 36: France eHealth Market Volume (K Unit) Forecast, by Application 2020 & 2033
- Table 37: Italy eHealth Market Revenue (Million) Forecast, by Application 2020 & 2033
- Table 38: Italy eHealth Market Volume (K Unit) Forecast, by Application 2020 & 2033
- Table 39: Spain eHealth Market Revenue (Million) Forecast, by Application 2020 & 2033
- Table 40: Spain eHealth Market Volume (K Unit) Forecast, by Application 2020 & 2033
- Table 41: Rest of Europe eHealth Market Revenue (Million) Forecast, by Application 2020 & 2033
- Table 42: Rest of Europe eHealth Market Volume (K Unit) Forecast, by Application 2020 & 2033
- Table 43: Global eHealth Market Revenue Million Forecast, by Component 2020 & 2033
- Table 44: Global eHealth Market Volume K Unit Forecast, by Component 2020 & 2033
- Table 45: Global eHealth Market Revenue Million Forecast, by Type of Service 2020 & 2033
- Table 46: Global eHealth Market Volume K Unit Forecast, by Type of Service 2020 & 2033
- Table 47: Global eHealth Market Revenue Million Forecast, by End User 2020 & 2033
- Table 48: Global eHealth Market Volume K Unit Forecast, by End User 2020 & 2033
- Table 49: Global eHealth Market Revenue Million Forecast, by Country 2020 & 2033
- Table 50: Global eHealth Market Volume K Unit Forecast, by Country 2020 & 2033
- Table 51: China eHealth Market Revenue (Million) Forecast, by Application 2020 & 2033
- Table 52: China eHealth Market Volume (K Unit) Forecast, by Application 2020 & 2033
- Table 53: Japan eHealth Market Revenue (Million) Forecast, by Application 2020 & 2033
- Table 54: Japan eHealth Market Volume (K Unit) Forecast, by Application 2020 & 2033
- Table 55: India eHealth Market Revenue (Million) Forecast, by Application 2020 & 2033
- Table 56: India eHealth Market Volume (K Unit) Forecast, by Application 2020 & 2033
- Table 57: Australia eHealth Market Revenue (Million) Forecast, by Application 2020 & 2033
- Table 58: Australia eHealth Market Volume (K Unit) Forecast, by Application 2020 & 2033
- Table 59: South Korea eHealth Market Revenue (Million) Forecast, by Application 2020 & 2033
- Table 60: South Korea eHealth Market Volume (K Unit) Forecast, by Application 2020 & 2033
- Table 61: Rest of Asia Pacific eHealth Market Revenue (Million) Forecast, by Application 2020 & 2033
- Table 62: Rest of Asia Pacific eHealth Market Volume (K Unit) Forecast, by Application 2020 & 2033
- Table 63: Global eHealth Market Revenue Million Forecast, by Component 2020 & 2033
- Table 64: Global eHealth Market Volume K Unit Forecast, by Component 2020 & 2033
- Table 65: Global eHealth Market Revenue Million Forecast, by Type of Service 2020 & 2033
- Table 66: Global eHealth Market Volume K Unit Forecast, by Type of Service 2020 & 2033
- Table 67: Global eHealth Market Revenue Million Forecast, by End User 2020 & 2033
- Table 68: Global eHealth Market Volume K Unit Forecast, by End User 2020 & 2033
- Table 69: Global eHealth Market Revenue Million Forecast, by Country 2020 & 2033
- Table 70: Global eHealth Market Volume K Unit Forecast, by Country 2020 & 2033
- Table 71: GCC eHealth Market Revenue (Million) Forecast, by Application 2020 & 2033
- Table 72: GCC eHealth Market Volume (K Unit) Forecast, by Application 2020 & 2033
- Table 73: South Africa eHealth Market Revenue (Million) Forecast, by Application 2020 & 2033
- Table 74: South Africa eHealth Market Volume (K Unit) Forecast, by Application 2020 & 2033
- Table 75: Rest of Middle East and Africa eHealth Market Revenue (Million) Forecast, by Application 2020 & 2033
- Table 76: Rest of Middle East and Africa eHealth Market Volume (K Unit) Forecast, by Application 2020 & 2033
- Table 77: Global eHealth Market Revenue Million Forecast, by Component 2020 & 2033
- Table 78: Global eHealth Market Volume K Unit Forecast, by Component 2020 & 2033
- Table 79: Global eHealth Market Revenue Million Forecast, by Type of Service 2020 & 2033
- Table 80: Global eHealth Market Volume K Unit Forecast, by Type of Service 2020 & 2033
- Table 81: Global eHealth Market Revenue Million Forecast, by End User 2020 & 2033
- Table 82: Global eHealth Market Volume K Unit Forecast, by End User 2020 & 2033
- Table 83: Global eHealth Market Revenue Million Forecast, by Country 2020 & 2033
- Table 84: Global eHealth Market Volume K Unit Forecast, by Country 2020 & 2033
- Table 85: Brazil eHealth Market Revenue (Million) Forecast, by Application 2020 & 2033
- Table 86: Brazil eHealth Market Volume (K Unit) Forecast, by Application 2020 & 2033
- Table 87: Argentina eHealth Market Revenue (Million) Forecast, by Application 2020 & 2033
- Table 88: Argentina eHealth Market Volume (K Unit) Forecast, by Application 2020 & 2033
- Table 89: Rest of South America eHealth Market Revenue (Million) Forecast, by Application 2020 & 2033
- Table 90: Rest of South America eHealth Market Volume (K Unit) Forecast, by Application 2020 & 2033
Frequently Asked Questions
1. What is the projected Compound Annual Growth Rate (CAGR) of the eHealth Market?
The projected CAGR is approximately 16.02%.
2. Which companies are prominent players in the eHealth Market?
Key companies in the market include eClinicalWorks, Optum Health, Epic Systems Corporation, Siemens Healthineers, GE Healthcare, Koninklijke Philips NV, CompuMed Inc, Veradigm LLC, athenahealth Inc, Boston Scientific Corporation, Oracle Cerner.
3. What are the main segments of the eHealth Market?
The market segments include Component, Type of Service, End User.
4. Can you provide details about the market size?
The market size is estimated to be USD 236.47 Million as of 2022.
5. What are some drivers contributing to market growth?
Growth in IoT and Technological Innovations; Rising Preference Toward Mobile Technology and Internet; Rising Demand for Population Health Management.
6. What are the notable trends driving market growth?
e-Prescribing Segment is Expected to Hold a Significant Market Share Over The Forecast Period.
7. Are there any restraints impacting market growth?
Concerns over Data Security; Lack of Reimbursement Policies in the Emerging Markets; Lack of Proper Infrastructure for eHealth in Emerging Markets.
8. Can you provide examples of recent developments in the market?
January 2023: India's National Health Authority launched an incentive scheme for healthcare providers and other stakeholders of the country's digital health ecosystem to promote the creation of digital health records.
9. What pricing options are available for accessing the report?
Pricing options include single-user, multi-user, and enterprise licenses priced at USD 4750, USD 5250, and USD 8750 respectively.
10. Is the market size provided in terms of value or volume?
The market size is provided in terms of value, measured in Million and volume, measured in K Unit.
11. Are there any specific market keywords associated with the report?
Yes, the market keyword associated with the report is "eHealth Market," which aids in identifying and referencing the specific market segment covered.
12. How do I determine which pricing option suits my needs best?
The pricing options vary based on user requirements and access needs. Individual users may opt for single-user licenses, while businesses requiring broader access may choose multi-user or enterprise licenses for cost-effective access to the report.
13. Are there any additional resources or data provided in the eHealth Market report?
While the report offers comprehensive insights, it's advisable to review the specific contents or supplementary materials provided to ascertain if additional resources or data are available.
14. How can I stay updated on further developments or reports in the eHealth Market?
To stay informed about further developments, trends, and reports in the eHealth Market, consider subscribing to industry newsletters, following relevant companies and organizations, or regularly checking reputable industry news sources and publications.
Methodology
Step 1 - Identification of Relevant Samples Size from Population Database


Step 2 - Approaches for Defining Global Market Size (Value, Volume* & Price*)

Note*: In applicable scenarios
Step 3 - Data Sources
Primary Research
- Web Analytics
- Survey Reports
- Research Institute
- Latest Research Reports
- Opinion Leaders
Secondary Research
- Annual Reports
- White Paper
- Latest Press Release
- Industry Association
- Paid Database
- Investor Presentations

Step 4 - Data Triangulation
Involves using different sources of information in order to increase the validity of a study
These sources are likely to be stakeholders in a program - participants, other researchers, program staff, other community members, and so on.
Then we put all data in single framework & apply various statistical tools to find out the dynamic on the market.
During the analysis stage, feedback from the stakeholder groups would be compared to determine areas of agreement as well as areas of divergence