

Key Insights
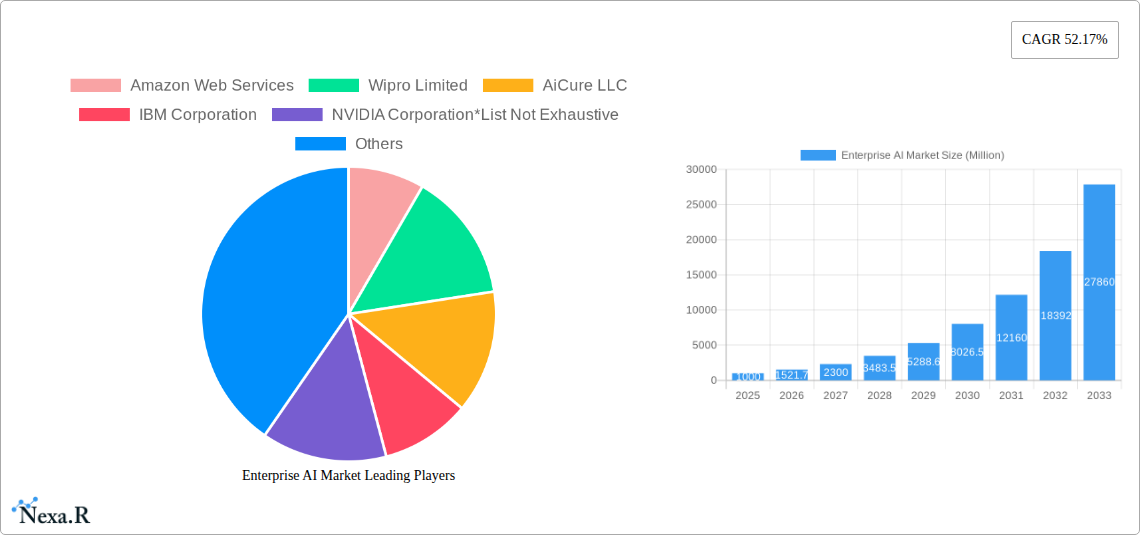
The Enterprise AI market is experiencing explosive growth, projected to reach a substantial size with a remarkable Compound Annual Growth Rate (CAGR) of 52.17% from 2025 to 2033. This rapid expansion is driven by several key factors. Firstly, the increasing adoption of cloud computing provides scalable and cost-effective infrastructure for AI deployment, fueling its integration across various industries. Secondly, the rise of big data and advanced analytics capabilities empowers businesses to leverage AI for enhanced decision-making, improved operational efficiency, and the development of innovative products and services. Furthermore, the maturation of AI technologies, such as machine learning and deep learning, along with the availability of pre-trained models and user-friendly development tools, has lowered the barrier to entry for businesses of all sizes. Finally, a strong push towards digital transformation and automation across sectors like manufacturing, finance, and healthcare is significantly boosting the demand for enterprise AI solutions.
However, despite this rapid growth, certain challenges persist. Data security and privacy concerns remain a major hurdle for widespread AI adoption. Furthermore, the lack of skilled AI professionals and the high cost of implementation can hinder growth in certain segments. Addressing these concerns through robust security protocols, investment in AI talent development, and the development of more affordable AI solutions are crucial for sustaining the market's upward trajectory. The market is segmented by type (solution and service), deployment (on-premise and cloud), and end-user industry (manufacturing, automotive, BFSI, IT and Telecommunication, media and advertising, and others). Key players such as Amazon Web Services, Microsoft, IBM, and Google are actively shaping the market landscape through continuous innovation and strategic partnerships. The geographic distribution of the market is broad, with North America and Asia Pacific expected to lead in terms of market share, fueled by technological advancements and high adoption rates.
This comprehensive report provides an in-depth analysis of the Enterprise AI market, encompassing market dynamics, growth trends, regional dominance, product landscape, key players, and future outlook. The study period covers 2019-2033, with 2025 as the base and estimated year. The forecast period is 2025-2033, and the historical period is 2019-2024. This report is invaluable for businesses, investors, and researchers seeking to understand and capitalize on the opportunities within this rapidly evolving market. The total market size in 2025 is estimated at xx Million.
Enterprise AI Market Market Dynamics & Structure
The Enterprise AI market is characterized by a dynamic interplay of factors influencing its structure and growth. Market concentration is moderate, with several key players holding significant shares but numerous smaller players contributing to innovation. Technological advancements, particularly in areas like deep learning, natural language processing (NLP), and computer vision, are major drivers. However, regulatory frameworks regarding data privacy and AI ethics pose challenges. Competitive product substitutes, such as traditional business intelligence tools, exert pressure. End-user demographics are diverse, spanning various industries, each with unique needs and adoption rates. Mergers and acquisitions (M&A) activity is robust, reflecting consolidation and expansion strategies among market players.
- Market Concentration: Moderate, with top 5 players holding approximately xx% market share in 2025.
- Technological Innovation: Rapid advancements in NLP, deep learning, and computer vision are driving adoption.
- Regulatory Frameworks: GDPR, CCPA, and other regulations impact data usage and AI development.
- Competitive Substitutes: Traditional business intelligence tools and analytics platforms pose competition.
- End-User Demographics: Manufacturing, BFSI, and IT/Telecom are key end-user segments.
- M&A Activity: xx M&A deals recorded in the last 5 years, with an average deal value of xx Million.
Enterprise AI Market Growth Trends & Insights
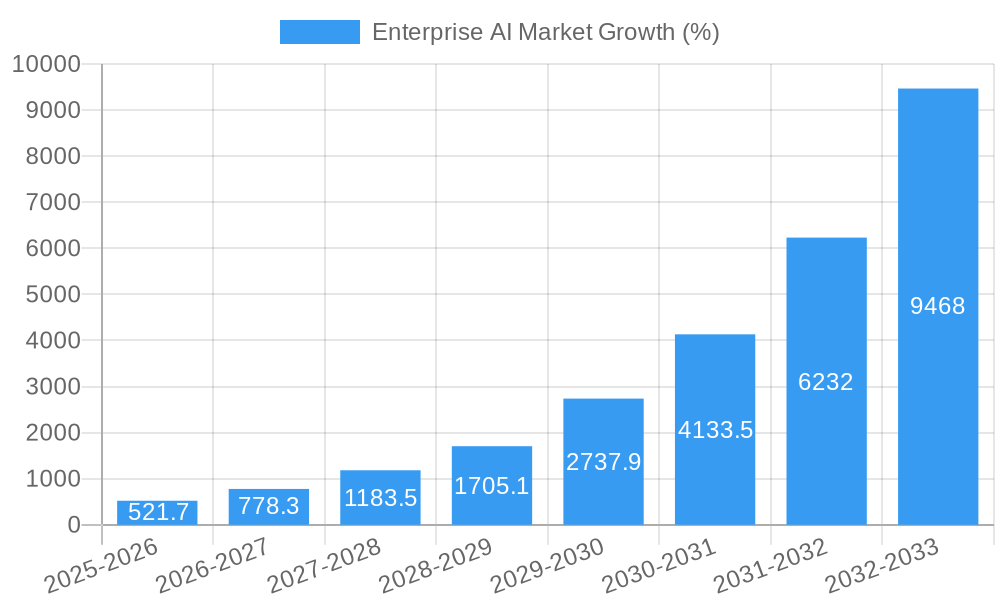
The Enterprise AI market has witnessed significant growth in recent years, driven by increasing data volumes, the need for improved operational efficiency, and the potential for data-driven decision-making. Adoption rates are rising across various industries, propelled by advancements in cloud computing and the accessibility of AI-as-a-Service (AIaaS) solutions. Technological disruptions, including the emergence of edge AI and explainable AI (XAI), are shaping market dynamics. Consumer behavior shifts towards personalized experiences and automated processes further fuel market expansion. The market is projected to experience a CAGR of xx% during the forecast period (2025-2033), reaching xx Million by 2033. Market penetration is expected to reach xx% by 2033. Specific industry adoption rates vary based on factors such as technological maturity, data availability, and regulatory environment. This analysis accounts for the impact of factors such as COVID-19 and global economic fluctuations on market growth trajectories.
Dominant Regions, Countries, or Segments in Enterprise AI Market
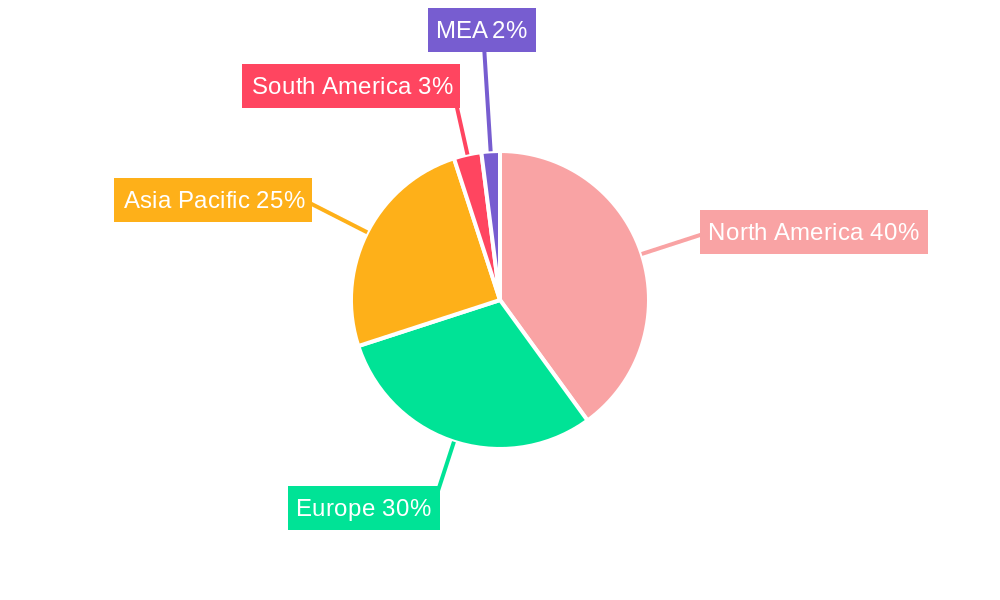
North America currently holds the largest market share in the Enterprise AI market, driven by strong technological innovation, early adoption, and substantial investments in AI research and development. However, the Asia-Pacific region is exhibiting the fastest growth rate, fueled by increasing digitalization, government support, and a large pool of tech-savvy consumers. Within segments, the Cloud deployment model dominates, with xx% market share, exceeding on-premise solutions due to its scalability, cost-effectiveness, and accessibility. In terms of type, the Solution segment holds a larger market share than the Service segment, accounting for approximately xx% of the market in 2025. The Manufacturing and BFSI sectors are leading end-user industries, showing high adoption due to the potential for operational efficiency improvements and risk management enhancements.
- North America: Strong technological innovation, early adoption, and high investments drive dominance.
- Asia-Pacific: Fastest-growing region due to digitalization and government support.
- Cloud Deployment: Dominant segment due to scalability and cost-effectiveness.
- Solution Segment: Larger market share compared to the Service segment.
- Manufacturing & BFSI: Leading end-user industries for Enterprise AI adoption.
Enterprise AI Market Product Landscape
The Enterprise AI market offers a diverse range of products, including AI-powered analytics platforms, machine learning models, natural language processing tools, and robotic process automation (RPA) solutions. These products are tailored to address specific business needs across various industries, offering features such as predictive analytics, fraud detection, customer relationship management (CRM) optimization, and supply chain management enhancements. Unique selling propositions include improved accuracy, enhanced efficiency, and cost reductions compared to traditional methods. Continuous technological advancements are driving product innovation, leading to improved performance metrics, such as reduced error rates, faster processing speeds, and enhanced user experiences.
Key Drivers, Barriers & Challenges in Enterprise AI Market
Key Drivers: Increased data availability, growing need for automation, advancements in AI algorithms (like deep learning), and government initiatives promoting AI adoption. For instance, several governments have launched AI-specific programs that provide funding to organizations adopting AI technologies.
Challenges & Restraints: High implementation costs, lack of skilled professionals, data security and privacy concerns, and integration complexities with existing IT infrastructure. These challenges, if not adequately addressed, can restrict market growth. For example, the shortage of skilled AI professionals poses a major barrier to the successful deployment of enterprise AI solutions. This can be attributed to the growing demand for expertise that is outpacing the supply of qualified individuals.
Emerging Opportunities in Enterprise AI Market
Emerging opportunities lie in sectors like healthcare, education, and smart cities, where AI can revolutionize processes and improve outcomes. The rise of edge AI enables real-time processing and reduces reliance on cloud connectivity. Hyperautomation, integrating AI with RPA and other technologies, streamlines workflows. Personalized experiences and AI-powered recommendations will further drive consumer engagement in various applications.
Growth Accelerators in the Enterprise AI Market Industry
Technological breakthroughs, such as the development of more efficient and reliable AI algorithms, are key catalysts for long-term growth. Strategic partnerships between technology companies and industry players facilitate innovation and market penetration. Government regulations and incentives promoting AI adoption play a crucial role. Expanding into untapped markets and developing innovative applications across diverse sectors will further accelerate growth.
Key Players Shaping the Enterprise AI Market Market
- Amazon Web Services
- Wipro Limited
- AiCure LLC
- IBM Corporation
- NVIDIA Corporation
- Hewlett Packard Enterprise
- Microsoft Corporation
- NEC Corporation
- Oracle Corporation
- Sentient Technologies
- Google Inc
- SAP SE
- Intel Corporation
Notable Milestones in Enterprise AI Market Sector
- September 2022: SAP updated its SAP SuccessFactors HMX Suite with AI capabilities for talent development.
- February 2022: Mozn, an enterprise AI startup, raised USD 10 million in Series A funding.
In-Depth Enterprise AI Market Market Outlook
The future of the Enterprise AI market is bright, with continued growth driven by technological advancements, increasing adoption across industries, and the emergence of new applications. Strategic partnerships and investments in research and development will be key factors in shaping the market landscape. The market's potential for transformative impact across various sectors ensures its continued expansion and evolution.
Enterprise AI Market Segmentation
-
1. Type
- 1.1. Solution
- 1.2. Service
-
2. Deployment
- 2.1. On-premise
- 2.2. Cloud
-
3. End-user Industry
- 3.1. Manufacturing
- 3.2. Automotive
- 3.3. BFSI
- 3.4. IT and Telecommunication
- 3.5. Media and Advertising
- 3.6. Other End-user Industries
Enterprise AI Market Segmentation By Geography
- 1. North America
- 2. Europe
- 3. Asia
- 4. Australia and New Zealand
- 5. Latin America
- 6. Middle East and Africa
Enterprise AI Market REPORT HIGHLIGHTS
| Aspects | Details |
|---|---|
| Study Period | 2019-2033 |
| Base Year | 2024 |
| Estimated Year | 2025 |
| Forecast Period | 2025-2033 |
| Historical Period | 2019-2024 |
| Growth Rate | CAGR of 52.17% from 2019-2033 |
| Segmentation |
|
Table of Contents
- 1. Introduction
- 1.1. Research Scope
- 1.2. Market Segmentation
- 1.3. Research Methodology
- 1.4. Definitions and Assumptions
- 2. Executive Summary
- 2.1. Introduction
- 3. Market Dynamics
- 3.1. Introduction
- 3.2. Market Drivers
- 3.2.1. Increasing Demand for Automation and AI-based Solutions; Increasing Need to Analyze Exponentially Growing Data Sets
- 3.3. Market Restrains
- 3.3.1. Sluggish Adoption Rates
- 3.4. Market Trends
- 3.4.1. Cloud Deployment is Expected to Experience a Significant Market Growth
- 4. Market Factor Analysis
- 4.1. Porters Five Forces
- 4.2. Supply/Value Chain
- 4.3. PESTEL analysis
- 4.4. Market Entropy
- 4.5. Patent/Trademark Analysis
- 5. Global Enterprise AI Market Analysis, Insights and Forecast, 2019-2031
- 5.1. Market Analysis, Insights and Forecast - by Type
- 5.1.1. Solution
- 5.1.2. Service
- 5.2. Market Analysis, Insights and Forecast - by Deployment
- 5.2.1. On-premise
- 5.2.2. Cloud
- 5.3. Market Analysis, Insights and Forecast - by End-user Industry
- 5.3.1. Manufacturing
- 5.3.2. Automotive
- 5.3.3. BFSI
- 5.3.4. IT and Telecommunication
- 5.3.5. Media and Advertising
- 5.3.6. Other End-user Industries
- 5.4. Market Analysis, Insights and Forecast - by Region
- 5.4.1. North America
- 5.4.2. Europe
- 5.4.3. Asia
- 5.4.4. Australia and New Zealand
- 5.4.5. Latin America
- 5.4.6. Middle East and Africa
- 5.1. Market Analysis, Insights and Forecast - by Type
- 6. North America Enterprise AI Market Analysis, Insights and Forecast, 2019-2031
- 6.1. Market Analysis, Insights and Forecast - by Type
- 6.1.1. Solution
- 6.1.2. Service
- 6.2. Market Analysis, Insights and Forecast - by Deployment
- 6.2.1. On-premise
- 6.2.2. Cloud
- 6.3. Market Analysis, Insights and Forecast - by End-user Industry
- 6.3.1. Manufacturing
- 6.3.2. Automotive
- 6.3.3. BFSI
- 6.3.4. IT and Telecommunication
- 6.3.5. Media and Advertising
- 6.3.6. Other End-user Industries
- 6.1. Market Analysis, Insights and Forecast - by Type
- 7. Europe Enterprise AI Market Analysis, Insights and Forecast, 2019-2031
- 7.1. Market Analysis, Insights and Forecast - by Type
- 7.1.1. Solution
- 7.1.2. Service
- 7.2. Market Analysis, Insights and Forecast - by Deployment
- 7.2.1. On-premise
- 7.2.2. Cloud
- 7.3. Market Analysis, Insights and Forecast - by End-user Industry
- 7.3.1. Manufacturing
- 7.3.2. Automotive
- 7.3.3. BFSI
- 7.3.4. IT and Telecommunication
- 7.3.5. Media and Advertising
- 7.3.6. Other End-user Industries
- 7.1. Market Analysis, Insights and Forecast - by Type
- 8. Asia Enterprise AI Market Analysis, Insights and Forecast, 2019-2031
- 8.1. Market Analysis, Insights and Forecast - by Type
- 8.1.1. Solution
- 8.1.2. Service
- 8.2. Market Analysis, Insights and Forecast - by Deployment
- 8.2.1. On-premise
- 8.2.2. Cloud
- 8.3. Market Analysis, Insights and Forecast - by End-user Industry
- 8.3.1. Manufacturing
- 8.3.2. Automotive
- 8.3.3. BFSI
- 8.3.4. IT and Telecommunication
- 8.3.5. Media and Advertising
- 8.3.6. Other End-user Industries
- 8.1. Market Analysis, Insights and Forecast - by Type
- 9. Australia and New Zealand Enterprise AI Market Analysis, Insights and Forecast, 2019-2031
- 9.1. Market Analysis, Insights and Forecast - by Type
- 9.1.1. Solution
- 9.1.2. Service
- 9.2. Market Analysis, Insights and Forecast - by Deployment
- 9.2.1. On-premise
- 9.2.2. Cloud
- 9.3. Market Analysis, Insights and Forecast - by End-user Industry
- 9.3.1. Manufacturing
- 9.3.2. Automotive
- 9.3.3. BFSI
- 9.3.4. IT and Telecommunication
- 9.3.5. Media and Advertising
- 9.3.6. Other End-user Industries
- 9.1. Market Analysis, Insights and Forecast - by Type
- 10. Latin America Enterprise AI Market Analysis, Insights and Forecast, 2019-2031
- 10.1. Market Analysis, Insights and Forecast - by Type
- 10.1.1. Solution
- 10.1.2. Service
- 10.2. Market Analysis, Insights and Forecast - by Deployment
- 10.2.1. On-premise
- 10.2.2. Cloud
- 10.3. Market Analysis, Insights and Forecast - by End-user Industry
- 10.3.1. Manufacturing
- 10.3.2. Automotive
- 10.3.3. BFSI
- 10.3.4. IT and Telecommunication
- 10.3.5. Media and Advertising
- 10.3.6. Other End-user Industries
- 10.1. Market Analysis, Insights and Forecast - by Type
- 11. Middle East and Africa Enterprise AI Market Analysis, Insights and Forecast, 2019-2031
- 11.1. Market Analysis, Insights and Forecast - by Type
- 11.1.1. Solution
- 11.1.2. Service
- 11.2. Market Analysis, Insights and Forecast - by Deployment
- 11.2.1. On-premise
- 11.2.2. Cloud
- 11.3. Market Analysis, Insights and Forecast - by End-user Industry
- 11.3.1. Manufacturing
- 11.3.2. Automotive
- 11.3.3. BFSI
- 11.3.4. IT and Telecommunication
- 11.3.5. Media and Advertising
- 11.3.6. Other End-user Industries
- 11.1. Market Analysis, Insights and Forecast - by Type
- 12. North America Enterprise AI Market Analysis, Insights and Forecast, 2019-2031
- 12.1. Market Analysis, Insights and Forecast - By Country/Sub-region
- 12.1.1 United States
- 12.1.2 Canada
- 12.1.3 Mexico
- 13. Europe Enterprise AI Market Analysis, Insights and Forecast, 2019-2031
- 13.1. Market Analysis, Insights and Forecast - By Country/Sub-region
- 13.1.1 Germany
- 13.1.2 United Kingdom
- 13.1.3 France
- 13.1.4 Spain
- 13.1.5 Italy
- 13.1.6 Spain
- 13.1.7 Belgium
- 13.1.8 Netherland
- 13.1.9 Nordics
- 13.1.10 Rest of Europe
- 14. Asia Pacific Enterprise AI Market Analysis, Insights and Forecast, 2019-2031
- 14.1. Market Analysis, Insights and Forecast - By Country/Sub-region
- 14.1.1 China
- 14.1.2 Japan
- 14.1.3 India
- 14.1.4 South Korea
- 14.1.5 Southeast Asia
- 14.1.6 Australia
- 14.1.7 Indonesia
- 14.1.8 Phillipes
- 14.1.9 Singapore
- 14.1.10 Thailandc
- 14.1.11 Rest of Asia Pacific
- 15. South America Enterprise AI Market Analysis, Insights and Forecast, 2019-2031
- 15.1. Market Analysis, Insights and Forecast - By Country/Sub-region
- 15.1.1 Brazil
- 15.1.2 Argentina
- 15.1.3 Peru
- 15.1.4 Chile
- 15.1.5 Colombia
- 15.1.6 Ecuador
- 15.1.7 Venezuela
- 15.1.8 Rest of South America
- 16. North America Enterprise AI Market Analysis, Insights and Forecast, 2019-2031
- 16.1. Market Analysis, Insights and Forecast - By Country/Sub-region
- 16.1.1 United States
- 16.1.2 Canada
- 16.1.3 Mexico
- 17. MEA Enterprise AI Market Analysis, Insights and Forecast, 2019-2031
- 17.1. Market Analysis, Insights and Forecast - By Country/Sub-region
- 17.1.1 United Arab Emirates
- 17.1.2 Saudi Arabia
- 17.1.3 South Africa
- 17.1.4 Rest of Middle East and Africa
- 18. Competitive Analysis
- 18.1. Global Market Share Analysis 2024
- 18.2. Company Profiles
- 18.2.1 Amazon Web Services
- 18.2.1.1. Overview
- 18.2.1.2. Products
- 18.2.1.3. SWOT Analysis
- 18.2.1.4. Recent Developments
- 18.2.1.5. Financials (Based on Availability)
- 18.2.2 Wipro Limited
- 18.2.2.1. Overview
- 18.2.2.2. Products
- 18.2.2.3. SWOT Analysis
- 18.2.2.4. Recent Developments
- 18.2.2.5. Financials (Based on Availability)
- 18.2.3 AiCure LLC
- 18.2.3.1. Overview
- 18.2.3.2. Products
- 18.2.3.3. SWOT Analysis
- 18.2.3.4. Recent Developments
- 18.2.3.5. Financials (Based on Availability)
- 18.2.4 IBM Corporation
- 18.2.4.1. Overview
- 18.2.4.2. Products
- 18.2.4.3. SWOT Analysis
- 18.2.4.4. Recent Developments
- 18.2.4.5. Financials (Based on Availability)
- 18.2.5 NVIDIA Corporation*List Not Exhaustive
- 18.2.5.1. Overview
- 18.2.5.2. Products
- 18.2.5.3. SWOT Analysis
- 18.2.5.4. Recent Developments
- 18.2.5.5. Financials (Based on Availability)
- 18.2.6 Hewlett Packard Enterprise
- 18.2.6.1. Overview
- 18.2.6.2. Products
- 18.2.6.3. SWOT Analysis
- 18.2.6.4. Recent Developments
- 18.2.6.5. Financials (Based on Availability)
- 18.2.7 Microsoft Corporation
- 18.2.7.1. Overview
- 18.2.7.2. Products
- 18.2.7.3. SWOT Analysis
- 18.2.7.4. Recent Developments
- 18.2.7.5. Financials (Based on Availability)
- 18.2.8 NEC Corporation
- 18.2.8.1. Overview
- 18.2.8.2. Products
- 18.2.8.3. SWOT Analysis
- 18.2.8.4. Recent Developments
- 18.2.8.5. Financials (Based on Availability)
- 18.2.9 Oracle Corporation
- 18.2.9.1. Overview
- 18.2.9.2. Products
- 18.2.9.3. SWOT Analysis
- 18.2.9.4. Recent Developments
- 18.2.9.5. Financials (Based on Availability)
- 18.2.10 Sentient Technologies
- 18.2.10.1. Overview
- 18.2.10.2. Products
- 18.2.10.3. SWOT Analysis
- 18.2.10.4. Recent Developments
- 18.2.10.5. Financials (Based on Availability)
- 18.2.11 Google Inc
- 18.2.11.1. Overview
- 18.2.11.2. Products
- 18.2.11.3. SWOT Analysis
- 18.2.11.4. Recent Developments
- 18.2.11.5. Financials (Based on Availability)
- 18.2.12 SAP SE
- 18.2.12.1. Overview
- 18.2.12.2. Products
- 18.2.12.3. SWOT Analysis
- 18.2.12.4. Recent Developments
- 18.2.12.5. Financials (Based on Availability)
- 18.2.13 Intel Corporation
- 18.2.13.1. Overview
- 18.2.13.2. Products
- 18.2.13.3. SWOT Analysis
- 18.2.13.4. Recent Developments
- 18.2.13.5. Financials (Based on Availability)
- 18.2.1 Amazon Web Services
List of Figures
- Figure 1: Global Enterprise AI Market Revenue Breakdown (Million, %) by Region 2024 & 2032
- Figure 2: North America Enterprise AI Market Revenue (Million), by Country 2024 & 2032
- Figure 3: North America Enterprise AI Market Revenue Share (%), by Country 2024 & 2032
- Figure 4: Europe Enterprise AI Market Revenue (Million), by Country 2024 & 2032
- Figure 5: Europe Enterprise AI Market Revenue Share (%), by Country 2024 & 2032
- Figure 6: Asia Pacific Enterprise AI Market Revenue (Million), by Country 2024 & 2032
- Figure 7: Asia Pacific Enterprise AI Market Revenue Share (%), by Country 2024 & 2032
- Figure 8: South America Enterprise AI Market Revenue (Million), by Country 2024 & 2032
- Figure 9: South America Enterprise AI Market Revenue Share (%), by Country 2024 & 2032
- Figure 10: North America Enterprise AI Market Revenue (Million), by Country 2024 & 2032
- Figure 11: North America Enterprise AI Market Revenue Share (%), by Country 2024 & 2032
- Figure 12: MEA Enterprise AI Market Revenue (Million), by Country 2024 & 2032
- Figure 13: MEA Enterprise AI Market Revenue Share (%), by Country 2024 & 2032
- Figure 14: North America Enterprise AI Market Revenue (Million), by Type 2024 & 2032
- Figure 15: North America Enterprise AI Market Revenue Share (%), by Type 2024 & 2032
- Figure 16: North America Enterprise AI Market Revenue (Million), by Deployment 2024 & 2032
- Figure 17: North America Enterprise AI Market Revenue Share (%), by Deployment 2024 & 2032
- Figure 18: North America Enterprise AI Market Revenue (Million), by End-user Industry 2024 & 2032
- Figure 19: North America Enterprise AI Market Revenue Share (%), by End-user Industry 2024 & 2032
- Figure 20: North America Enterprise AI Market Revenue (Million), by Country 2024 & 2032
- Figure 21: North America Enterprise AI Market Revenue Share (%), by Country 2024 & 2032
- Figure 22: Europe Enterprise AI Market Revenue (Million), by Type 2024 & 2032
- Figure 23: Europe Enterprise AI Market Revenue Share (%), by Type 2024 & 2032
- Figure 24: Europe Enterprise AI Market Revenue (Million), by Deployment 2024 & 2032
- Figure 25: Europe Enterprise AI Market Revenue Share (%), by Deployment 2024 & 2032
- Figure 26: Europe Enterprise AI Market Revenue (Million), by End-user Industry 2024 & 2032
- Figure 27: Europe Enterprise AI Market Revenue Share (%), by End-user Industry 2024 & 2032
- Figure 28: Europe Enterprise AI Market Revenue (Million), by Country 2024 & 2032
- Figure 29: Europe Enterprise AI Market Revenue Share (%), by Country 2024 & 2032
- Figure 30: Asia Enterprise AI Market Revenue (Million), by Type 2024 & 2032
- Figure 31: Asia Enterprise AI Market Revenue Share (%), by Type 2024 & 2032
- Figure 32: Asia Enterprise AI Market Revenue (Million), by Deployment 2024 & 2032
- Figure 33: Asia Enterprise AI Market Revenue Share (%), by Deployment 2024 & 2032
- Figure 34: Asia Enterprise AI Market Revenue (Million), by End-user Industry 2024 & 2032
- Figure 35: Asia Enterprise AI Market Revenue Share (%), by End-user Industry 2024 & 2032
- Figure 36: Asia Enterprise AI Market Revenue (Million), by Country 2024 & 2032
- Figure 37: Asia Enterprise AI Market Revenue Share (%), by Country 2024 & 2032
- Figure 38: Australia and New Zealand Enterprise AI Market Revenue (Million), by Type 2024 & 2032
- Figure 39: Australia and New Zealand Enterprise AI Market Revenue Share (%), by Type 2024 & 2032
- Figure 40: Australia and New Zealand Enterprise AI Market Revenue (Million), by Deployment 2024 & 2032
- Figure 41: Australia and New Zealand Enterprise AI Market Revenue Share (%), by Deployment 2024 & 2032
- Figure 42: Australia and New Zealand Enterprise AI Market Revenue (Million), by End-user Industry 2024 & 2032
- Figure 43: Australia and New Zealand Enterprise AI Market Revenue Share (%), by End-user Industry 2024 & 2032
- Figure 44: Australia and New Zealand Enterprise AI Market Revenue (Million), by Country 2024 & 2032
- Figure 45: Australia and New Zealand Enterprise AI Market Revenue Share (%), by Country 2024 & 2032
- Figure 46: Latin America Enterprise AI Market Revenue (Million), by Type 2024 & 2032
- Figure 47: Latin America Enterprise AI Market Revenue Share (%), by Type 2024 & 2032
- Figure 48: Latin America Enterprise AI Market Revenue (Million), by Deployment 2024 & 2032
- Figure 49: Latin America Enterprise AI Market Revenue Share (%), by Deployment 2024 & 2032
- Figure 50: Latin America Enterprise AI Market Revenue (Million), by End-user Industry 2024 & 2032
- Figure 51: Latin America Enterprise AI Market Revenue Share (%), by End-user Industry 2024 & 2032
- Figure 52: Latin America Enterprise AI Market Revenue (Million), by Country 2024 & 2032
- Figure 53: Latin America Enterprise AI Market Revenue Share (%), by Country 2024 & 2032
- Figure 54: Middle East and Africa Enterprise AI Market Revenue (Million), by Type 2024 & 2032
- Figure 55: Middle East and Africa Enterprise AI Market Revenue Share (%), by Type 2024 & 2032
- Figure 56: Middle East and Africa Enterprise AI Market Revenue (Million), by Deployment 2024 & 2032
- Figure 57: Middle East and Africa Enterprise AI Market Revenue Share (%), by Deployment 2024 & 2032
- Figure 58: Middle East and Africa Enterprise AI Market Revenue (Million), by End-user Industry 2024 & 2032
- Figure 59: Middle East and Africa Enterprise AI Market Revenue Share (%), by End-user Industry 2024 & 2032
- Figure 60: Middle East and Africa Enterprise AI Market Revenue (Million), by Country 2024 & 2032
- Figure 61: Middle East and Africa Enterprise AI Market Revenue Share (%), by Country 2024 & 2032
List of Tables
- Table 1: Global Enterprise AI Market Revenue Million Forecast, by Region 2019 & 2032
- Table 2: Global Enterprise AI Market Revenue Million Forecast, by Type 2019 & 2032
- Table 3: Global Enterprise AI Market Revenue Million Forecast, by Deployment 2019 & 2032
- Table 4: Global Enterprise AI Market Revenue Million Forecast, by End-user Industry 2019 & 2032
- Table 5: Global Enterprise AI Market Revenue Million Forecast, by Region 2019 & 2032
- Table 6: Global Enterprise AI Market Revenue Million Forecast, by Country 2019 & 2032
- Table 7: United States Enterprise AI Market Revenue (Million) Forecast, by Application 2019 & 2032
- Table 8: Canada Enterprise AI Market Revenue (Million) Forecast, by Application 2019 & 2032
- Table 9: Mexico Enterprise AI Market Revenue (Million) Forecast, by Application 2019 & 2032
- Table 10: Global Enterprise AI Market Revenue Million Forecast, by Country 2019 & 2032
- Table 11: Germany Enterprise AI Market Revenue (Million) Forecast, by Application 2019 & 2032
- Table 12: United Kingdom Enterprise AI Market Revenue (Million) Forecast, by Application 2019 & 2032
- Table 13: France Enterprise AI Market Revenue (Million) Forecast, by Application 2019 & 2032
- Table 14: Spain Enterprise AI Market Revenue (Million) Forecast, by Application 2019 & 2032
- Table 15: Italy Enterprise AI Market Revenue (Million) Forecast, by Application 2019 & 2032
- Table 16: Spain Enterprise AI Market Revenue (Million) Forecast, by Application 2019 & 2032
- Table 17: Belgium Enterprise AI Market Revenue (Million) Forecast, by Application 2019 & 2032
- Table 18: Netherland Enterprise AI Market Revenue (Million) Forecast, by Application 2019 & 2032
- Table 19: Nordics Enterprise AI Market Revenue (Million) Forecast, by Application 2019 & 2032
- Table 20: Rest of Europe Enterprise AI Market Revenue (Million) Forecast, by Application 2019 & 2032
- Table 21: Global Enterprise AI Market Revenue Million Forecast, by Country 2019 & 2032
- Table 22: China Enterprise AI Market Revenue (Million) Forecast, by Application 2019 & 2032
- Table 23: Japan Enterprise AI Market Revenue (Million) Forecast, by Application 2019 & 2032
- Table 24: India Enterprise AI Market Revenue (Million) Forecast, by Application 2019 & 2032
- Table 25: South Korea Enterprise AI Market Revenue (Million) Forecast, by Application 2019 & 2032
- Table 26: Southeast Asia Enterprise AI Market Revenue (Million) Forecast, by Application 2019 & 2032
- Table 27: Australia Enterprise AI Market Revenue (Million) Forecast, by Application 2019 & 2032
- Table 28: Indonesia Enterprise AI Market Revenue (Million) Forecast, by Application 2019 & 2032
- Table 29: Phillipes Enterprise AI Market Revenue (Million) Forecast, by Application 2019 & 2032
- Table 30: Singapore Enterprise AI Market Revenue (Million) Forecast, by Application 2019 & 2032
- Table 31: Thailandc Enterprise AI Market Revenue (Million) Forecast, by Application 2019 & 2032
- Table 32: Rest of Asia Pacific Enterprise AI Market Revenue (Million) Forecast, by Application 2019 & 2032
- Table 33: Global Enterprise AI Market Revenue Million Forecast, by Country 2019 & 2032
- Table 34: Brazil Enterprise AI Market Revenue (Million) Forecast, by Application 2019 & 2032
- Table 35: Argentina Enterprise AI Market Revenue (Million) Forecast, by Application 2019 & 2032
- Table 36: Peru Enterprise AI Market Revenue (Million) Forecast, by Application 2019 & 2032
- Table 37: Chile Enterprise AI Market Revenue (Million) Forecast, by Application 2019 & 2032
- Table 38: Colombia Enterprise AI Market Revenue (Million) Forecast, by Application 2019 & 2032
- Table 39: Ecuador Enterprise AI Market Revenue (Million) Forecast, by Application 2019 & 2032
- Table 40: Venezuela Enterprise AI Market Revenue (Million) Forecast, by Application 2019 & 2032
- Table 41: Rest of South America Enterprise AI Market Revenue (Million) Forecast, by Application 2019 & 2032
- Table 42: Global Enterprise AI Market Revenue Million Forecast, by Country 2019 & 2032
- Table 43: United States Enterprise AI Market Revenue (Million) Forecast, by Application 2019 & 2032
- Table 44: Canada Enterprise AI Market Revenue (Million) Forecast, by Application 2019 & 2032
- Table 45: Mexico Enterprise AI Market Revenue (Million) Forecast, by Application 2019 & 2032
- Table 46: Global Enterprise AI Market Revenue Million Forecast, by Country 2019 & 2032
- Table 47: United Arab Emirates Enterprise AI Market Revenue (Million) Forecast, by Application 2019 & 2032
- Table 48: Saudi Arabia Enterprise AI Market Revenue (Million) Forecast, by Application 2019 & 2032
- Table 49: South Africa Enterprise AI Market Revenue (Million) Forecast, by Application 2019 & 2032
- Table 50: Rest of Middle East and Africa Enterprise AI Market Revenue (Million) Forecast, by Application 2019 & 2032
- Table 51: Global Enterprise AI Market Revenue Million Forecast, by Type 2019 & 2032
- Table 52: Global Enterprise AI Market Revenue Million Forecast, by Deployment 2019 & 2032
- Table 53: Global Enterprise AI Market Revenue Million Forecast, by End-user Industry 2019 & 2032
- Table 54: Global Enterprise AI Market Revenue Million Forecast, by Country 2019 & 2032
- Table 55: Global Enterprise AI Market Revenue Million Forecast, by Type 2019 & 2032
- Table 56: Global Enterprise AI Market Revenue Million Forecast, by Deployment 2019 & 2032
- Table 57: Global Enterprise AI Market Revenue Million Forecast, by End-user Industry 2019 & 2032
- Table 58: Global Enterprise AI Market Revenue Million Forecast, by Country 2019 & 2032
- Table 59: Global Enterprise AI Market Revenue Million Forecast, by Type 2019 & 2032
- Table 60: Global Enterprise AI Market Revenue Million Forecast, by Deployment 2019 & 2032
- Table 61: Global Enterprise AI Market Revenue Million Forecast, by End-user Industry 2019 & 2032
- Table 62: Global Enterprise AI Market Revenue Million Forecast, by Country 2019 & 2032
- Table 63: Global Enterprise AI Market Revenue Million Forecast, by Type 2019 & 2032
- Table 64: Global Enterprise AI Market Revenue Million Forecast, by Deployment 2019 & 2032
- Table 65: Global Enterprise AI Market Revenue Million Forecast, by End-user Industry 2019 & 2032
- Table 66: Global Enterprise AI Market Revenue Million Forecast, by Country 2019 & 2032
- Table 67: Global Enterprise AI Market Revenue Million Forecast, by Type 2019 & 2032
- Table 68: Global Enterprise AI Market Revenue Million Forecast, by Deployment 2019 & 2032
- Table 69: Global Enterprise AI Market Revenue Million Forecast, by End-user Industry 2019 & 2032
- Table 70: Global Enterprise AI Market Revenue Million Forecast, by Country 2019 & 2032
- Table 71: Global Enterprise AI Market Revenue Million Forecast, by Type 2019 & 2032
- Table 72: Global Enterprise AI Market Revenue Million Forecast, by Deployment 2019 & 2032
- Table 73: Global Enterprise AI Market Revenue Million Forecast, by End-user Industry 2019 & 2032
- Table 74: Global Enterprise AI Market Revenue Million Forecast, by Country 2019 & 2032
Frequently Asked Questions
1. What is the projected Compound Annual Growth Rate (CAGR) of the Enterprise AI Market?
The projected CAGR is approximately 52.17%.
2. Which companies are prominent players in the Enterprise AI Market?
Key companies in the market include Amazon Web Services, Wipro Limited, AiCure LLC, IBM Corporation, NVIDIA Corporation*List Not Exhaustive, Hewlett Packard Enterprise, Microsoft Corporation, NEC Corporation, Oracle Corporation, Sentient Technologies, Google Inc, SAP SE, Intel Corporation.
3. What are the main segments of the Enterprise AI Market?
The market segments include Type, Deployment, End-user Industry.
4. Can you provide details about the market size?
The market size is estimated to be USD XX Million as of 2022.
5. What are some drivers contributing to market growth?
Increasing Demand for Automation and AI-based Solutions; Increasing Need to Analyze Exponentially Growing Data Sets.
6. What are the notable trends driving market growth?
Cloud Deployment is Expected to Experience a Significant Market Growth.
7. Are there any restraints impacting market growth?
Sluggish Adoption Rates.
8. Can you provide examples of recent developments in the market?
September 2022: SAP updated the core of its SAP SuccessFactors Human Experience Management (HMX) Suite to give businesses a more effective means of implementing an integrated talent development strategy and building a workforce prepared for the future. To give companies a better understanding of the capabilities within their workforce and actionable talent intelligence to align their people with the organization's needs, the most recent developments to the SAP SuccessFactors HMX Suite combine data, machine learning, and artificial intelligence (AI).
9. What pricing options are available for accessing the report?
Pricing options include single-user, multi-user, and enterprise licenses priced at USD 4750, USD 5250, and USD 8750 respectively.
10. Is the market size provided in terms of value or volume?
The market size is provided in terms of value, measured in Million.
11. Are there any specific market keywords associated with the report?
Yes, the market keyword associated with the report is "Enterprise AI Market," which aids in identifying and referencing the specific market segment covered.
12. How do I determine which pricing option suits my needs best?
The pricing options vary based on user requirements and access needs. Individual users may opt for single-user licenses, while businesses requiring broader access may choose multi-user or enterprise licenses for cost-effective access to the report.
13. Are there any additional resources or data provided in the Enterprise AI Market report?
While the report offers comprehensive insights, it's advisable to review the specific contents or supplementary materials provided to ascertain if additional resources or data are available.
14. How can I stay updated on further developments or reports in the Enterprise AI Market?
To stay informed about further developments, trends, and reports in the Enterprise AI Market, consider subscribing to industry newsletters, following relevant companies and organizations, or regularly checking reputable industry news sources and publications.
Methodology
Step 1 - Identification of Relevant Samples Size from Population Database


Step 2 - Approaches for Defining Global Market Size (Value, Volume* & Price*)

Note*: In applicable scenarios
Step 3 - Data Sources
Primary Research
- Web Analytics
- Survey Reports
- Research Institute
- Latest Research Reports
- Opinion Leaders
Secondary Research
- Annual Reports
- White Paper
- Latest Press Release
- Industry Association
- Paid Database
- Investor Presentations

Step 4 - Data Triangulation
Involves using different sources of information in order to increase the validity of a study
These sources are likely to be stakeholders in a program - participants, other researchers, program staff, other community members, and so on.
Then we put all data in single framework & apply various statistical tools to find out the dynamic on the market.
During the analysis stage, feedback from the stakeholder groups would be compared to determine areas of agreement as well as areas of divergence
