

Key Insights
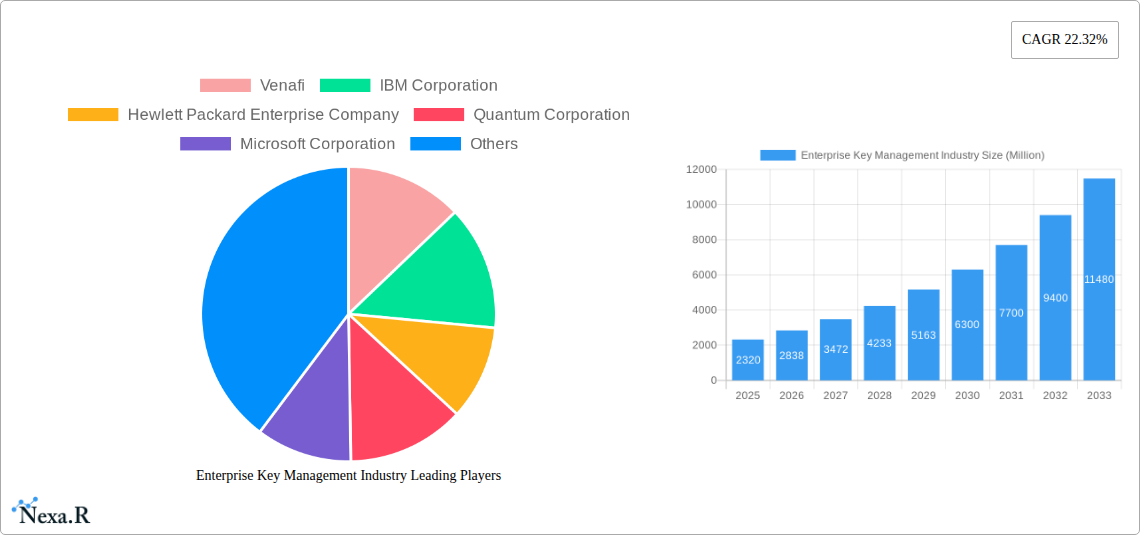
The Enterprise Key Management (EKM) market is experiencing robust growth, projected to reach \$2.32 billion in 2025 and exhibiting a Compound Annual Growth Rate (CAGR) of 22.32% from 2025 to 2033. This expansion is fueled by several key factors. The increasing adoption of cloud computing and the rising volume of sensitive data necessitate robust security measures, driving demand for EKM solutions. Furthermore, stringent data privacy regulations like GDPR and CCPA are compelling organizations across various sectors, including BFSI, healthcare, and government, to implement comprehensive key management strategies to mitigate compliance risks and protect against data breaches. The shift towards hybrid cloud environments is further contributing to market growth, as organizations seek seamless key management across diverse IT infrastructures. The market is segmented by deployment type (cloud, on-premises), enterprise size (SMEs, large enterprises), application (disk, file/folder, database, communication, cloud encryption), and end-user verticals. Cloud-based EKM solutions are gaining significant traction due to their scalability, cost-effectiveness, and ease of management. Large enterprises are currently the largest segment, but the SME sector is poised for substantial growth driven by increasing awareness of cybersecurity threats and the availability of affordable solutions.
The competitive landscape is characterized by a mix of established players like IBM, Microsoft, and Thales, alongside specialized EKM vendors such as Venafi and WinMagic. These companies are investing heavily in research and development to enhance their offerings with advanced features like automation, machine learning for threat detection, and enhanced integration with other security tools. While the market presents significant opportunities, certain challenges remain. Integration complexities with existing IT infrastructure and the need for skilled professionals to manage EKM systems can hinder adoption, particularly among SMEs. Moreover, the evolving threat landscape requires continuous innovation and adaptation from EKM vendors to stay ahead of sophisticated cyberattacks. Despite these challenges, the long-term outlook for the EKM market remains positive, driven by the imperative for robust data security and compliance in an increasingly digital world.
Enterprise Key Management Industry Market Report: 2019-2033
This comprehensive report provides an in-depth analysis of the Enterprise Key Management (EKM) industry, encompassing market dynamics, growth trends, regional dominance, product landscapes, and future outlook. With a study period spanning 2019-2033, a base year of 2025, and a forecast period of 2025-2033, this report is an invaluable resource for industry professionals, investors, and strategists seeking to navigate this rapidly evolving sector. The global EKM market size is projected to reach xx Million by 2033, exhibiting a CAGR of xx% during the forecast period.
Parent Market: Cybersecurity Child Market: Data Security
Enterprise Key Management Industry Market Dynamics & Structure
The Enterprise Key Management (EKM) market is characterized by a moderately concentrated landscape with several key players vying for market share. Technological innovation, particularly in cloud-based solutions and advancements in cryptography, is a significant driver. Stringent data privacy regulations like GDPR and CCPA are further fueling market growth, mandating robust key management practices. The market also faces competition from alternative security solutions, such as decentralized key management systems. End-user demographics are shifting towards larger enterprises adopting comprehensive EKM strategies, while smaller businesses are gradually increasing adoption due to rising cyber threats. M&A activity is relatively active, with larger players acquiring smaller firms to bolster their product portfolios and expand their market reach. The overall market exhibited xx Million in revenue in 2024.
- Market Concentration: Moderately concentrated, with top 5 players holding approximately xx% market share in 2024.
- Technological Innovation: Cloud-based EKM, quantum-resistant cryptography, and hardware security modules (HSMs) are key drivers.
- Regulatory Frameworks: GDPR, CCPA, and other data privacy regulations are driving demand for robust EKM solutions.
- Competitive Substitutes: Decentralized key management, traditional encryption methods.
- M&A Trends: xx M&A deals were recorded between 2019 and 2024, mostly involving smaller companies being acquired by larger players.
- Innovation Barriers: High initial investment costs, complexity of implementation, skilled workforce shortage.
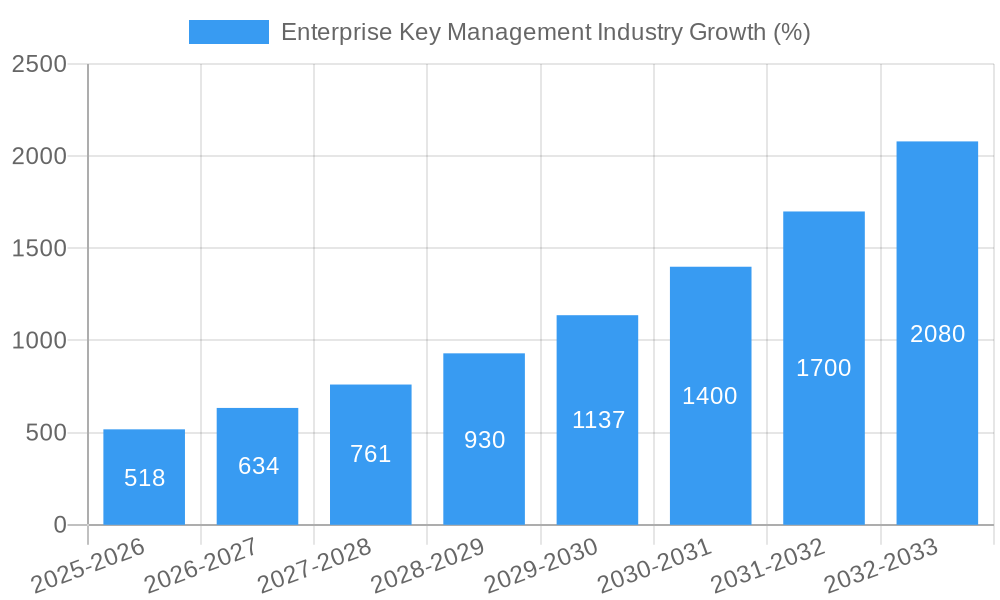
Enterprise Key Management Industry Growth Trends & Insights
The EKM market has witnessed significant growth over the past few years, fueled by the increasing adoption of cloud computing, the proliferation of IoT devices, and growing concerns over data breaches. The market size expanded from xx Million in 2019 to xx Million in 2024, demonstrating a robust growth trajectory. The adoption rate of EKM solutions is rising steadily, particularly among large enterprises, driven by the need to comply with stringent data privacy regulations. Technological disruptions, such as the rise of blockchain technology and quantum computing, are reshaping the landscape, creating both opportunities and challenges. Consumer behavior is shifting towards solutions offering enhanced security, ease of use, and seamless integration with existing IT infrastructures. The market is expected to witness an accelerated growth rate in the coming years.
- Market Size Evolution: From xx Million in 2019 to xx Million in 2024; projected to reach xx Million by 2033.
- CAGR (2019-2024): xx%
- Market Penetration: xx% in 2024, projected to reach xx% by 2033.
- Technological Disruptions: Cloud computing, blockchain, and quantum computing are significantly influencing market trends.
- Consumer Behavior Shifts: Increased demand for user-friendly, secure, and integrated solutions.
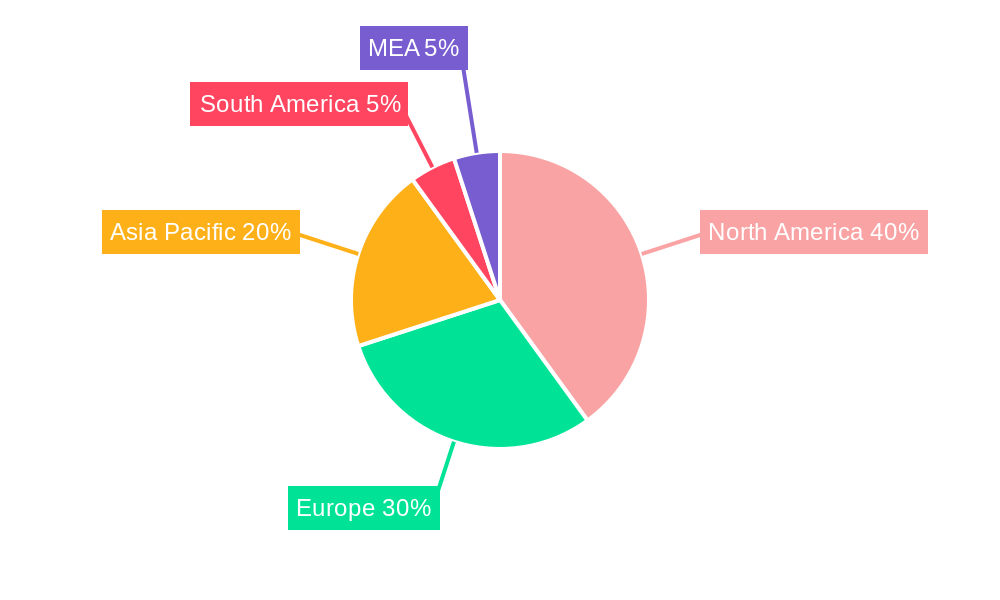
Dominant Regions, Countries, or Segments in Enterprise Key Management Industry
North America currently holds the largest market share in the EKM industry, driven by early adoption of cloud technologies and stringent data privacy regulations. However, the Asia-Pacific region is projected to experience the fastest growth rate due to increasing digitalization and rising cyber threats. Within segments, the Cloud deployment type dominates, reflecting the ongoing migration of enterprise workloads to the cloud. Large Enterprises are the primary adopters of EKM solutions, owing to their higher sensitivity to data breaches and significant data assets. Among applications, Disk Encryption and Database Encryption are leading the market, reflecting the criticality of protecting sensitive data residing on storage devices and databases. The BFSI and Government & Defense sectors represent significant end-user verticals, emphasizing the critical need for strong data security.
- Leading Region: North America
- Fastest-Growing Region: Asia-Pacific
- Dominant Deployment Type: Cloud
- Dominant Enterprise Size: Large Enterprises
- Leading Applications: Disk Encryption, Database Encryption
- Key End-user Verticals: BFSI, Government & Defense
Enterprise Key Management Industry Product Landscape
The EKM product landscape is characterized by a diverse range of solutions, encompassing hardware security modules (HSMs), cloud-based key management systems, and software-based key management tools. Key innovations include enhanced encryption algorithms, improved key lifecycle management features, and advanced auditing capabilities. Products are differentiated based on their security features, scalability, ease of integration, and compliance certifications. The emphasis is on offering solutions that are user-friendly, secure, and compatible with various operating systems and platforms.
Key Drivers, Barriers & Challenges in Enterprise Key Management Industry
Key Drivers:
- Increasing cyber threats and data breaches.
- Growing adoption of cloud computing and IoT.
- Stringent data privacy regulations.
- Rising awareness of data security risks among businesses.
Challenges and Restraints:
- High implementation costs for some solutions.
- Complexity of integrating EKM into existing IT infrastructure.
- Lack of skilled professionals to manage EKM systems.
- Potential for vendor lock-in with specific solutions. This contributes to an estimated xx Million loss in revenue annually.
Emerging Opportunities in Enterprise Key Management Industry
- Expansion into untapped markets, particularly in developing economies.
- Development of EKM solutions tailored to specific industry needs (e.g., healthcare, blockchain).
- Integration of AI and machine learning for improved threat detection and response.
- Development of quantum-resistant cryptographic algorithms.
Growth Accelerators in the Enterprise Key Management Industry Industry
Technological advancements, strategic partnerships among EKM providers and cloud platforms, and expansion into new geographic markets will be key drivers of long-term growth. Focus on user-friendly interfaces and simplified deployment models will enhance adoption rates. The increasing prevalence of hybrid cloud environments will also drive demand for flexible and scalable EKM solutions.
Key Players Shaping the Enterprise Key Management Industry Market
- Venafi
- IBM Corporation
- Hewlett Packard Enterprise Company
- Quantum Corporation
- Microsoft Corporation
- Amazon Web Services Inc
- Winmagic Inc
- Google Inc (Alphabet)
- Thales Group (Gemalto NV)
- Oracle Corporation
- Dell Technologies Inc
Notable Milestones in Enterprise Key Management Industry Sector
- September 2023: Thales launched Hold Your Own Key (HYOK) by CipherTrust Cloud Key Management in Oracle Cloud Infrastructure (OCI) across 45 Oracle Cloud Regions.
- May 2023: Cubist launched a service for institutional blockchain staking providers.
In-Depth Enterprise Key Management Industry Market Outlook
The future of the EKM market is bright, driven by the continued growth of cloud computing, IoT, and the increasing need for robust data protection. Strategic partnerships and technological innovations will further fuel market expansion. Companies that offer user-friendly, secure, and scalable solutions will be well-positioned to capture significant market share in the years to come. The market is poised for significant growth, with untapped opportunities in emerging markets and new applications, solidifying its position as a critical component of the overall cybersecurity landscape.
Enterprise Key Management Industry Segmentation
-
1. Deployment Type
- 1.1. Cloud
- 1.2. On-Premises
-
2. Application
- 2.1. Disk Encryption
- 2.2. File and Folder Encryption
- 2.3. Database Encryption
- 2.4. Communication Encryption
- 2.5. Cloud Encryption
-
3. End-user Verticals
- 3.1. BFSI
- 3.2. Healthcare
- 3.3. Government and Defense
- 3.4. IT and Telecom
- 3.5. Retail
- 3.6. Other End-user Verticals
Enterprise Key Management Industry Segmentation By Geography
- 1. North America
- 2. Europe
- 3. Asia
- 4. Australia and New Zealand
- 5. Latin America
- 6. Middle East and Africa
Enterprise Key Management Industry REPORT HIGHLIGHTS
| Aspects | Details |
|---|---|
| Study Period | 2019-2033 |
| Base Year | 2024 |
| Estimated Year | 2025 |
| Forecast Period | 2025-2033 |
| Historical Period | 2019-2024 |
| Growth Rate | CAGR of 22.32% from 2019-2033 |
| Segmentation |
|
Table of Contents
- 1. Introduction
- 1.1. Research Scope
- 1.2. Market Segmentation
- 1.3. Research Methodology
- 1.4. Definitions and Assumptions
- 2. Executive Summary
- 2.1. Introduction
- 3. Market Dynamics
- 3.1. Introduction
- 3.2. Market Drivers
- 3.2.1. Optimizing Overall Ownership Cost for Security While Maximizing Operational Efficiency and Security; Loss of High Profile Data and Compliance Issues; Massive Growth of Data Due to the Adoption of IoT and Cloud Technologies
- 3.3. Market Restrains
- 3.3.1. Lack of Awareness and Skilled Workforce
- 3.4. Market Trends
- 3.4.1. Cloud Segment to Witness Significant Growth
- 4. Market Factor Analysis
- 4.1. Porters Five Forces
- 4.2. Supply/Value Chain
- 4.3. PESTEL analysis
- 4.4. Market Entropy
- 4.5. Patent/Trademark Analysis
- 5. Global Enterprise Key Management Industry Analysis, Insights and Forecast, 2019-2031
- 5.1. Market Analysis, Insights and Forecast - by Deployment Type
- 5.1.1. Cloud
- 5.1.2. On-Premises
- 5.2. Market Analysis, Insights and Forecast - by Application
- 5.2.1. Disk Encryption
- 5.2.2. File and Folder Encryption
- 5.2.3. Database Encryption
- 5.2.4. Communication Encryption
- 5.2.5. Cloud Encryption
- 5.3. Market Analysis, Insights and Forecast - by End-user Verticals
- 5.3.1. BFSI
- 5.3.2. Healthcare
- 5.3.3. Government and Defense
- 5.3.4. IT and Telecom
- 5.3.5. Retail
- 5.3.6. Other End-user Verticals
- 5.4. Market Analysis, Insights and Forecast - by Region
- 5.4.1. North America
- 5.4.2. Europe
- 5.4.3. Asia
- 5.4.4. Australia and New Zealand
- 5.4.5. Latin America
- 5.4.6. Middle East and Africa
- 5.1. Market Analysis, Insights and Forecast - by Deployment Type
- 6. North America Enterprise Key Management Industry Analysis, Insights and Forecast, 2019-2031
- 6.1. Market Analysis, Insights and Forecast - by Deployment Type
- 6.1.1. Cloud
- 6.1.2. On-Premises
- 6.2. Market Analysis, Insights and Forecast - by Application
- 6.2.1. Disk Encryption
- 6.2.2. File and Folder Encryption
- 6.2.3. Database Encryption
- 6.2.4. Communication Encryption
- 6.2.5. Cloud Encryption
- 6.3. Market Analysis, Insights and Forecast - by End-user Verticals
- 6.3.1. BFSI
- 6.3.2. Healthcare
- 6.3.3. Government and Defense
- 6.3.4. IT and Telecom
- 6.3.5. Retail
- 6.3.6. Other End-user Verticals
- 6.1. Market Analysis, Insights and Forecast - by Deployment Type
- 7. Europe Enterprise Key Management Industry Analysis, Insights and Forecast, 2019-2031
- 7.1. Market Analysis, Insights and Forecast - by Deployment Type
- 7.1.1. Cloud
- 7.1.2. On-Premises
- 7.2. Market Analysis, Insights and Forecast - by Application
- 7.2.1. Disk Encryption
- 7.2.2. File and Folder Encryption
- 7.2.3. Database Encryption
- 7.2.4. Communication Encryption
- 7.2.5. Cloud Encryption
- 7.3. Market Analysis, Insights and Forecast - by End-user Verticals
- 7.3.1. BFSI
- 7.3.2. Healthcare
- 7.3.3. Government and Defense
- 7.3.4. IT and Telecom
- 7.3.5. Retail
- 7.3.6. Other End-user Verticals
- 7.1. Market Analysis, Insights and Forecast - by Deployment Type
- 8. Asia Enterprise Key Management Industry Analysis, Insights and Forecast, 2019-2031
- 8.1. Market Analysis, Insights and Forecast - by Deployment Type
- 8.1.1. Cloud
- 8.1.2. On-Premises
- 8.2. Market Analysis, Insights and Forecast - by Application
- 8.2.1. Disk Encryption
- 8.2.2. File and Folder Encryption
- 8.2.3. Database Encryption
- 8.2.4. Communication Encryption
- 8.2.5. Cloud Encryption
- 8.3. Market Analysis, Insights and Forecast - by End-user Verticals
- 8.3.1. BFSI
- 8.3.2. Healthcare
- 8.3.3. Government and Defense
- 8.3.4. IT and Telecom
- 8.3.5. Retail
- 8.3.6. Other End-user Verticals
- 8.1. Market Analysis, Insights and Forecast - by Deployment Type
- 9. Australia and New Zealand Enterprise Key Management Industry Analysis, Insights and Forecast, 2019-2031
- 9.1. Market Analysis, Insights and Forecast - by Deployment Type
- 9.1.1. Cloud
- 9.1.2. On-Premises
- 9.2. Market Analysis, Insights and Forecast - by Application
- 9.2.1. Disk Encryption
- 9.2.2. File and Folder Encryption
- 9.2.3. Database Encryption
- 9.2.4. Communication Encryption
- 9.2.5. Cloud Encryption
- 9.3. Market Analysis, Insights and Forecast - by End-user Verticals
- 9.3.1. BFSI
- 9.3.2. Healthcare
- 9.3.3. Government and Defense
- 9.3.4. IT and Telecom
- 9.3.5. Retail
- 9.3.6. Other End-user Verticals
- 9.1. Market Analysis, Insights and Forecast - by Deployment Type
- 10. Latin America Enterprise Key Management Industry Analysis, Insights and Forecast, 2019-2031
- 10.1. Market Analysis, Insights and Forecast - by Deployment Type
- 10.1.1. Cloud
- 10.1.2. On-Premises
- 10.2. Market Analysis, Insights and Forecast - by Application
- 10.2.1. Disk Encryption
- 10.2.2. File and Folder Encryption
- 10.2.3. Database Encryption
- 10.2.4. Communication Encryption
- 10.2.5. Cloud Encryption
- 10.3. Market Analysis, Insights and Forecast - by End-user Verticals
- 10.3.1. BFSI
- 10.3.2. Healthcare
- 10.3.3. Government and Defense
- 10.3.4. IT and Telecom
- 10.3.5. Retail
- 10.3.6. Other End-user Verticals
- 10.1. Market Analysis, Insights and Forecast - by Deployment Type
- 11. Middle East and Africa Enterprise Key Management Industry Analysis, Insights and Forecast, 2019-2031
- 11.1. Market Analysis, Insights and Forecast - by Deployment Type
- 11.1.1. Cloud
- 11.1.2. On-Premises
- 11.2. Market Analysis, Insights and Forecast - by Application
- 11.2.1. Disk Encryption
- 11.2.2. File and Folder Encryption
- 11.2.3. Database Encryption
- 11.2.4. Communication Encryption
- 11.2.5. Cloud Encryption
- 11.3. Market Analysis, Insights and Forecast - by End-user Verticals
- 11.3.1. BFSI
- 11.3.2. Healthcare
- 11.3.3. Government and Defense
- 11.3.4. IT and Telecom
- 11.3.5. Retail
- 11.3.6. Other End-user Verticals
- 11.1. Market Analysis, Insights and Forecast - by Deployment Type
- 12. North America Enterprise Key Management Industry Analysis, Insights and Forecast, 2019-2031
- 12.1. Market Analysis, Insights and Forecast - By Country/Sub-region
- 12.1.1 United States
- 12.1.2 Canada
- 12.1.3 Mexico
- 13. Europe Enterprise Key Management Industry Analysis, Insights and Forecast, 2019-2031
- 13.1. Market Analysis, Insights and Forecast - By Country/Sub-region
- 13.1.1 Germany
- 13.1.2 United Kingdom
- 13.1.3 France
- 13.1.4 Spain
- 13.1.5 Italy
- 13.1.6 Spain
- 13.1.7 Belgium
- 13.1.8 Netherland
- 13.1.9 Nordics
- 13.1.10 Rest of Europe
- 14. Asia Pacific Enterprise Key Management Industry Analysis, Insights and Forecast, 2019-2031
- 14.1. Market Analysis, Insights and Forecast - By Country/Sub-region
- 14.1.1 China
- 14.1.2 Japan
- 14.1.3 India
- 14.1.4 South Korea
- 14.1.5 Southeast Asia
- 14.1.6 Australia
- 14.1.7 Indonesia
- 14.1.8 Phillipes
- 14.1.9 Singapore
- 14.1.10 Thailandc
- 14.1.11 Rest of Asia Pacific
- 15. South America Enterprise Key Management Industry Analysis, Insights and Forecast, 2019-2031
- 15.1. Market Analysis, Insights and Forecast - By Country/Sub-region
- 15.1.1 Brazil
- 15.1.2 Argentina
- 15.1.3 Peru
- 15.1.4 Chile
- 15.1.5 Colombia
- 15.1.6 Ecuador
- 15.1.7 Venezuela
- 15.1.8 Rest of South America
- 16. North America Enterprise Key Management Industry Analysis, Insights and Forecast, 2019-2031
- 16.1. Market Analysis, Insights and Forecast - By Country/Sub-region
- 16.1.1 United States
- 16.1.2 Canada
- 16.1.3 Mexico
- 17. MEA Enterprise Key Management Industry Analysis, Insights and Forecast, 2019-2031
- 17.1. Market Analysis, Insights and Forecast - By Country/Sub-region
- 17.1.1 United Arab Emirates
- 17.1.2 Saudi Arabia
- 17.1.3 South Africa
- 17.1.4 Rest of Middle East and Africa
- 18. Competitive Analysis
- 18.1. Global Market Share Analysis 2024
- 18.2. Company Profiles
- 18.2.1 Venafi
- 18.2.1.1. Overview
- 18.2.1.2. Products
- 18.2.1.3. SWOT Analysis
- 18.2.1.4. Recent Developments
- 18.2.1.5. Financials (Based on Availability)
- 18.2.2 IBM Corporation
- 18.2.2.1. Overview
- 18.2.2.2. Products
- 18.2.2.3. SWOT Analysis
- 18.2.2.4. Recent Developments
- 18.2.2.5. Financials (Based on Availability)
- 18.2.3 Hewlett Packard Enterprise Company
- 18.2.3.1. Overview
- 18.2.3.2. Products
- 18.2.3.3. SWOT Analysis
- 18.2.3.4. Recent Developments
- 18.2.3.5. Financials (Based on Availability)
- 18.2.4 Quantum Corporation
- 18.2.4.1. Overview
- 18.2.4.2. Products
- 18.2.4.3. SWOT Analysis
- 18.2.4.4. Recent Developments
- 18.2.4.5. Financials (Based on Availability)
- 18.2.5 Microsoft Corporation
- 18.2.5.1. Overview
- 18.2.5.2. Products
- 18.2.5.3. SWOT Analysis
- 18.2.5.4. Recent Developments
- 18.2.5.5. Financials (Based on Availability)
- 18.2.6 Amazon Web Services Inc
- 18.2.6.1. Overview
- 18.2.6.2. Products
- 18.2.6.3. SWOT Analysis
- 18.2.6.4. Recent Developments
- 18.2.6.5. Financials (Based on Availability)
- 18.2.7 Winmagic Inc
- 18.2.7.1. Overview
- 18.2.7.2. Products
- 18.2.7.3. SWOT Analysis
- 18.2.7.4. Recent Developments
- 18.2.7.5. Financials (Based on Availability)
- 18.2.8 Google Inc (Alphabet)
- 18.2.8.1. Overview
- 18.2.8.2. Products
- 18.2.8.3. SWOT Analysis
- 18.2.8.4. Recent Developments
- 18.2.8.5. Financials (Based on Availability)
- 18.2.9 Thales Group (Gemalto NV)
- 18.2.9.1. Overview
- 18.2.9.2. Products
- 18.2.9.3. SWOT Analysis
- 18.2.9.4. Recent Developments
- 18.2.9.5. Financials (Based on Availability)
- 18.2.10 Oracle Corporation
- 18.2.10.1. Overview
- 18.2.10.2. Products
- 18.2.10.3. SWOT Analysis
- 18.2.10.4. Recent Developments
- 18.2.10.5. Financials (Based on Availability)
- 18.2.11 Dell Technologies Inc
- 18.2.11.1. Overview
- 18.2.11.2. Products
- 18.2.11.3. SWOT Analysis
- 18.2.11.4. Recent Developments
- 18.2.11.5. Financials (Based on Availability)
- 18.2.1 Venafi
List of Figures
- Figure 1: Global Enterprise Key Management Industry Revenue Breakdown (Million, %) by Region 2024 & 2032
- Figure 2: Global Enterprise Key Management Industry Volume Breakdown (K Unit, %) by Region 2024 & 2032
- Figure 3: North America Enterprise Key Management Industry Revenue (Million), by Country 2024 & 2032
- Figure 4: North America Enterprise Key Management Industry Volume (K Unit), by Country 2024 & 2032
- Figure 5: North America Enterprise Key Management Industry Revenue Share (%), by Country 2024 & 2032
- Figure 6: North America Enterprise Key Management Industry Volume Share (%), by Country 2024 & 2032
- Figure 7: Europe Enterprise Key Management Industry Revenue (Million), by Country 2024 & 2032
- Figure 8: Europe Enterprise Key Management Industry Volume (K Unit), by Country 2024 & 2032
- Figure 9: Europe Enterprise Key Management Industry Revenue Share (%), by Country 2024 & 2032
- Figure 10: Europe Enterprise Key Management Industry Volume Share (%), by Country 2024 & 2032
- Figure 11: Asia Pacific Enterprise Key Management Industry Revenue (Million), by Country 2024 & 2032
- Figure 12: Asia Pacific Enterprise Key Management Industry Volume (K Unit), by Country 2024 & 2032
- Figure 13: Asia Pacific Enterprise Key Management Industry Revenue Share (%), by Country 2024 & 2032
- Figure 14: Asia Pacific Enterprise Key Management Industry Volume Share (%), by Country 2024 & 2032
- Figure 15: South America Enterprise Key Management Industry Revenue (Million), by Country 2024 & 2032
- Figure 16: South America Enterprise Key Management Industry Volume (K Unit), by Country 2024 & 2032
- Figure 17: South America Enterprise Key Management Industry Revenue Share (%), by Country 2024 & 2032
- Figure 18: South America Enterprise Key Management Industry Volume Share (%), by Country 2024 & 2032
- Figure 19: North America Enterprise Key Management Industry Revenue (Million), by Country 2024 & 2032
- Figure 20: North America Enterprise Key Management Industry Volume (K Unit), by Country 2024 & 2032
- Figure 21: North America Enterprise Key Management Industry Revenue Share (%), by Country 2024 & 2032
- Figure 22: North America Enterprise Key Management Industry Volume Share (%), by Country 2024 & 2032
- Figure 23: MEA Enterprise Key Management Industry Revenue (Million), by Country 2024 & 2032
- Figure 24: MEA Enterprise Key Management Industry Volume (K Unit), by Country 2024 & 2032
- Figure 25: MEA Enterprise Key Management Industry Revenue Share (%), by Country 2024 & 2032
- Figure 26: MEA Enterprise Key Management Industry Volume Share (%), by Country 2024 & 2032
- Figure 27: North America Enterprise Key Management Industry Revenue (Million), by Deployment Type 2024 & 2032
- Figure 28: North America Enterprise Key Management Industry Volume (K Unit), by Deployment Type 2024 & 2032
- Figure 29: North America Enterprise Key Management Industry Revenue Share (%), by Deployment Type 2024 & 2032
- Figure 30: North America Enterprise Key Management Industry Volume Share (%), by Deployment Type 2024 & 2032
- Figure 31: North America Enterprise Key Management Industry Revenue (Million), by Application 2024 & 2032
- Figure 32: North America Enterprise Key Management Industry Volume (K Unit), by Application 2024 & 2032
- Figure 33: North America Enterprise Key Management Industry Revenue Share (%), by Application 2024 & 2032
- Figure 34: North America Enterprise Key Management Industry Volume Share (%), by Application 2024 & 2032
- Figure 35: North America Enterprise Key Management Industry Revenue (Million), by End-user Verticals 2024 & 2032
- Figure 36: North America Enterprise Key Management Industry Volume (K Unit), by End-user Verticals 2024 & 2032
- Figure 37: North America Enterprise Key Management Industry Revenue Share (%), by End-user Verticals 2024 & 2032
- Figure 38: North America Enterprise Key Management Industry Volume Share (%), by End-user Verticals 2024 & 2032
- Figure 39: North America Enterprise Key Management Industry Revenue (Million), by Country 2024 & 2032
- Figure 40: North America Enterprise Key Management Industry Volume (K Unit), by Country 2024 & 2032
- Figure 41: North America Enterprise Key Management Industry Revenue Share (%), by Country 2024 & 2032
- Figure 42: North America Enterprise Key Management Industry Volume Share (%), by Country 2024 & 2032
- Figure 43: Europe Enterprise Key Management Industry Revenue (Million), by Deployment Type 2024 & 2032
- Figure 44: Europe Enterprise Key Management Industry Volume (K Unit), by Deployment Type 2024 & 2032
- Figure 45: Europe Enterprise Key Management Industry Revenue Share (%), by Deployment Type 2024 & 2032
- Figure 46: Europe Enterprise Key Management Industry Volume Share (%), by Deployment Type 2024 & 2032
- Figure 47: Europe Enterprise Key Management Industry Revenue (Million), by Application 2024 & 2032
- Figure 48: Europe Enterprise Key Management Industry Volume (K Unit), by Application 2024 & 2032
- Figure 49: Europe Enterprise Key Management Industry Revenue Share (%), by Application 2024 & 2032
- Figure 50: Europe Enterprise Key Management Industry Volume Share (%), by Application 2024 & 2032
- Figure 51: Europe Enterprise Key Management Industry Revenue (Million), by End-user Verticals 2024 & 2032
- Figure 52: Europe Enterprise Key Management Industry Volume (K Unit), by End-user Verticals 2024 & 2032
- Figure 53: Europe Enterprise Key Management Industry Revenue Share (%), by End-user Verticals 2024 & 2032
- Figure 54: Europe Enterprise Key Management Industry Volume Share (%), by End-user Verticals 2024 & 2032
- Figure 55: Europe Enterprise Key Management Industry Revenue (Million), by Country 2024 & 2032
- Figure 56: Europe Enterprise Key Management Industry Volume (K Unit), by Country 2024 & 2032
- Figure 57: Europe Enterprise Key Management Industry Revenue Share (%), by Country 2024 & 2032
- Figure 58: Europe Enterprise Key Management Industry Volume Share (%), by Country 2024 & 2032
- Figure 59: Asia Enterprise Key Management Industry Revenue (Million), by Deployment Type 2024 & 2032
- Figure 60: Asia Enterprise Key Management Industry Volume (K Unit), by Deployment Type 2024 & 2032
- Figure 61: Asia Enterprise Key Management Industry Revenue Share (%), by Deployment Type 2024 & 2032
- Figure 62: Asia Enterprise Key Management Industry Volume Share (%), by Deployment Type 2024 & 2032
- Figure 63: Asia Enterprise Key Management Industry Revenue (Million), by Application 2024 & 2032
- Figure 64: Asia Enterprise Key Management Industry Volume (K Unit), by Application 2024 & 2032
- Figure 65: Asia Enterprise Key Management Industry Revenue Share (%), by Application 2024 & 2032
- Figure 66: Asia Enterprise Key Management Industry Volume Share (%), by Application 2024 & 2032
- Figure 67: Asia Enterprise Key Management Industry Revenue (Million), by End-user Verticals 2024 & 2032
- Figure 68: Asia Enterprise Key Management Industry Volume (K Unit), by End-user Verticals 2024 & 2032
- Figure 69: Asia Enterprise Key Management Industry Revenue Share (%), by End-user Verticals 2024 & 2032
- Figure 70: Asia Enterprise Key Management Industry Volume Share (%), by End-user Verticals 2024 & 2032
- Figure 71: Asia Enterprise Key Management Industry Revenue (Million), by Country 2024 & 2032
- Figure 72: Asia Enterprise Key Management Industry Volume (K Unit), by Country 2024 & 2032
- Figure 73: Asia Enterprise Key Management Industry Revenue Share (%), by Country 2024 & 2032
- Figure 74: Asia Enterprise Key Management Industry Volume Share (%), by Country 2024 & 2032
- Figure 75: Australia and New Zealand Enterprise Key Management Industry Revenue (Million), by Deployment Type 2024 & 2032
- Figure 76: Australia and New Zealand Enterprise Key Management Industry Volume (K Unit), by Deployment Type 2024 & 2032
- Figure 77: Australia and New Zealand Enterprise Key Management Industry Revenue Share (%), by Deployment Type 2024 & 2032
- Figure 78: Australia and New Zealand Enterprise Key Management Industry Volume Share (%), by Deployment Type 2024 & 2032
- Figure 79: Australia and New Zealand Enterprise Key Management Industry Revenue (Million), by Application 2024 & 2032
- Figure 80: Australia and New Zealand Enterprise Key Management Industry Volume (K Unit), by Application 2024 & 2032
- Figure 81: Australia and New Zealand Enterprise Key Management Industry Revenue Share (%), by Application 2024 & 2032
- Figure 82: Australia and New Zealand Enterprise Key Management Industry Volume Share (%), by Application 2024 & 2032
- Figure 83: Australia and New Zealand Enterprise Key Management Industry Revenue (Million), by End-user Verticals 2024 & 2032
- Figure 84: Australia and New Zealand Enterprise Key Management Industry Volume (K Unit), by End-user Verticals 2024 & 2032
- Figure 85: Australia and New Zealand Enterprise Key Management Industry Revenue Share (%), by End-user Verticals 2024 & 2032
- Figure 86: Australia and New Zealand Enterprise Key Management Industry Volume Share (%), by End-user Verticals 2024 & 2032
- Figure 87: Australia and New Zealand Enterprise Key Management Industry Revenue (Million), by Country 2024 & 2032
- Figure 88: Australia and New Zealand Enterprise Key Management Industry Volume (K Unit), by Country 2024 & 2032
- Figure 89: Australia and New Zealand Enterprise Key Management Industry Revenue Share (%), by Country 2024 & 2032
- Figure 90: Australia and New Zealand Enterprise Key Management Industry Volume Share (%), by Country 2024 & 2032
- Figure 91: Latin America Enterprise Key Management Industry Revenue (Million), by Deployment Type 2024 & 2032
- Figure 92: Latin America Enterprise Key Management Industry Volume (K Unit), by Deployment Type 2024 & 2032
- Figure 93: Latin America Enterprise Key Management Industry Revenue Share (%), by Deployment Type 2024 & 2032
- Figure 94: Latin America Enterprise Key Management Industry Volume Share (%), by Deployment Type 2024 & 2032
- Figure 95: Latin America Enterprise Key Management Industry Revenue (Million), by Application 2024 & 2032
- Figure 96: Latin America Enterprise Key Management Industry Volume (K Unit), by Application 2024 & 2032
- Figure 97: Latin America Enterprise Key Management Industry Revenue Share (%), by Application 2024 & 2032
- Figure 98: Latin America Enterprise Key Management Industry Volume Share (%), by Application 2024 & 2032
- Figure 99: Latin America Enterprise Key Management Industry Revenue (Million), by End-user Verticals 2024 & 2032
- Figure 100: Latin America Enterprise Key Management Industry Volume (K Unit), by End-user Verticals 2024 & 2032
- Figure 101: Latin America Enterprise Key Management Industry Revenue Share (%), by End-user Verticals 2024 & 2032
- Figure 102: Latin America Enterprise Key Management Industry Volume Share (%), by End-user Verticals 2024 & 2032
- Figure 103: Latin America Enterprise Key Management Industry Revenue (Million), by Country 2024 & 2032
- Figure 104: Latin America Enterprise Key Management Industry Volume (K Unit), by Country 2024 & 2032
- Figure 105: Latin America Enterprise Key Management Industry Revenue Share (%), by Country 2024 & 2032
- Figure 106: Latin America Enterprise Key Management Industry Volume Share (%), by Country 2024 & 2032
- Figure 107: Middle East and Africa Enterprise Key Management Industry Revenue (Million), by Deployment Type 2024 & 2032
- Figure 108: Middle East and Africa Enterprise Key Management Industry Volume (K Unit), by Deployment Type 2024 & 2032
- Figure 109: Middle East and Africa Enterprise Key Management Industry Revenue Share (%), by Deployment Type 2024 & 2032
- Figure 110: Middle East and Africa Enterprise Key Management Industry Volume Share (%), by Deployment Type 2024 & 2032
- Figure 111: Middle East and Africa Enterprise Key Management Industry Revenue (Million), by Application 2024 & 2032
- Figure 112: Middle East and Africa Enterprise Key Management Industry Volume (K Unit), by Application 2024 & 2032
- Figure 113: Middle East and Africa Enterprise Key Management Industry Revenue Share (%), by Application 2024 & 2032
- Figure 114: Middle East and Africa Enterprise Key Management Industry Volume Share (%), by Application 2024 & 2032
- Figure 115: Middle East and Africa Enterprise Key Management Industry Revenue (Million), by End-user Verticals 2024 & 2032
- Figure 116: Middle East and Africa Enterprise Key Management Industry Volume (K Unit), by End-user Verticals 2024 & 2032
- Figure 117: Middle East and Africa Enterprise Key Management Industry Revenue Share (%), by End-user Verticals 2024 & 2032
- Figure 118: Middle East and Africa Enterprise Key Management Industry Volume Share (%), by End-user Verticals 2024 & 2032
- Figure 119: Middle East and Africa Enterprise Key Management Industry Revenue (Million), by Country 2024 & 2032
- Figure 120: Middle East and Africa Enterprise Key Management Industry Volume (K Unit), by Country 2024 & 2032
- Figure 121: Middle East and Africa Enterprise Key Management Industry Revenue Share (%), by Country 2024 & 2032
- Figure 122: Middle East and Africa Enterprise Key Management Industry Volume Share (%), by Country 2024 & 2032
List of Tables
- Table 1: Global Enterprise Key Management Industry Revenue Million Forecast, by Region 2019 & 2032
- Table 2: Global Enterprise Key Management Industry Volume K Unit Forecast, by Region 2019 & 2032
- Table 3: Global Enterprise Key Management Industry Revenue Million Forecast, by Deployment Type 2019 & 2032
- Table 4: Global Enterprise Key Management Industry Volume K Unit Forecast, by Deployment Type 2019 & 2032
- Table 5: Global Enterprise Key Management Industry Revenue Million Forecast, by Application 2019 & 2032
- Table 6: Global Enterprise Key Management Industry Volume K Unit Forecast, by Application 2019 & 2032
- Table 7: Global Enterprise Key Management Industry Revenue Million Forecast, by End-user Verticals 2019 & 2032
- Table 8: Global Enterprise Key Management Industry Volume K Unit Forecast, by End-user Verticals 2019 & 2032
- Table 9: Global Enterprise Key Management Industry Revenue Million Forecast, by Region 2019 & 2032
- Table 10: Global Enterprise Key Management Industry Volume K Unit Forecast, by Region 2019 & 2032
- Table 11: Global Enterprise Key Management Industry Revenue Million Forecast, by Country 2019 & 2032
- Table 12: Global Enterprise Key Management Industry Volume K Unit Forecast, by Country 2019 & 2032
- Table 13: United States Enterprise Key Management Industry Revenue (Million) Forecast, by Application 2019 & 2032
- Table 14: United States Enterprise Key Management Industry Volume (K Unit) Forecast, by Application 2019 & 2032
- Table 15: Canada Enterprise Key Management Industry Revenue (Million) Forecast, by Application 2019 & 2032
- Table 16: Canada Enterprise Key Management Industry Volume (K Unit) Forecast, by Application 2019 & 2032
- Table 17: Mexico Enterprise Key Management Industry Revenue (Million) Forecast, by Application 2019 & 2032
- Table 18: Mexico Enterprise Key Management Industry Volume (K Unit) Forecast, by Application 2019 & 2032
- Table 19: Global Enterprise Key Management Industry Revenue Million Forecast, by Country 2019 & 2032
- Table 20: Global Enterprise Key Management Industry Volume K Unit Forecast, by Country 2019 & 2032
- Table 21: Germany Enterprise Key Management Industry Revenue (Million) Forecast, by Application 2019 & 2032
- Table 22: Germany Enterprise Key Management Industry Volume (K Unit) Forecast, by Application 2019 & 2032
- Table 23: United Kingdom Enterprise Key Management Industry Revenue (Million) Forecast, by Application 2019 & 2032
- Table 24: United Kingdom Enterprise Key Management Industry Volume (K Unit) Forecast, by Application 2019 & 2032
- Table 25: France Enterprise Key Management Industry Revenue (Million) Forecast, by Application 2019 & 2032
- Table 26: France Enterprise Key Management Industry Volume (K Unit) Forecast, by Application 2019 & 2032
- Table 27: Spain Enterprise Key Management Industry Revenue (Million) Forecast, by Application 2019 & 2032
- Table 28: Spain Enterprise Key Management Industry Volume (K Unit) Forecast, by Application 2019 & 2032
- Table 29: Italy Enterprise Key Management Industry Revenue (Million) Forecast, by Application 2019 & 2032
- Table 30: Italy Enterprise Key Management Industry Volume (K Unit) Forecast, by Application 2019 & 2032
- Table 31: Spain Enterprise Key Management Industry Revenue (Million) Forecast, by Application 2019 & 2032
- Table 32: Spain Enterprise Key Management Industry Volume (K Unit) Forecast, by Application 2019 & 2032
- Table 33: Belgium Enterprise Key Management Industry Revenue (Million) Forecast, by Application 2019 & 2032
- Table 34: Belgium Enterprise Key Management Industry Volume (K Unit) Forecast, by Application 2019 & 2032
- Table 35: Netherland Enterprise Key Management Industry Revenue (Million) Forecast, by Application 2019 & 2032
- Table 36: Netherland Enterprise Key Management Industry Volume (K Unit) Forecast, by Application 2019 & 2032
- Table 37: Nordics Enterprise Key Management Industry Revenue (Million) Forecast, by Application 2019 & 2032
- Table 38: Nordics Enterprise Key Management Industry Volume (K Unit) Forecast, by Application 2019 & 2032
- Table 39: Rest of Europe Enterprise Key Management Industry Revenue (Million) Forecast, by Application 2019 & 2032
- Table 40: Rest of Europe Enterprise Key Management Industry Volume (K Unit) Forecast, by Application 2019 & 2032
- Table 41: Global Enterprise Key Management Industry Revenue Million Forecast, by Country 2019 & 2032
- Table 42: Global Enterprise Key Management Industry Volume K Unit Forecast, by Country 2019 & 2032
- Table 43: China Enterprise Key Management Industry Revenue (Million) Forecast, by Application 2019 & 2032
- Table 44: China Enterprise Key Management Industry Volume (K Unit) Forecast, by Application 2019 & 2032
- Table 45: Japan Enterprise Key Management Industry Revenue (Million) Forecast, by Application 2019 & 2032
- Table 46: Japan Enterprise Key Management Industry Volume (K Unit) Forecast, by Application 2019 & 2032
- Table 47: India Enterprise Key Management Industry Revenue (Million) Forecast, by Application 2019 & 2032
- Table 48: India Enterprise Key Management Industry Volume (K Unit) Forecast, by Application 2019 & 2032
- Table 49: South Korea Enterprise Key Management Industry Revenue (Million) Forecast, by Application 2019 & 2032
- Table 50: South Korea Enterprise Key Management Industry Volume (K Unit) Forecast, by Application 2019 & 2032
- Table 51: Southeast Asia Enterprise Key Management Industry Revenue (Million) Forecast, by Application 2019 & 2032
- Table 52: Southeast Asia Enterprise Key Management Industry Volume (K Unit) Forecast, by Application 2019 & 2032
- Table 53: Australia Enterprise Key Management Industry Revenue (Million) Forecast, by Application 2019 & 2032
- Table 54: Australia Enterprise Key Management Industry Volume (K Unit) Forecast, by Application 2019 & 2032
- Table 55: Indonesia Enterprise Key Management Industry Revenue (Million) Forecast, by Application 2019 & 2032
- Table 56: Indonesia Enterprise Key Management Industry Volume (K Unit) Forecast, by Application 2019 & 2032
- Table 57: Phillipes Enterprise Key Management Industry Revenue (Million) Forecast, by Application 2019 & 2032
- Table 58: Phillipes Enterprise Key Management Industry Volume (K Unit) Forecast, by Application 2019 & 2032
- Table 59: Singapore Enterprise Key Management Industry Revenue (Million) Forecast, by Application 2019 & 2032
- Table 60: Singapore Enterprise Key Management Industry Volume (K Unit) Forecast, by Application 2019 & 2032
- Table 61: Thailandc Enterprise Key Management Industry Revenue (Million) Forecast, by Application 2019 & 2032
- Table 62: Thailandc Enterprise Key Management Industry Volume (K Unit) Forecast, by Application 2019 & 2032
- Table 63: Rest of Asia Pacific Enterprise Key Management Industry Revenue (Million) Forecast, by Application 2019 & 2032
- Table 64: Rest of Asia Pacific Enterprise Key Management Industry Volume (K Unit) Forecast, by Application 2019 & 2032
- Table 65: Global Enterprise Key Management Industry Revenue Million Forecast, by Country 2019 & 2032
- Table 66: Global Enterprise Key Management Industry Volume K Unit Forecast, by Country 2019 & 2032
- Table 67: Brazil Enterprise Key Management Industry Revenue (Million) Forecast, by Application 2019 & 2032
- Table 68: Brazil Enterprise Key Management Industry Volume (K Unit) Forecast, by Application 2019 & 2032
- Table 69: Argentina Enterprise Key Management Industry Revenue (Million) Forecast, by Application 2019 & 2032
- Table 70: Argentina Enterprise Key Management Industry Volume (K Unit) Forecast, by Application 2019 & 2032
- Table 71: Peru Enterprise Key Management Industry Revenue (Million) Forecast, by Application 2019 & 2032
- Table 72: Peru Enterprise Key Management Industry Volume (K Unit) Forecast, by Application 2019 & 2032
- Table 73: Chile Enterprise Key Management Industry Revenue (Million) Forecast, by Application 2019 & 2032
- Table 74: Chile Enterprise Key Management Industry Volume (K Unit) Forecast, by Application 2019 & 2032
- Table 75: Colombia Enterprise Key Management Industry Revenue (Million) Forecast, by Application 2019 & 2032
- Table 76: Colombia Enterprise Key Management Industry Volume (K Unit) Forecast, by Application 2019 & 2032
- Table 77: Ecuador Enterprise Key Management Industry Revenue (Million) Forecast, by Application 2019 & 2032
- Table 78: Ecuador Enterprise Key Management Industry Volume (K Unit) Forecast, by Application 2019 & 2032
- Table 79: Venezuela Enterprise Key Management Industry Revenue (Million) Forecast, by Application 2019 & 2032
- Table 80: Venezuela Enterprise Key Management Industry Volume (K Unit) Forecast, by Application 2019 & 2032
- Table 81: Rest of South America Enterprise Key Management Industry Revenue (Million) Forecast, by Application 2019 & 2032
- Table 82: Rest of South America Enterprise Key Management Industry Volume (K Unit) Forecast, by Application 2019 & 2032
- Table 83: Global Enterprise Key Management Industry Revenue Million Forecast, by Country 2019 & 2032
- Table 84: Global Enterprise Key Management Industry Volume K Unit Forecast, by Country 2019 & 2032
- Table 85: United States Enterprise Key Management Industry Revenue (Million) Forecast, by Application 2019 & 2032
- Table 86: United States Enterprise Key Management Industry Volume (K Unit) Forecast, by Application 2019 & 2032
- Table 87: Canada Enterprise Key Management Industry Revenue (Million) Forecast, by Application 2019 & 2032
- Table 88: Canada Enterprise Key Management Industry Volume (K Unit) Forecast, by Application 2019 & 2032
- Table 89: Mexico Enterprise Key Management Industry Revenue (Million) Forecast, by Application 2019 & 2032
- Table 90: Mexico Enterprise Key Management Industry Volume (K Unit) Forecast, by Application 2019 & 2032
- Table 91: Global Enterprise Key Management Industry Revenue Million Forecast, by Country 2019 & 2032
- Table 92: Global Enterprise Key Management Industry Volume K Unit Forecast, by Country 2019 & 2032
- Table 93: United Arab Emirates Enterprise Key Management Industry Revenue (Million) Forecast, by Application 2019 & 2032
- Table 94: United Arab Emirates Enterprise Key Management Industry Volume (K Unit) Forecast, by Application 2019 & 2032
- Table 95: Saudi Arabia Enterprise Key Management Industry Revenue (Million) Forecast, by Application 2019 & 2032
- Table 96: Saudi Arabia Enterprise Key Management Industry Volume (K Unit) Forecast, by Application 2019 & 2032
- Table 97: South Africa Enterprise Key Management Industry Revenue (Million) Forecast, by Application 2019 & 2032
- Table 98: South Africa Enterprise Key Management Industry Volume (K Unit) Forecast, by Application 2019 & 2032
- Table 99: Rest of Middle East and Africa Enterprise Key Management Industry Revenue (Million) Forecast, by Application 2019 & 2032
- Table 100: Rest of Middle East and Africa Enterprise Key Management Industry Volume (K Unit) Forecast, by Application 2019 & 2032
- Table 101: Global Enterprise Key Management Industry Revenue Million Forecast, by Deployment Type 2019 & 2032
- Table 102: Global Enterprise Key Management Industry Volume K Unit Forecast, by Deployment Type 2019 & 2032
- Table 103: Global Enterprise Key Management Industry Revenue Million Forecast, by Application 2019 & 2032
- Table 104: Global Enterprise Key Management Industry Volume K Unit Forecast, by Application 2019 & 2032
- Table 105: Global Enterprise Key Management Industry Revenue Million Forecast, by End-user Verticals 2019 & 2032
- Table 106: Global Enterprise Key Management Industry Volume K Unit Forecast, by End-user Verticals 2019 & 2032
- Table 107: Global Enterprise Key Management Industry Revenue Million Forecast, by Country 2019 & 2032
- Table 108: Global Enterprise Key Management Industry Volume K Unit Forecast, by Country 2019 & 2032
- Table 109: Global Enterprise Key Management Industry Revenue Million Forecast, by Deployment Type 2019 & 2032
- Table 110: Global Enterprise Key Management Industry Volume K Unit Forecast, by Deployment Type 2019 & 2032
- Table 111: Global Enterprise Key Management Industry Revenue Million Forecast, by Application 2019 & 2032
- Table 112: Global Enterprise Key Management Industry Volume K Unit Forecast, by Application 2019 & 2032
- Table 113: Global Enterprise Key Management Industry Revenue Million Forecast, by End-user Verticals 2019 & 2032
- Table 114: Global Enterprise Key Management Industry Volume K Unit Forecast, by End-user Verticals 2019 & 2032
- Table 115: Global Enterprise Key Management Industry Revenue Million Forecast, by Country 2019 & 2032
- Table 116: Global Enterprise Key Management Industry Volume K Unit Forecast, by Country 2019 & 2032
- Table 117: Global Enterprise Key Management Industry Revenue Million Forecast, by Deployment Type 2019 & 2032
- Table 118: Global Enterprise Key Management Industry Volume K Unit Forecast, by Deployment Type 2019 & 2032
- Table 119: Global Enterprise Key Management Industry Revenue Million Forecast, by Application 2019 & 2032
- Table 120: Global Enterprise Key Management Industry Volume K Unit Forecast, by Application 2019 & 2032
- Table 121: Global Enterprise Key Management Industry Revenue Million Forecast, by End-user Verticals 2019 & 2032
- Table 122: Global Enterprise Key Management Industry Volume K Unit Forecast, by End-user Verticals 2019 & 2032
- Table 123: Global Enterprise Key Management Industry Revenue Million Forecast, by Country 2019 & 2032
- Table 124: Global Enterprise Key Management Industry Volume K Unit Forecast, by Country 2019 & 2032
- Table 125: Global Enterprise Key Management Industry Revenue Million Forecast, by Deployment Type 2019 & 2032
- Table 126: Global Enterprise Key Management Industry Volume K Unit Forecast, by Deployment Type 2019 & 2032
- Table 127: Global Enterprise Key Management Industry Revenue Million Forecast, by Application 2019 & 2032
- Table 128: Global Enterprise Key Management Industry Volume K Unit Forecast, by Application 2019 & 2032
- Table 129: Global Enterprise Key Management Industry Revenue Million Forecast, by End-user Verticals 2019 & 2032
- Table 130: Global Enterprise Key Management Industry Volume K Unit Forecast, by End-user Verticals 2019 & 2032
- Table 131: Global Enterprise Key Management Industry Revenue Million Forecast, by Country 2019 & 2032
- Table 132: Global Enterprise Key Management Industry Volume K Unit Forecast, by Country 2019 & 2032
- Table 133: Global Enterprise Key Management Industry Revenue Million Forecast, by Deployment Type 2019 & 2032
- Table 134: Global Enterprise Key Management Industry Volume K Unit Forecast, by Deployment Type 2019 & 2032
- Table 135: Global Enterprise Key Management Industry Revenue Million Forecast, by Application 2019 & 2032
- Table 136: Global Enterprise Key Management Industry Volume K Unit Forecast, by Application 2019 & 2032
- Table 137: Global Enterprise Key Management Industry Revenue Million Forecast, by End-user Verticals 2019 & 2032
- Table 138: Global Enterprise Key Management Industry Volume K Unit Forecast, by End-user Verticals 2019 & 2032
- Table 139: Global Enterprise Key Management Industry Revenue Million Forecast, by Country 2019 & 2032
- Table 140: Global Enterprise Key Management Industry Volume K Unit Forecast, by Country 2019 & 2032
- Table 141: Global Enterprise Key Management Industry Revenue Million Forecast, by Deployment Type 2019 & 2032
- Table 142: Global Enterprise Key Management Industry Volume K Unit Forecast, by Deployment Type 2019 & 2032
- Table 143: Global Enterprise Key Management Industry Revenue Million Forecast, by Application 2019 & 2032
- Table 144: Global Enterprise Key Management Industry Volume K Unit Forecast, by Application 2019 & 2032
- Table 145: Global Enterprise Key Management Industry Revenue Million Forecast, by End-user Verticals 2019 & 2032
- Table 146: Global Enterprise Key Management Industry Volume K Unit Forecast, by End-user Verticals 2019 & 2032
- Table 147: Global Enterprise Key Management Industry Revenue Million Forecast, by Country 2019 & 2032
- Table 148: Global Enterprise Key Management Industry Volume K Unit Forecast, by Country 2019 & 2032
Frequently Asked Questions
1. What is the projected Compound Annual Growth Rate (CAGR) of the Enterprise Key Management Industry?
The projected CAGR is approximately 22.32%.
2. Which companies are prominent players in the Enterprise Key Management Industry?
Key companies in the market include Venafi, IBM Corporation, Hewlett Packard Enterprise Company, Quantum Corporation, Microsoft Corporation, Amazon Web Services Inc, Winmagic Inc, Google Inc (Alphabet), Thales Group (Gemalto NV), Oracle Corporation, Dell Technologies Inc.
3. What are the main segments of the Enterprise Key Management Industry?
The market segments include Deployment Type, Application, End-user Verticals.
4. Can you provide details about the market size?
The market size is estimated to be USD 2.32 Million as of 2022.
5. What are some drivers contributing to market growth?
Optimizing Overall Ownership Cost for Security While Maximizing Operational Efficiency and Security; Loss of High Profile Data and Compliance Issues; Massive Growth of Data Due to the Adoption of IoT and Cloud Technologies.
6. What are the notable trends driving market growth?
Cloud Segment to Witness Significant Growth.
7. Are there any restraints impacting market growth?
Lack of Awareness and Skilled Workforce.
8. Can you provide examples of recent developments in the market?
September 2023: Thales launched Hold Your Own Key (HYOK) by CipherTrust Cloud Key Management in Oracle Cloud Infrastructure (OCI) across 45 Oracle Cloud Regions. Customers of OCI can store and manage their encryption keys outside of OCI in a physical or virtual appliance that is completely under their control and not connected to the cloud by integrating CipherTrust Cloud Key Management. By keeping the key in a separate location from the encrypted data, the Thales external key management solution can facilitate the transfer of sensitive data into Oracle Cloud Regions quickly.
9. What pricing options are available for accessing the report?
Pricing options include single-user, multi-user, and enterprise licenses priced at USD 4750, USD 5250, and USD 8750 respectively.
10. Is the market size provided in terms of value or volume?
The market size is provided in terms of value, measured in Million and volume, measured in K Unit.
11. Are there any specific market keywords associated with the report?
Yes, the market keyword associated with the report is "Enterprise Key Management Industry," which aids in identifying and referencing the specific market segment covered.
12. How do I determine which pricing option suits my needs best?
The pricing options vary based on user requirements and access needs. Individual users may opt for single-user licenses, while businesses requiring broader access may choose multi-user or enterprise licenses for cost-effective access to the report.
13. Are there any additional resources or data provided in the Enterprise Key Management Industry report?
While the report offers comprehensive insights, it's advisable to review the specific contents or supplementary materials provided to ascertain if additional resources or data are available.
14. How can I stay updated on further developments or reports in the Enterprise Key Management Industry?
To stay informed about further developments, trends, and reports in the Enterprise Key Management Industry, consider subscribing to industry newsletters, following relevant companies and organizations, or regularly checking reputable industry news sources and publications.
Methodology
Step 1 - Identification of Relevant Samples Size from Population Database


Step 2 - Approaches for Defining Global Market Size (Value, Volume* & Price*)

Note*: In applicable scenarios
Step 3 - Data Sources
Primary Research
- Web Analytics
- Survey Reports
- Research Institute
- Latest Research Reports
- Opinion Leaders
Secondary Research
- Annual Reports
- White Paper
- Latest Press Release
- Industry Association
- Paid Database
- Investor Presentations

Step 4 - Data Triangulation
Involves using different sources of information in order to increase the validity of a study
These sources are likely to be stakeholders in a program - participants, other researchers, program staff, other community members, and so on.
Then we put all data in single framework & apply various statistical tools to find out the dynamic on the market.
During the analysis stage, feedback from the stakeholder groups would be compared to determine areas of agreement as well as areas of divergence
