

Key Insights
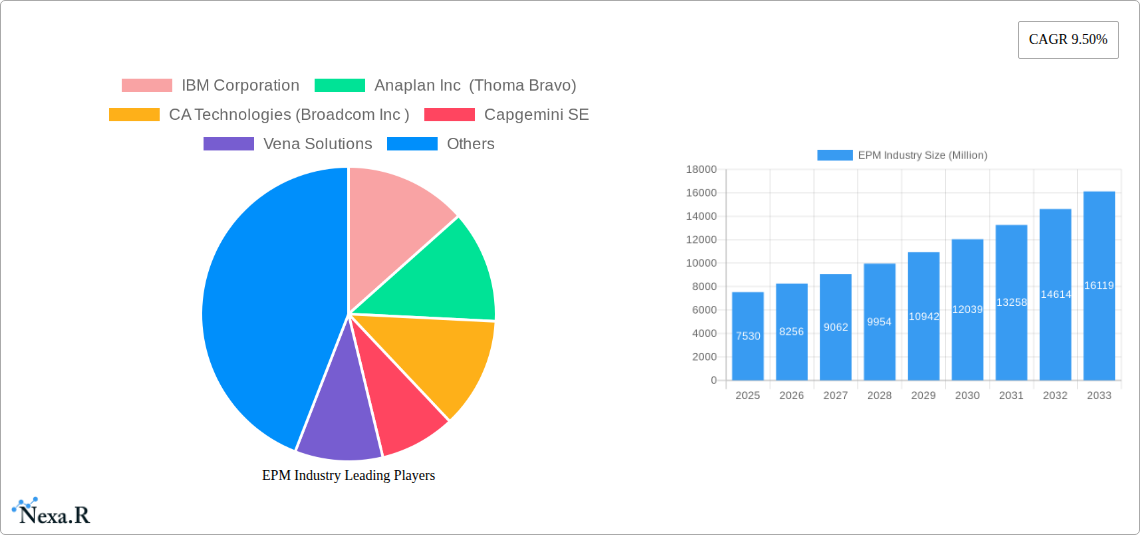
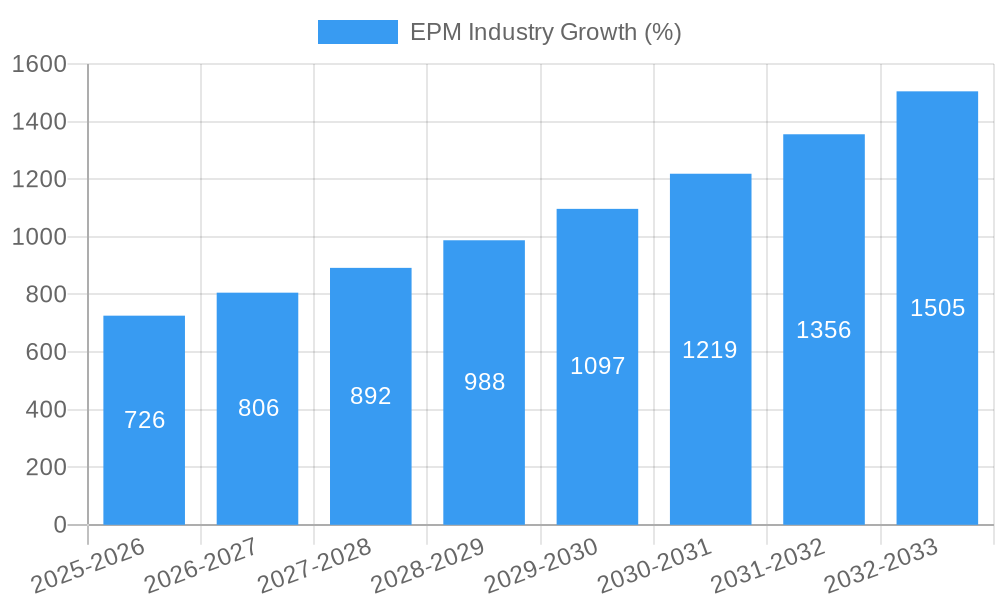
The Enterprise Performance Management (EPM) market is experiencing robust growth, projected to reach \$7.53 billion in 2025 and exhibiting a Compound Annual Growth Rate (CAGR) of 9.50% from 2025 to 2033. This expansion is driven by several key factors. Increasing business complexity and the need for real-time data insights are pushing organizations across various sectors – including BFSI (Banking, Financial Services, and Insurance), Telecommunications, Healthcare, and Manufacturing – to adopt sophisticated EPM solutions. The shift towards cloud-based deployments offers scalability, cost-efficiency, and enhanced accessibility, further fueling market growth. Furthermore, the rising adoption of advanced analytics and artificial intelligence within EPM platforms is enabling more proactive decision-making and improved operational efficiency. The market is segmented by deployment (on-premise and cloud), enterprise size (small and medium, large), and end-user industry, offering diverse opportunities for vendors. While the on-premise segment currently holds a larger market share, cloud-based solutions are witnessing faster growth due to their inherent advantages. Large enterprises are leading the adoption due to their greater need for comprehensive financial and operational management capabilities.
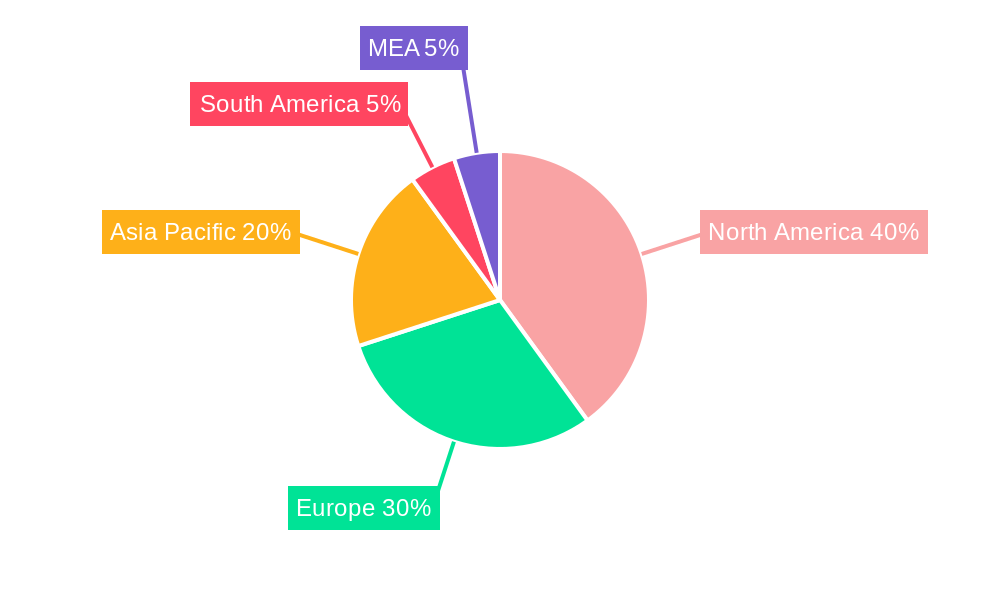
Competition in the EPM market is intense, with established players like IBM, Oracle, and SAP competing alongside specialized providers such as Anaplan and Workday. The market's growth, however, is not without challenges. Integration complexities with existing systems, the need for skilled personnel to manage and interpret EPM data, and the high initial investment costs can act as restraints. However, ongoing technological advancements, coupled with the increasing availability of user-friendly and cost-effective solutions, are likely to mitigate these challenges over time. The geographical distribution of the market sees North America and Europe as currently dominant regions; however, rapid digitalization in Asia-Pacific and other emerging economies presents significant growth potential in the coming years. The continued demand for improved financial planning, forecasting, and reporting capabilities across industries will ensure continued market expansion through 2033.
EPM Industry Market Report: 2019-2033
This comprehensive report provides a detailed analysis of the Enterprise Performance Management (EPM) industry, encompassing market dynamics, growth trends, regional dominance, product landscape, key players, and future outlook. With a study period spanning 2019-2033, a base year of 2025, and a forecast period of 2025-2033, this report offers invaluable insights for industry professionals, investors, and strategic decision-makers. The report segments the market by deployment (on-premise, cloud), enterprise size (small & medium, large), and end-user industry (BFSI, telecommunication, healthcare, manufacturing, others), providing a granular understanding of the market's multifaceted structure. The total market size in 2025 is estimated at XX Million, with a projected value of YY Million by 2033.
EPM Industry Market Dynamics & Structure
The EPM market is characterized by a moderate level of concentration, with key players like IBM, Oracle, and SAP holding significant market share. However, the emergence of cloud-based solutions and niche players is fostering increased competition. Technological innovation, driven by advancements in AI, machine learning, and big data analytics, is a key driver, enabling more sophisticated EPM solutions. Regulatory compliance requirements across various industries, particularly in BFSI and healthcare, are shaping the market landscape. While on-premise solutions still maintain a presence, the cloud segment is experiencing rapid growth, fueled by cost-effectiveness, scalability, and accessibility. Mergers and acquisitions (M&A) activity within the industry has been significant, with notable deals such as Thoma Bravo's acquisition of Anaplan Inc. reshaping the competitive landscape.
- Market Concentration: Moderately concentrated, with top 5 players holding approximately XX% market share in 2025.
- Technological Innovation: AI, Machine Learning, and Big Data integration driving enhanced forecasting and analytics capabilities.
- Regulatory Frameworks: Compliance requirements (e.g., GDPR, HIPAA) influence software development and adoption.
- Competitive Substitutes: Spreadsheet software and basic budgeting tools represent partial substitutes but lack the sophistication of EPM solutions.
- End-User Demographics: Large enterprises represent a significant market segment, followed by growing adoption among SMEs.
- M&A Trends: Significant consolidation in recent years, with larger vendors acquiring smaller specialized firms. XX M&A deals recorded in the last 5 years, totaling an estimated value of ZZ Million.
EPM Industry Growth Trends & Insights
The global EPM market exhibited robust growth during the historical period (2019-2024), driven primarily by increasing adoption of cloud-based solutions and growing demand for real-time insights across various sectors. The market size expanded from approximately AA Million in 2019 to BB Million in 2024. This positive trajectory is expected to continue throughout the forecast period (2025-2033), with a projected Compound Annual Growth Rate (CAGR) of XX%. The shift towards cloud deployment is a major contributing factor, supported by increasing digital transformation initiatives across organizations of all sizes. Technological disruptions, such as the integration of advanced analytics and AI, are enhancing EPM capabilities, leading to increased market penetration. Consumer behavior shifts include a preference for user-friendly interfaces, mobile accessibility, and integrated solutions that streamline planning and reporting processes.
Dominant Regions, Countries, or Segments in EPM Industry
North America currently holds the largest market share in the EPM industry, followed by Europe and Asia-Pacific. This dominance is attributed to factors such as high technological maturity, robust digital infrastructure, and the presence of several major EPM vendors. However, the Asia-Pacific region is experiencing the fastest growth, driven by increasing digitalization and investments in IT infrastructure. Within segments, the cloud deployment model is the fastest-growing segment, surpassing on-premise deployments. The large enterprise segment continues to dominate, although the SME market is witnessing significant growth fueled by the availability of affordable and accessible cloud-based EPM solutions. The BFSI sector remains a major end-user industry, followed by Manufacturing and Healthcare.
- Key Drivers: High IT spending, increased digital transformation initiatives, growing demand for real-time business insights.
- North America: High market maturity and presence of major EPM vendors contribute to high market share.
- Asia-Pacific: Fastest-growing region, driven by rapid digitalization and investment in IT infrastructure.
- Cloud Deployment: The fastest-growing segment due to its scalability, cost-effectiveness, and accessibility.
- Large Enterprises: Dominate market share, while the SME segment experiences rapid growth.
- BFSI Sector: Remains the leading end-user industry due to stringent regulatory requirements and a need for robust financial management.
EPM Industry Product Landscape
The EPM product landscape is evolving rapidly, with vendors continually enhancing their offerings to incorporate advanced analytics, AI-powered forecasting, and improved user interfaces. Key product innovations include integrated planning and budgeting tools, advanced reporting and analytics dashboards, and enhanced data visualization capabilities. These advancements streamline business processes, improve decision-making, and provide more accurate forecasting. Unique selling propositions vary across vendors, including specialized industry solutions, robust integration capabilities, and superior customer support.
Key Drivers, Barriers & Challenges in EPM Industry
Key Drivers:
- Increasing demand for real-time business insights and improved decision-making capabilities.
- Growing adoption of cloud-based solutions and mobile accessibility.
- Advancements in AI, machine learning, and big data analytics.
- Stringent regulatory compliance requirements in several industries.
Key Challenges:
- High implementation costs and complexities associated with some EPM solutions.
- Data integration challenges and inconsistencies across disparate systems.
- Lack of skilled professionals to implement and manage complex EPM systems.
- Competition from niche players and emerging technologies. The competitive landscape has intensified in recent years, leading to a price war in specific market segments, resulting in reduced profit margins for some vendors.
Emerging Opportunities in EPM Industry
- Growing demand for integrated EPM solutions that combine financial planning, budgeting, forecasting, and performance management capabilities.
- Increased adoption of AI-powered predictive analytics to improve forecasting accuracy and identify emerging trends.
- Expansion into new markets, particularly in emerging economies with growing digitalization.
- Development of industry-specific EPM solutions to meet the unique needs of various sectors.
Growth Accelerators in the EPM Industry
Strategic partnerships between EPM vendors and technology providers are driving innovation and market expansion. Technological advancements, such as the integration of blockchain and IoT data into EPM platforms, are creating new opportunities for improved supply chain management and business process optimization. Expansion into new geographic markets and industry verticals, coupled with strong customer support and training programs, are critical for long-term growth.
Key Players Shaping the EPM Industry Market
- IBM Corporation
- Anaplan Inc (Thoma Bravo)
- CA Technologies (Broadcom Inc)
- Capgemini SE
- Vena Solutions
- Adaptive Insights Inc (Workday Inc)
- Oracle Corporation
- Talentia Software
- Workiva Inc
- HCL Technologies Limited
- SAP SE
Notable Milestones in EPM Industry Sector
- April 2022: Oracle Corporation extended support for Hyperion Enterprise Performance Management 11.2 until at least 2033. This significantly extends the lifespan of existing systems and reduces upgrade costs for clients.
- January 2022: PT Metrodata Electronics Tbk partnered with Anaplan, expanding Anaplan's reach in the Indonesian market. This strategic partnership increases Anaplan's market penetration in a key emerging market.
In-Depth EPM Industry Market Outlook
The EPM market is poised for continued growth, driven by technological advancements, increasing demand for real-time insights, and the expansion into new markets and industry segments. Strategic partnerships, focused product innovation, and the proactive addressing of implementation challenges will be key factors determining success. Companies that can effectively leverage AI and machine learning capabilities to enhance forecasting accuracy and provide more insightful analytics will gain a competitive advantage. The cloud-based segment's continued dominance will reshape the market landscape, creating new opportunities and challenges for both established and emerging players.
EPM Industry Segmentation
-
1. Deployment
- 1.1. On-premise
- 1.2. Cloud
-
2. Size of Enterprise
- 2.1. Small and Medium
- 2.2. Large
-
3. End-user Industry
- 3.1. BFSI
- 3.2. Telecommunication
- 3.3. Healthcare
- 3.4. Manufacturing
- 3.5. Other End -user Industries
EPM Industry Segmentation By Geography
- 1. North America
- 2. Europe
- 3. Asia Pacific
- 4. Rest of World
EPM Industry REPORT HIGHLIGHTS
| Aspects | Details |
|---|---|
| Study Period | 2019-2033 |
| Base Year | 2024 |
| Estimated Year | 2025 |
| Forecast Period | 2025-2033 |
| Historical Period | 2019-2024 |
| Growth Rate | CAGR of 9.50% from 2019-2033 |
| Segmentation |
|
Table of Contents
- 1. Introduction
- 1.1. Research Scope
- 1.2. Market Segmentation
- 1.3. Research Methodology
- 1.4. Definitions and Assumptions
- 2. Executive Summary
- 2.1. Introduction
- 3. Market Dynamics
- 3.1. Introduction
- 3.2. Market Drivers
- 3.2.1. Need for Minimizing Operational Expenses; Proliferation of Data Driven Decision Making
- 3.3. Market Restrains
- 3.3.1. Lack of Awareness and Knowledge Among Enterprises
- 3.4. Market Trends
- 3.4.1. BFSI Sector is Expected to Account for Major Market Share
- 4. Market Factor Analysis
- 4.1. Porters Five Forces
- 4.2. Supply/Value Chain
- 4.3. PESTEL analysis
- 4.4. Market Entropy
- 4.5. Patent/Trademark Analysis
- 5. Global EPM Industry Analysis, Insights and Forecast, 2019-2031
- 5.1. Market Analysis, Insights and Forecast - by Deployment
- 5.1.1. On-premise
- 5.1.2. Cloud
- 5.2. Market Analysis, Insights and Forecast - by Size of Enterprise
- 5.2.1. Small and Medium
- 5.2.2. Large
- 5.3. Market Analysis, Insights and Forecast - by End-user Industry
- 5.3.1. BFSI
- 5.3.2. Telecommunication
- 5.3.3. Healthcare
- 5.3.4. Manufacturing
- 5.3.5. Other End -user Industries
- 5.4. Market Analysis, Insights and Forecast - by Region
- 5.4.1. North America
- 5.4.2. Europe
- 5.4.3. Asia Pacific
- 5.4.4. Rest of World
- 5.1. Market Analysis, Insights and Forecast - by Deployment
- 6. North America EPM Industry Analysis, Insights and Forecast, 2019-2031
- 6.1. Market Analysis, Insights and Forecast - by Deployment
- 6.1.1. On-premise
- 6.1.2. Cloud
- 6.2. Market Analysis, Insights and Forecast - by Size of Enterprise
- 6.2.1. Small and Medium
- 6.2.2. Large
- 6.3. Market Analysis, Insights and Forecast - by End-user Industry
- 6.3.1. BFSI
- 6.3.2. Telecommunication
- 6.3.3. Healthcare
- 6.3.4. Manufacturing
- 6.3.5. Other End -user Industries
- 6.1. Market Analysis, Insights and Forecast - by Deployment
- 7. Europe EPM Industry Analysis, Insights and Forecast, 2019-2031
- 7.1. Market Analysis, Insights and Forecast - by Deployment
- 7.1.1. On-premise
- 7.1.2. Cloud
- 7.2. Market Analysis, Insights and Forecast - by Size of Enterprise
- 7.2.1. Small and Medium
- 7.2.2. Large
- 7.3. Market Analysis, Insights and Forecast - by End-user Industry
- 7.3.1. BFSI
- 7.3.2. Telecommunication
- 7.3.3. Healthcare
- 7.3.4. Manufacturing
- 7.3.5. Other End -user Industries
- 7.1. Market Analysis, Insights and Forecast - by Deployment
- 8. Asia Pacific EPM Industry Analysis, Insights and Forecast, 2019-2031
- 8.1. Market Analysis, Insights and Forecast - by Deployment
- 8.1.1. On-premise
- 8.1.2. Cloud
- 8.2. Market Analysis, Insights and Forecast - by Size of Enterprise
- 8.2.1. Small and Medium
- 8.2.2. Large
- 8.3. Market Analysis, Insights and Forecast - by End-user Industry
- 8.3.1. BFSI
- 8.3.2. Telecommunication
- 8.3.3. Healthcare
- 8.3.4. Manufacturing
- 8.3.5. Other End -user Industries
- 8.1. Market Analysis, Insights and Forecast - by Deployment
- 9. Rest of World EPM Industry Analysis, Insights and Forecast, 2019-2031
- 9.1. Market Analysis, Insights and Forecast - by Deployment
- 9.1.1. On-premise
- 9.1.2. Cloud
- 9.2. Market Analysis, Insights and Forecast - by Size of Enterprise
- 9.2.1. Small and Medium
- 9.2.2. Large
- 9.3. Market Analysis, Insights and Forecast - by End-user Industry
- 9.3.1. BFSI
- 9.3.2. Telecommunication
- 9.3.3. Healthcare
- 9.3.4. Manufacturing
- 9.3.5. Other End -user Industries
- 9.1. Market Analysis, Insights and Forecast - by Deployment
- 10. North America EPM Industry Analysis, Insights and Forecast, 2019-2031
- 10.1. Market Analysis, Insights and Forecast - By Country/Sub-region
- 10.1.1 United States
- 10.1.2 Canada
- 10.1.3 Mexico
- 11. Europe EPM Industry Analysis, Insights and Forecast, 2019-2031
- 11.1. Market Analysis, Insights and Forecast - By Country/Sub-region
- 11.1.1 Germany
- 11.1.2 United Kingdom
- 11.1.3 France
- 11.1.4 Spain
- 11.1.5 Italy
- 11.1.6 Spain
- 11.1.7 Belgium
- 11.1.8 Netherland
- 11.1.9 Nordics
- 11.1.10 Rest of Europe
- 12. Asia Pacific EPM Industry Analysis, Insights and Forecast, 2019-2031
- 12.1. Market Analysis, Insights and Forecast - By Country/Sub-region
- 12.1.1 China
- 12.1.2 Japan
- 12.1.3 India
- 12.1.4 South Korea
- 12.1.5 Southeast Asia
- 12.1.6 Australia
- 12.1.7 Indonesia
- 12.1.8 Phillipes
- 12.1.9 Singapore
- 12.1.10 Thailandc
- 12.1.11 Rest of Asia Pacific
- 13. South America EPM Industry Analysis, Insights and Forecast, 2019-2031
- 13.1. Market Analysis, Insights and Forecast - By Country/Sub-region
- 13.1.1 Brazil
- 13.1.2 Argentina
- 13.1.3 Peru
- 13.1.4 Chile
- 13.1.5 Colombia
- 13.1.6 Ecuador
- 13.1.7 Venezuela
- 13.1.8 Rest of South America
- 14. North America EPM Industry Analysis, Insights and Forecast, 2019-2031
- 14.1. Market Analysis, Insights and Forecast - By Country/Sub-region
- 14.1.1 United States
- 14.1.2 Canada
- 14.1.3 Mexico
- 15. MEA EPM Industry Analysis, Insights and Forecast, 2019-2031
- 15.1. Market Analysis, Insights and Forecast - By Country/Sub-region
- 15.1.1 United Arab Emirates
- 15.1.2 Saudi Arabia
- 15.1.3 South Africa
- 15.1.4 Rest of Middle East and Africa
- 16. Competitive Analysis
- 16.1. Global Market Share Analysis 2024
- 16.2. Company Profiles
- 16.2.1 IBM Corporation
- 16.2.1.1. Overview
- 16.2.1.2. Products
- 16.2.1.3. SWOT Analysis
- 16.2.1.4. Recent Developments
- 16.2.1.5. Financials (Based on Availability)
- 16.2.2 Anaplan Inc (Thoma Bravo)
- 16.2.2.1. Overview
- 16.2.2.2. Products
- 16.2.2.3. SWOT Analysis
- 16.2.2.4. Recent Developments
- 16.2.2.5. Financials (Based on Availability)
- 16.2.3 CA Technologies (Broadcom Inc )
- 16.2.3.1. Overview
- 16.2.3.2. Products
- 16.2.3.3. SWOT Analysis
- 16.2.3.4. Recent Developments
- 16.2.3.5. Financials (Based on Availability)
- 16.2.4 Capgemini SE
- 16.2.4.1. Overview
- 16.2.4.2. Products
- 16.2.4.3. SWOT Analysis
- 16.2.4.4. Recent Developments
- 16.2.4.5. Financials (Based on Availability)
- 16.2.5 Vena Solutions
- 16.2.5.1. Overview
- 16.2.5.2. Products
- 16.2.5.3. SWOT Analysis
- 16.2.5.4. Recent Developments
- 16.2.5.5. Financials (Based on Availability)
- 16.2.6 Adaptive Insights Inc (Workday Inc )
- 16.2.6.1. Overview
- 16.2.6.2. Products
- 16.2.6.3. SWOT Analysis
- 16.2.6.4. Recent Developments
- 16.2.6.5. Financials (Based on Availability)
- 16.2.7 Oracle Corporation
- 16.2.7.1. Overview
- 16.2.7.2. Products
- 16.2.7.3. SWOT Analysis
- 16.2.7.4. Recent Developments
- 16.2.7.5. Financials (Based on Availability)
- 16.2.8 Talentia Software*List Not Exhaustive
- 16.2.8.1. Overview
- 16.2.8.2. Products
- 16.2.8.3. SWOT Analysis
- 16.2.8.4. Recent Developments
- 16.2.8.5. Financials (Based on Availability)
- 16.2.9 Workiva Inc
- 16.2.9.1. Overview
- 16.2.9.2. Products
- 16.2.9.3. SWOT Analysis
- 16.2.9.4. Recent Developments
- 16.2.9.5. Financials (Based on Availability)
- 16.2.10 HCL Technologies Limited
- 16.2.10.1. Overview
- 16.2.10.2. Products
- 16.2.10.3. SWOT Analysis
- 16.2.10.4. Recent Developments
- 16.2.10.5. Financials (Based on Availability)
- 16.2.11 SAP SE
- 16.2.11.1. Overview
- 16.2.11.2. Products
- 16.2.11.3. SWOT Analysis
- 16.2.11.4. Recent Developments
- 16.2.11.5. Financials (Based on Availability)
- 16.2.1 IBM Corporation
List of Figures
- Figure 1: Global EPM Industry Revenue Breakdown (Million, %) by Region 2024 & 2032
- Figure 2: North America EPM Industry Revenue (Million), by Country 2024 & 2032
- Figure 3: North America EPM Industry Revenue Share (%), by Country 2024 & 2032
- Figure 4: Europe EPM Industry Revenue (Million), by Country 2024 & 2032
- Figure 5: Europe EPM Industry Revenue Share (%), by Country 2024 & 2032
- Figure 6: Asia Pacific EPM Industry Revenue (Million), by Country 2024 & 2032
- Figure 7: Asia Pacific EPM Industry Revenue Share (%), by Country 2024 & 2032
- Figure 8: South America EPM Industry Revenue (Million), by Country 2024 & 2032
- Figure 9: South America EPM Industry Revenue Share (%), by Country 2024 & 2032
- Figure 10: North America EPM Industry Revenue (Million), by Country 2024 & 2032
- Figure 11: North America EPM Industry Revenue Share (%), by Country 2024 & 2032
- Figure 12: MEA EPM Industry Revenue (Million), by Country 2024 & 2032
- Figure 13: MEA EPM Industry Revenue Share (%), by Country 2024 & 2032
- Figure 14: North America EPM Industry Revenue (Million), by Deployment 2024 & 2032
- Figure 15: North America EPM Industry Revenue Share (%), by Deployment 2024 & 2032
- Figure 16: North America EPM Industry Revenue (Million), by Size of Enterprise 2024 & 2032
- Figure 17: North America EPM Industry Revenue Share (%), by Size of Enterprise 2024 & 2032
- Figure 18: North America EPM Industry Revenue (Million), by End-user Industry 2024 & 2032
- Figure 19: North America EPM Industry Revenue Share (%), by End-user Industry 2024 & 2032
- Figure 20: North America EPM Industry Revenue (Million), by Country 2024 & 2032
- Figure 21: North America EPM Industry Revenue Share (%), by Country 2024 & 2032
- Figure 22: Europe EPM Industry Revenue (Million), by Deployment 2024 & 2032
- Figure 23: Europe EPM Industry Revenue Share (%), by Deployment 2024 & 2032
- Figure 24: Europe EPM Industry Revenue (Million), by Size of Enterprise 2024 & 2032
- Figure 25: Europe EPM Industry Revenue Share (%), by Size of Enterprise 2024 & 2032
- Figure 26: Europe EPM Industry Revenue (Million), by End-user Industry 2024 & 2032
- Figure 27: Europe EPM Industry Revenue Share (%), by End-user Industry 2024 & 2032
- Figure 28: Europe EPM Industry Revenue (Million), by Country 2024 & 2032
- Figure 29: Europe EPM Industry Revenue Share (%), by Country 2024 & 2032
- Figure 30: Asia Pacific EPM Industry Revenue (Million), by Deployment 2024 & 2032
- Figure 31: Asia Pacific EPM Industry Revenue Share (%), by Deployment 2024 & 2032
- Figure 32: Asia Pacific EPM Industry Revenue (Million), by Size of Enterprise 2024 & 2032
- Figure 33: Asia Pacific EPM Industry Revenue Share (%), by Size of Enterprise 2024 & 2032
- Figure 34: Asia Pacific EPM Industry Revenue (Million), by End-user Industry 2024 & 2032
- Figure 35: Asia Pacific EPM Industry Revenue Share (%), by End-user Industry 2024 & 2032
- Figure 36: Asia Pacific EPM Industry Revenue (Million), by Country 2024 & 2032
- Figure 37: Asia Pacific EPM Industry Revenue Share (%), by Country 2024 & 2032
- Figure 38: Rest of World EPM Industry Revenue (Million), by Deployment 2024 & 2032
- Figure 39: Rest of World EPM Industry Revenue Share (%), by Deployment 2024 & 2032
- Figure 40: Rest of World EPM Industry Revenue (Million), by Size of Enterprise 2024 & 2032
- Figure 41: Rest of World EPM Industry Revenue Share (%), by Size of Enterprise 2024 & 2032
- Figure 42: Rest of World EPM Industry Revenue (Million), by End-user Industry 2024 & 2032
- Figure 43: Rest of World EPM Industry Revenue Share (%), by End-user Industry 2024 & 2032
- Figure 44: Rest of World EPM Industry Revenue (Million), by Country 2024 & 2032
- Figure 45: Rest of World EPM Industry Revenue Share (%), by Country 2024 & 2032
List of Tables
- Table 1: Global EPM Industry Revenue Million Forecast, by Region 2019 & 2032
- Table 2: Global EPM Industry Revenue Million Forecast, by Deployment 2019 & 2032
- Table 3: Global EPM Industry Revenue Million Forecast, by Size of Enterprise 2019 & 2032
- Table 4: Global EPM Industry Revenue Million Forecast, by End-user Industry 2019 & 2032
- Table 5: Global EPM Industry Revenue Million Forecast, by Region 2019 & 2032
- Table 6: Global EPM Industry Revenue Million Forecast, by Country 2019 & 2032
- Table 7: United States EPM Industry Revenue (Million) Forecast, by Application 2019 & 2032
- Table 8: Canada EPM Industry Revenue (Million) Forecast, by Application 2019 & 2032
- Table 9: Mexico EPM Industry Revenue (Million) Forecast, by Application 2019 & 2032
- Table 10: Global EPM Industry Revenue Million Forecast, by Country 2019 & 2032
- Table 11: Germany EPM Industry Revenue (Million) Forecast, by Application 2019 & 2032
- Table 12: United Kingdom EPM Industry Revenue (Million) Forecast, by Application 2019 & 2032
- Table 13: France EPM Industry Revenue (Million) Forecast, by Application 2019 & 2032
- Table 14: Spain EPM Industry Revenue (Million) Forecast, by Application 2019 & 2032
- Table 15: Italy EPM Industry Revenue (Million) Forecast, by Application 2019 & 2032
- Table 16: Spain EPM Industry Revenue (Million) Forecast, by Application 2019 & 2032
- Table 17: Belgium EPM Industry Revenue (Million) Forecast, by Application 2019 & 2032
- Table 18: Netherland EPM Industry Revenue (Million) Forecast, by Application 2019 & 2032
- Table 19: Nordics EPM Industry Revenue (Million) Forecast, by Application 2019 & 2032
- Table 20: Rest of Europe EPM Industry Revenue (Million) Forecast, by Application 2019 & 2032
- Table 21: Global EPM Industry Revenue Million Forecast, by Country 2019 & 2032
- Table 22: China EPM Industry Revenue (Million) Forecast, by Application 2019 & 2032
- Table 23: Japan EPM Industry Revenue (Million) Forecast, by Application 2019 & 2032
- Table 24: India EPM Industry Revenue (Million) Forecast, by Application 2019 & 2032
- Table 25: South Korea EPM Industry Revenue (Million) Forecast, by Application 2019 & 2032
- Table 26: Southeast Asia EPM Industry Revenue (Million) Forecast, by Application 2019 & 2032
- Table 27: Australia EPM Industry Revenue (Million) Forecast, by Application 2019 & 2032
- Table 28: Indonesia EPM Industry Revenue (Million) Forecast, by Application 2019 & 2032
- Table 29: Phillipes EPM Industry Revenue (Million) Forecast, by Application 2019 & 2032
- Table 30: Singapore EPM Industry Revenue (Million) Forecast, by Application 2019 & 2032
- Table 31: Thailandc EPM Industry Revenue (Million) Forecast, by Application 2019 & 2032
- Table 32: Rest of Asia Pacific EPM Industry Revenue (Million) Forecast, by Application 2019 & 2032
- Table 33: Global EPM Industry Revenue Million Forecast, by Country 2019 & 2032
- Table 34: Brazil EPM Industry Revenue (Million) Forecast, by Application 2019 & 2032
- Table 35: Argentina EPM Industry Revenue (Million) Forecast, by Application 2019 & 2032
- Table 36: Peru EPM Industry Revenue (Million) Forecast, by Application 2019 & 2032
- Table 37: Chile EPM Industry Revenue (Million) Forecast, by Application 2019 & 2032
- Table 38: Colombia EPM Industry Revenue (Million) Forecast, by Application 2019 & 2032
- Table 39: Ecuador EPM Industry Revenue (Million) Forecast, by Application 2019 & 2032
- Table 40: Venezuela EPM Industry Revenue (Million) Forecast, by Application 2019 & 2032
- Table 41: Rest of South America EPM Industry Revenue (Million) Forecast, by Application 2019 & 2032
- Table 42: Global EPM Industry Revenue Million Forecast, by Country 2019 & 2032
- Table 43: United States EPM Industry Revenue (Million) Forecast, by Application 2019 & 2032
- Table 44: Canada EPM Industry Revenue (Million) Forecast, by Application 2019 & 2032
- Table 45: Mexico EPM Industry Revenue (Million) Forecast, by Application 2019 & 2032
- Table 46: Global EPM Industry Revenue Million Forecast, by Country 2019 & 2032
- Table 47: United Arab Emirates EPM Industry Revenue (Million) Forecast, by Application 2019 & 2032
- Table 48: Saudi Arabia EPM Industry Revenue (Million) Forecast, by Application 2019 & 2032
- Table 49: South Africa EPM Industry Revenue (Million) Forecast, by Application 2019 & 2032
- Table 50: Rest of Middle East and Africa EPM Industry Revenue (Million) Forecast, by Application 2019 & 2032
- Table 51: Global EPM Industry Revenue Million Forecast, by Deployment 2019 & 2032
- Table 52: Global EPM Industry Revenue Million Forecast, by Size of Enterprise 2019 & 2032
- Table 53: Global EPM Industry Revenue Million Forecast, by End-user Industry 2019 & 2032
- Table 54: Global EPM Industry Revenue Million Forecast, by Country 2019 & 2032
- Table 55: Global EPM Industry Revenue Million Forecast, by Deployment 2019 & 2032
- Table 56: Global EPM Industry Revenue Million Forecast, by Size of Enterprise 2019 & 2032
- Table 57: Global EPM Industry Revenue Million Forecast, by End-user Industry 2019 & 2032
- Table 58: Global EPM Industry Revenue Million Forecast, by Country 2019 & 2032
- Table 59: Global EPM Industry Revenue Million Forecast, by Deployment 2019 & 2032
- Table 60: Global EPM Industry Revenue Million Forecast, by Size of Enterprise 2019 & 2032
- Table 61: Global EPM Industry Revenue Million Forecast, by End-user Industry 2019 & 2032
- Table 62: Global EPM Industry Revenue Million Forecast, by Country 2019 & 2032
- Table 63: Global EPM Industry Revenue Million Forecast, by Deployment 2019 & 2032
- Table 64: Global EPM Industry Revenue Million Forecast, by Size of Enterprise 2019 & 2032
- Table 65: Global EPM Industry Revenue Million Forecast, by End-user Industry 2019 & 2032
- Table 66: Global EPM Industry Revenue Million Forecast, by Country 2019 & 2032
Frequently Asked Questions
1. What is the projected Compound Annual Growth Rate (CAGR) of the EPM Industry?
The projected CAGR is approximately 9.50%.
2. Which companies are prominent players in the EPM Industry?
Key companies in the market include IBM Corporation, Anaplan Inc (Thoma Bravo), CA Technologies (Broadcom Inc ), Capgemini SE, Vena Solutions, Adaptive Insights Inc (Workday Inc ), Oracle Corporation, Talentia Software*List Not Exhaustive, Workiva Inc, HCL Technologies Limited, SAP SE.
3. What are the main segments of the EPM Industry?
The market segments include Deployment, Size of Enterprise, End-user Industry.
4. Can you provide details about the market size?
The market size is estimated to be USD 7.53 Million as of 2022.
5. What are some drivers contributing to market growth?
Need for Minimizing Operational Expenses; Proliferation of Data Driven Decision Making.
6. What are the notable trends driving market growth?
BFSI Sector is Expected to Account for Major Market Share.
7. Are there any restraints impacting market growth?
Lack of Awareness and Knowledge Among Enterprises.
8. Can you provide examples of recent developments in the market?
April 2022 - Oracle Corporation extended support for the Hyperion Enterprise Performance Management 11.2, including Oracle Applications Unlimited, through at least 2033. The Oracle Applications covered under the extension include Hyperion, PeopleSoft, Siebel CRM, Oracle E-Business Suite, and others.
9. What pricing options are available for accessing the report?
Pricing options include single-user, multi-user, and enterprise licenses priced at USD 4750, USD 5250, and USD 8750 respectively.
10. Is the market size provided in terms of value or volume?
The market size is provided in terms of value, measured in Million.
11. Are there any specific market keywords associated with the report?
Yes, the market keyword associated with the report is "EPM Industry," which aids in identifying and referencing the specific market segment covered.
12. How do I determine which pricing option suits my needs best?
The pricing options vary based on user requirements and access needs. Individual users may opt for single-user licenses, while businesses requiring broader access may choose multi-user or enterprise licenses for cost-effective access to the report.
13. Are there any additional resources or data provided in the EPM Industry report?
While the report offers comprehensive insights, it's advisable to review the specific contents or supplementary materials provided to ascertain if additional resources or data are available.
14. How can I stay updated on further developments or reports in the EPM Industry?
To stay informed about further developments, trends, and reports in the EPM Industry, consider subscribing to industry newsletters, following relevant companies and organizations, or regularly checking reputable industry news sources and publications.
Methodology
Step 1 - Identification of Relevant Samples Size from Population Database


Step 2 - Approaches for Defining Global Market Size (Value, Volume* & Price*)

Note*: In applicable scenarios
Step 3 - Data Sources
Primary Research
- Web Analytics
- Survey Reports
- Research Institute
- Latest Research Reports
- Opinion Leaders
Secondary Research
- Annual Reports
- White Paper
- Latest Press Release
- Industry Association
- Paid Database
- Investor Presentations

Step 4 - Data Triangulation
Involves using different sources of information in order to increase the validity of a study
These sources are likely to be stakeholders in a program - participants, other researchers, program staff, other community members, and so on.
Then we put all data in single framework & apply various statistical tools to find out the dynamic on the market.
During the analysis stage, feedback from the stakeholder groups would be compared to determine areas of agreement as well as areas of divergence
