

Key Insights
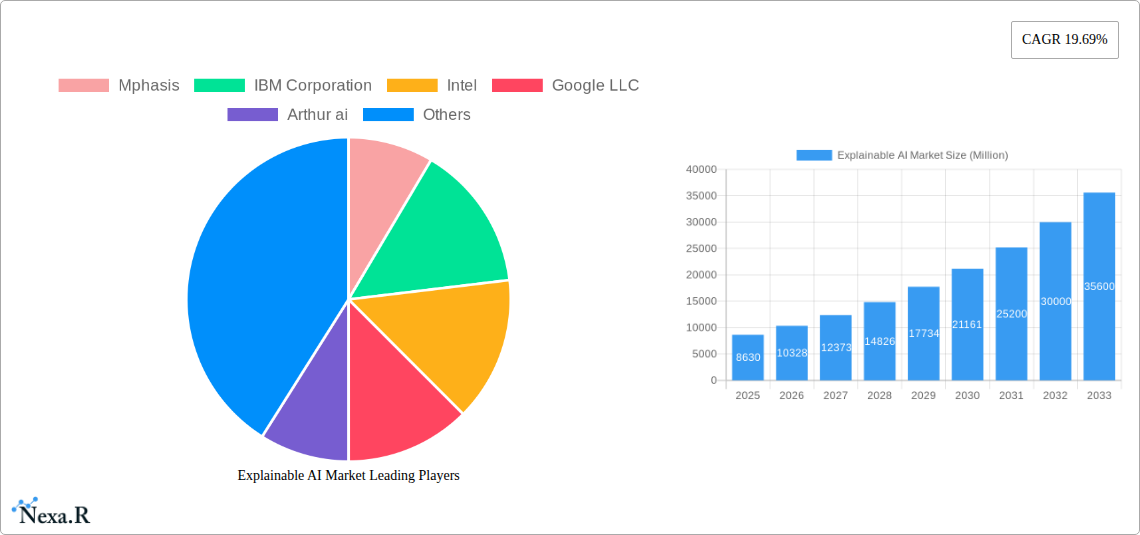
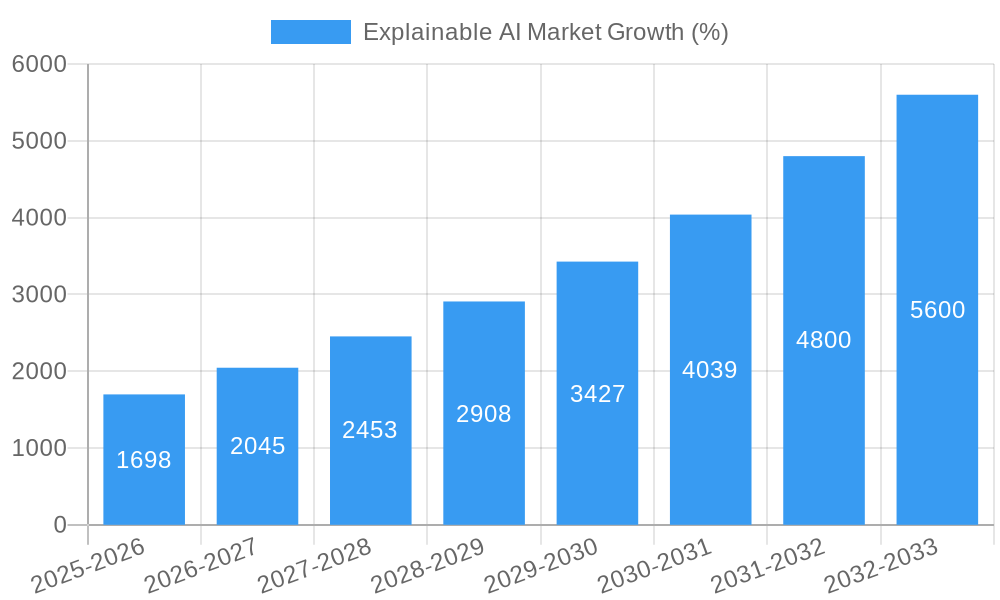
The Explainable AI (XAI) market is experiencing robust growth, projected to reach \$8.63 billion in 2025 and exhibiting a Compound Annual Growth Rate (CAGR) of 19.69% from 2025 to 2033. This surge is driven by increasing demand for transparency and trust in AI-driven decision-making across various sectors. The need to understand how AI algorithms arrive at their conclusions is paramount, especially in high-stakes industries like BFSI (Banking, Financial Services, and Insurance) and healthcare, where regulatory compliance and ethical considerations are crucial. The market is segmented by offering (solutions and services), deployment (cloud and on-premise), and end-user industry, with BFSI, healthcare, and manufacturing currently leading the adoption. The cloud deployment model is gaining significant traction due to its scalability, cost-effectiveness, and accessibility. Technological advancements, such as the development of more sophisticated XAI techniques and the increasing availability of large datasets, are further fueling market expansion. However, challenges such as the complexity of implementing XAI solutions and the scarcity of skilled professionals capable of developing and deploying these systems remain potential restraints. Nevertheless, the overall market outlook remains highly positive, driven by the growing need for accountable and interpretable AI systems.
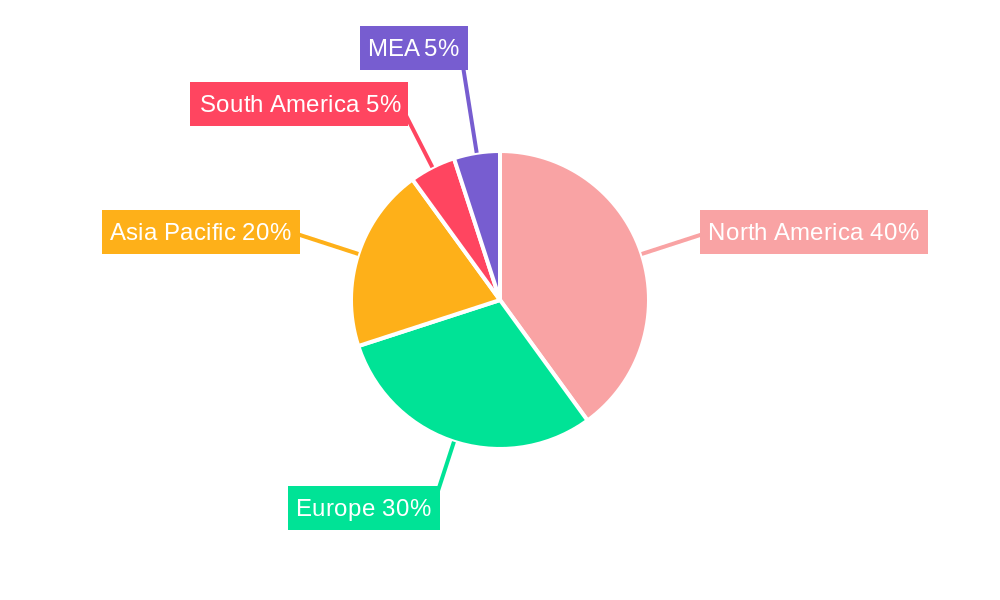
The competitive landscape is characterized by a mix of established technology giants like IBM, Microsoft, Google, and NVIDIA, alongside emerging specialized XAI companies such as Arthur AI, Amelia US LLC, and Ditto AI. These companies are actively developing innovative XAI solutions and services to meet the diverse needs of various industries. Geographic distribution reveals strong market presence in North America, fueled by early adoption and technological advancements. However, the Asia-Pacific region is expected to witness significant growth in the coming years, driven by increasing digitalization and government initiatives promoting AI adoption. Europe also presents a substantial market opportunity, with growing regulatory emphasis on AI transparency and accountability. This combination of technological progress, increasing regulatory pressures, and expanding adoption across diverse sectors ensures that the XAI market is poised for substantial growth in the foreseeable future.
Explainable AI Market: A Comprehensive Report (2019-2033)
This in-depth report provides a comprehensive analysis of the Explainable AI (XAI) market, offering invaluable insights for industry professionals, investors, and strategic decision-makers. The study covers the period 2019-2033, with a focus on 2025, encompassing historical data, current market dynamics, and future projections. The report segments the market by offering (Solutions, Services), deployment (Cloud, On-Premise), and end-user industry (BFSI, Healthcare, Manufacturing, Retail, IT & Telecommunications, Other), providing a granular understanding of this rapidly evolving landscape. The total market size is projected to reach xx Million by 2033.
Explainable AI Market Dynamics & Structure
The Explainable AI market is characterized by moderate concentration, with key players like IBM Corporation, Microsoft Corporation, Google LLC, and NVIDIA holding significant market share. However, the market is also witnessing the emergence of several smaller, innovative companies, fostering healthy competition. Technological advancements, particularly in deep learning and natural language processing, are primary growth drivers. Regulatory frameworks, particularly concerning data privacy and algorithmic bias, are shaping market development. While there are currently limited direct substitutes for XAI solutions, the market faces indirect competition from traditional analytics and business intelligence tools.
- Market Concentration: Moderately concentrated, with top 5 players holding approximately xx% market share in 2025.
- Technological Innovation: Deep learning, NLP, and advancements in model interpretability are key drivers.
- Regulatory Landscape: GDPR, CCPA, and other regulations influence data usage and algorithmic transparency.
- Competitive Substitutes: Traditional analytics and BI tools offer indirect competition.
- M&A Activity: An estimated xx M&A deals occurred between 2019-2024, indicating significant consolidation and investment.
- End-User Demographics: Adoption is highest in technologically advanced sectors like BFSI and IT & Telecommunications.
Explainable AI Market Growth Trends & Insights
The Explainable AI market experienced robust growth during the historical period (2019-2024), with a CAGR of xx%. This growth is fueled by increasing demand for transparency and trust in AI systems across various industries. The market size in 2024 was estimated at xx Million. Adoption rates are rising across different sectors due to the need for understandable and accountable AI decision-making. Technological disruptions, such as the development of more efficient and interpretable algorithms, are further accelerating market expansion. Consumer behavior is shifting towards greater demand for transparency in AI-driven services, creating further opportunities for XAI solutions. Market penetration is expected to reach xx% by 2033, with a projected CAGR of xx% during the forecast period (2025-2033).
Dominant Regions, Countries, or Segments in Explainable AI Market
North America currently holds the largest market share in the Explainable AI market, driven by early adoption of AI technologies and a robust ecosystem of technology companies. Europe is a significant market, propelled by stringent data privacy regulations that necessitate explainable AI solutions. Within the segments, the "Solutions" offering enjoys a larger market share compared to "Services," reflecting the preference for integrated XAI solutions. Cloud-based deployment is experiencing faster growth than on-premise solutions due to scalability and cost-effectiveness. The BFSI and Healthcare sectors exhibit the highest demand for XAI solutions due to regulatory compliance and the critical nature of their decisions.
- North America: Strong technology infrastructure, early adoption of AI, and high investment in R&D.
- Europe: Stringent data privacy regulations drive demand for explainable AI.
- Asia-Pacific: Rapid growth potential due to increasing AI adoption and government initiatives.
- By Offering: Solutions segment dominates due to integrated offerings.
- By Deployment: Cloud deployment leads due to scalability and cost advantages.
- By End-user Industry: BFSI and Healthcare sectors are early adopters.
Explainable AI Market Product Landscape
The XAI product landscape is dynamic, featuring a range of solutions from standalone tools for model interpretation to integrated platforms offering comprehensive XAI capabilities. These products boast enhanced user interfaces for improved accessibility and intuitive visualization of complex algorithms. Key innovations include improved explainability methods, such as SHAP values and LIME, that enhance the transparency and trustworthiness of AI models. The unique selling propositions focus on providing actionable insights, simplifying complex model outputs, and ensuring regulatory compliance.
Key Drivers, Barriers & Challenges in Explainable AI Market
Key Drivers:
- Growing demand for transparency and accountability in AI systems.
- Increasing regulatory scrutiny of AI algorithms.
- Advancements in machine learning interpretability techniques.
- Rising adoption of AI across various industries.
Challenges & Restraints:
- High implementation costs and technical complexity can hinder adoption.
- Lack of skilled professionals to develop and deploy XAI solutions.
- Concerns about the explainability of deep learning models.
- Competitive pressures from established analytics providers.
Emerging Opportunities in Explainable AI Market
- Untapped markets in developing economies offer substantial growth potential.
- Development of XAI solutions tailored to specific industry needs.
- Growing demand for explainable AI in areas such as healthcare and finance.
- Integration of XAI with other technologies such as IoT and blockchain.
Growth Accelerators in the Explainable AI Market Industry
Technological advancements, particularly in areas like causal inference and neural network explainability, will fuel long-term growth. Strategic partnerships between XAI companies and large enterprises will drive adoption. Expansion into new geographic markets and vertical industries, particularly those with stringent regulatory compliance requirements, will significantly broaden market reach.
Key Players Shaping the Explainable AI Market Market
- Mphasis
- IBM Corporation
- Intel
- Google LLC
- Arthur ai
- Microsoft Corporation
- NVIDIA
- Amelia US LLC
- AWS
- Ditto ai
- Altery
Notable Milestones in Explainable AI Market Sector
- 2020: Increased focus on ethical AI and model explainability.
- 2021: Several major cloud providers launched XAI-focused services.
- 2022: Significant M&A activity consolidated the market landscape.
- 2023: New regulatory frameworks further emphasized the need for transparency in AI.
In-Depth Explainable AI Market Market Outlook
The Explainable AI market is poised for sustained growth, driven by increasing demand for transparency and trust in AI systems. The future potential lies in developing more sophisticated and accessible XAI tools, tailored to specific industry needs. Strategic partnerships and collaborations across the ecosystem will further accelerate adoption, unlocking significant opportunities for market expansion and innovation. The market is expected to reach xx Million by 2033, presenting a compelling investment opportunity for stakeholders.
Explainable AI Market Segmentation
-
1. Offering
- 1.1. Solution
- 1.2. Services
-
2. Deployment
- 2.1. Cloud
- 2.2. On-premise
-
3. End-user Industry
- 3.1. BFSI
- 3.2. Healthcare
- 3.3. Manufacturing
- 3.4. Retail
- 3.5. IT and Telecommunication
- 3.6. Other End-user Industries
Explainable AI Market Segmentation By Geography
- 1. North America
- 2. Europe
- 3. Asia
- 4. Australia and New Zealand
- 5. Latin America
- 6. Middle East and Africa
Explainable AI Market REPORT HIGHLIGHTS
| Aspects | Details |
|---|---|
| Study Period | 2019-2033 |
| Base Year | 2024 |
| Estimated Year | 2025 |
| Forecast Period | 2025-2033 |
| Historical Period | 2019-2024 |
| Growth Rate | CAGR of 19.69% from 2019-2033 |
| Segmentation |
|
Table of Contents
- 1. Introduction
- 1.1. Research Scope
- 1.2. Market Segmentation
- 1.3. Research Methodology
- 1.4. Definitions and Assumptions
- 2. Executive Summary
- 2.1. Introduction
- 3. Market Dynamics
- 3.1. Introduction
- 3.2. Market Drivers
- 3.2.1. Growing Need for Accountability and Transparency in AI Systems; Increasing Use of Cutting-edge Technologies for Innovation
- 3.3. Market Restrains
- 3.3.1. High Implementation Cost of Explainable AI; Lack of Skilled and Expert AI Technicians
- 3.4. Market Trends
- 3.4.1. BFSI Segment is Expected to Hold Significant Share of the Market
- 4. Market Factor Analysis
- 4.1. Porters Five Forces
- 4.2. Supply/Value Chain
- 4.3. PESTEL analysis
- 4.4. Market Entropy
- 4.5. Patent/Trademark Analysis
- 5. Global Explainable AI Market Analysis, Insights and Forecast, 2019-2031
- 5.1. Market Analysis, Insights and Forecast - by Offering
- 5.1.1. Solution
- 5.1.2. Services
- 5.2. Market Analysis, Insights and Forecast - by Deployment
- 5.2.1. Cloud
- 5.2.2. On-premise
- 5.3. Market Analysis, Insights and Forecast - by End-user Industry
- 5.3.1. BFSI
- 5.3.2. Healthcare
- 5.3.3. Manufacturing
- 5.3.4. Retail
- 5.3.5. IT and Telecommunication
- 5.3.6. Other End-user Industries
- 5.4. Market Analysis, Insights and Forecast - by Region
- 5.4.1. North America
- 5.4.2. Europe
- 5.4.3. Asia
- 5.4.4. Australia and New Zealand
- 5.4.5. Latin America
- 5.4.6. Middle East and Africa
- 5.1. Market Analysis, Insights and Forecast - by Offering
- 6. North America Explainable AI Market Analysis, Insights and Forecast, 2019-2031
- 6.1. Market Analysis, Insights and Forecast - by Offering
- 6.1.1. Solution
- 6.1.2. Services
- 6.2. Market Analysis, Insights and Forecast - by Deployment
- 6.2.1. Cloud
- 6.2.2. On-premise
- 6.3. Market Analysis, Insights and Forecast - by End-user Industry
- 6.3.1. BFSI
- 6.3.2. Healthcare
- 6.3.3. Manufacturing
- 6.3.4. Retail
- 6.3.5. IT and Telecommunication
- 6.3.6. Other End-user Industries
- 6.1. Market Analysis, Insights and Forecast - by Offering
- 7. Europe Explainable AI Market Analysis, Insights and Forecast, 2019-2031
- 7.1. Market Analysis, Insights and Forecast - by Offering
- 7.1.1. Solution
- 7.1.2. Services
- 7.2. Market Analysis, Insights and Forecast - by Deployment
- 7.2.1. Cloud
- 7.2.2. On-premise
- 7.3. Market Analysis, Insights and Forecast - by End-user Industry
- 7.3.1. BFSI
- 7.3.2. Healthcare
- 7.3.3. Manufacturing
- 7.3.4. Retail
- 7.3.5. IT and Telecommunication
- 7.3.6. Other End-user Industries
- 7.1. Market Analysis, Insights and Forecast - by Offering
- 8. Asia Explainable AI Market Analysis, Insights and Forecast, 2019-2031
- 8.1. Market Analysis, Insights and Forecast - by Offering
- 8.1.1. Solution
- 8.1.2. Services
- 8.2. Market Analysis, Insights and Forecast - by Deployment
- 8.2.1. Cloud
- 8.2.2. On-premise
- 8.3. Market Analysis, Insights and Forecast - by End-user Industry
- 8.3.1. BFSI
- 8.3.2. Healthcare
- 8.3.3. Manufacturing
- 8.3.4. Retail
- 8.3.5. IT and Telecommunication
- 8.3.6. Other End-user Industries
- 8.1. Market Analysis, Insights and Forecast - by Offering
- 9. Australia and New Zealand Explainable AI Market Analysis, Insights and Forecast, 2019-2031
- 9.1. Market Analysis, Insights and Forecast - by Offering
- 9.1.1. Solution
- 9.1.2. Services
- 9.2. Market Analysis, Insights and Forecast - by Deployment
- 9.2.1. Cloud
- 9.2.2. On-premise
- 9.3. Market Analysis, Insights and Forecast - by End-user Industry
- 9.3.1. BFSI
- 9.3.2. Healthcare
- 9.3.3. Manufacturing
- 9.3.4. Retail
- 9.3.5. IT and Telecommunication
- 9.3.6. Other End-user Industries
- 9.1. Market Analysis, Insights and Forecast - by Offering
- 10. Latin America Explainable AI Market Analysis, Insights and Forecast, 2019-2031
- 10.1. Market Analysis, Insights and Forecast - by Offering
- 10.1.1. Solution
- 10.1.2. Services
- 10.2. Market Analysis, Insights and Forecast - by Deployment
- 10.2.1. Cloud
- 10.2.2. On-premise
- 10.3. Market Analysis, Insights and Forecast - by End-user Industry
- 10.3.1. BFSI
- 10.3.2. Healthcare
- 10.3.3. Manufacturing
- 10.3.4. Retail
- 10.3.5. IT and Telecommunication
- 10.3.6. Other End-user Industries
- 10.1. Market Analysis, Insights and Forecast - by Offering
- 11. Middle East and Africa Explainable AI Market Analysis, Insights and Forecast, 2019-2031
- 11.1. Market Analysis, Insights and Forecast - by Offering
- 11.1.1. Solution
- 11.1.2. Services
- 11.2. Market Analysis, Insights and Forecast - by Deployment
- 11.2.1. Cloud
- 11.2.2. On-premise
- 11.3. Market Analysis, Insights and Forecast - by End-user Industry
- 11.3.1. BFSI
- 11.3.2. Healthcare
- 11.3.3. Manufacturing
- 11.3.4. Retail
- 11.3.5. IT and Telecommunication
- 11.3.6. Other End-user Industries
- 11.1. Market Analysis, Insights and Forecast - by Offering
- 12. North America Explainable AI Market Analysis, Insights and Forecast, 2019-2031
- 12.1. Market Analysis, Insights and Forecast - By Country/Sub-region
- 12.1.1 United States
- 12.1.2 Canada
- 12.1.3 Mexico
- 13. Europe Explainable AI Market Analysis, Insights and Forecast, 2019-2031
- 13.1. Market Analysis, Insights and Forecast - By Country/Sub-region
- 13.1.1 Germany
- 13.1.2 United Kingdom
- 13.1.3 France
- 13.1.4 Spain
- 13.1.5 Italy
- 13.1.6 Spain
- 13.1.7 Belgium
- 13.1.8 Netherland
- 13.1.9 Nordics
- 13.1.10 Rest of Europe
- 14. Asia Pacific Explainable AI Market Analysis, Insights and Forecast, 2019-2031
- 14.1. Market Analysis, Insights and Forecast - By Country/Sub-region
- 14.1.1 China
- 14.1.2 Japan
- 14.1.3 India
- 14.1.4 South Korea
- 14.1.5 Southeast Asia
- 14.1.6 Australia
- 14.1.7 Indonesia
- 14.1.8 Phillipes
- 14.1.9 Singapore
- 14.1.10 Thailandc
- 14.1.11 Rest of Asia Pacific
- 15. South America Explainable AI Market Analysis, Insights and Forecast, 2019-2031
- 15.1. Market Analysis, Insights and Forecast - By Country/Sub-region
- 15.1.1 Brazil
- 15.1.2 Argentina
- 15.1.3 Peru
- 15.1.4 Chile
- 15.1.5 Colombia
- 15.1.6 Ecuador
- 15.1.7 Venezuela
- 15.1.8 Rest of South America
- 16. North America Explainable AI Market Analysis, Insights and Forecast, 2019-2031
- 16.1. Market Analysis, Insights and Forecast - By Country/Sub-region
- 16.1.1 United States
- 16.1.2 Canada
- 16.1.3 Mexico
- 17. MEA Explainable AI Market Analysis, Insights and Forecast, 2019-2031
- 17.1. Market Analysis, Insights and Forecast - By Country/Sub-region
- 17.1.1 United Arab Emirates
- 17.1.2 Saudi Arabia
- 17.1.3 South Africa
- 17.1.4 Rest of Middle East and Africa
- 18. Competitive Analysis
- 18.1. Global Market Share Analysis 2024
- 18.2. Company Profiles
- 18.2.1 Mphasis
- 18.2.1.1. Overview
- 18.2.1.2. Products
- 18.2.1.3. SWOT Analysis
- 18.2.1.4. Recent Developments
- 18.2.1.5. Financials (Based on Availability)
- 18.2.2 IBM Corporation
- 18.2.2.1. Overview
- 18.2.2.2. Products
- 18.2.2.3. SWOT Analysis
- 18.2.2.4. Recent Developments
- 18.2.2.5. Financials (Based on Availability)
- 18.2.3 Intel
- 18.2.3.1. Overview
- 18.2.3.2. Products
- 18.2.3.3. SWOT Analysis
- 18.2.3.4. Recent Developments
- 18.2.3.5. Financials (Based on Availability)
- 18.2.4 Google LLC
- 18.2.4.1. Overview
- 18.2.4.2. Products
- 18.2.4.3. SWOT Analysis
- 18.2.4.4. Recent Developments
- 18.2.4.5. Financials (Based on Availability)
- 18.2.5 Arthur ai
- 18.2.5.1. Overview
- 18.2.5.2. Products
- 18.2.5.3. SWOT Analysis
- 18.2.5.4. Recent Developments
- 18.2.5.5. Financials (Based on Availability)
- 18.2.6 Microsoft Corporation
- 18.2.6.1. Overview
- 18.2.6.2. Products
- 18.2.6.3. SWOT Analysis
- 18.2.6.4. Recent Developments
- 18.2.6.5. Financials (Based on Availability)
- 18.2.7 NVIDIA
- 18.2.7.1. Overview
- 18.2.7.2. Products
- 18.2.7.3. SWOT Analysis
- 18.2.7.4. Recent Developments
- 18.2.7.5. Financials (Based on Availability)
- 18.2.8 Amelia US LLC
- 18.2.8.1. Overview
- 18.2.8.2. Products
- 18.2.8.3. SWOT Analysis
- 18.2.8.4. Recent Developments
- 18.2.8.5. Financials (Based on Availability)
- 18.2.9 AWS
- 18.2.9.1. Overview
- 18.2.9.2. Products
- 18.2.9.3. SWOT Analysis
- 18.2.9.4. Recent Developments
- 18.2.9.5. Financials (Based on Availability)
- 18.2.10 Ditto ai
- 18.2.10.1. Overview
- 18.2.10.2. Products
- 18.2.10.3. SWOT Analysis
- 18.2.10.4. Recent Developments
- 18.2.10.5. Financials (Based on Availability)
- 18.2.11 Altery
- 18.2.11.1. Overview
- 18.2.11.2. Products
- 18.2.11.3. SWOT Analysis
- 18.2.11.4. Recent Developments
- 18.2.11.5. Financials (Based on Availability)
- 18.2.1 Mphasis
List of Figures
- Figure 1: Global Explainable AI Market Revenue Breakdown (Million, %) by Region 2024 & 2032
- Figure 2: North America Explainable AI Market Revenue (Million), by Country 2024 & 2032
- Figure 3: North America Explainable AI Market Revenue Share (%), by Country 2024 & 2032
- Figure 4: Europe Explainable AI Market Revenue (Million), by Country 2024 & 2032
- Figure 5: Europe Explainable AI Market Revenue Share (%), by Country 2024 & 2032
- Figure 6: Asia Pacific Explainable AI Market Revenue (Million), by Country 2024 & 2032
- Figure 7: Asia Pacific Explainable AI Market Revenue Share (%), by Country 2024 & 2032
- Figure 8: South America Explainable AI Market Revenue (Million), by Country 2024 & 2032
- Figure 9: South America Explainable AI Market Revenue Share (%), by Country 2024 & 2032
- Figure 10: North America Explainable AI Market Revenue (Million), by Country 2024 & 2032
- Figure 11: North America Explainable AI Market Revenue Share (%), by Country 2024 & 2032
- Figure 12: MEA Explainable AI Market Revenue (Million), by Country 2024 & 2032
- Figure 13: MEA Explainable AI Market Revenue Share (%), by Country 2024 & 2032
- Figure 14: North America Explainable AI Market Revenue (Million), by Offering 2024 & 2032
- Figure 15: North America Explainable AI Market Revenue Share (%), by Offering 2024 & 2032
- Figure 16: North America Explainable AI Market Revenue (Million), by Deployment 2024 & 2032
- Figure 17: North America Explainable AI Market Revenue Share (%), by Deployment 2024 & 2032
- Figure 18: North America Explainable AI Market Revenue (Million), by End-user Industry 2024 & 2032
- Figure 19: North America Explainable AI Market Revenue Share (%), by End-user Industry 2024 & 2032
- Figure 20: North America Explainable AI Market Revenue (Million), by Country 2024 & 2032
- Figure 21: North America Explainable AI Market Revenue Share (%), by Country 2024 & 2032
- Figure 22: Europe Explainable AI Market Revenue (Million), by Offering 2024 & 2032
- Figure 23: Europe Explainable AI Market Revenue Share (%), by Offering 2024 & 2032
- Figure 24: Europe Explainable AI Market Revenue (Million), by Deployment 2024 & 2032
- Figure 25: Europe Explainable AI Market Revenue Share (%), by Deployment 2024 & 2032
- Figure 26: Europe Explainable AI Market Revenue (Million), by End-user Industry 2024 & 2032
- Figure 27: Europe Explainable AI Market Revenue Share (%), by End-user Industry 2024 & 2032
- Figure 28: Europe Explainable AI Market Revenue (Million), by Country 2024 & 2032
- Figure 29: Europe Explainable AI Market Revenue Share (%), by Country 2024 & 2032
- Figure 30: Asia Explainable AI Market Revenue (Million), by Offering 2024 & 2032
- Figure 31: Asia Explainable AI Market Revenue Share (%), by Offering 2024 & 2032
- Figure 32: Asia Explainable AI Market Revenue (Million), by Deployment 2024 & 2032
- Figure 33: Asia Explainable AI Market Revenue Share (%), by Deployment 2024 & 2032
- Figure 34: Asia Explainable AI Market Revenue (Million), by End-user Industry 2024 & 2032
- Figure 35: Asia Explainable AI Market Revenue Share (%), by End-user Industry 2024 & 2032
- Figure 36: Asia Explainable AI Market Revenue (Million), by Country 2024 & 2032
- Figure 37: Asia Explainable AI Market Revenue Share (%), by Country 2024 & 2032
- Figure 38: Australia and New Zealand Explainable AI Market Revenue (Million), by Offering 2024 & 2032
- Figure 39: Australia and New Zealand Explainable AI Market Revenue Share (%), by Offering 2024 & 2032
- Figure 40: Australia and New Zealand Explainable AI Market Revenue (Million), by Deployment 2024 & 2032
- Figure 41: Australia and New Zealand Explainable AI Market Revenue Share (%), by Deployment 2024 & 2032
- Figure 42: Australia and New Zealand Explainable AI Market Revenue (Million), by End-user Industry 2024 & 2032
- Figure 43: Australia and New Zealand Explainable AI Market Revenue Share (%), by End-user Industry 2024 & 2032
- Figure 44: Australia and New Zealand Explainable AI Market Revenue (Million), by Country 2024 & 2032
- Figure 45: Australia and New Zealand Explainable AI Market Revenue Share (%), by Country 2024 & 2032
- Figure 46: Latin America Explainable AI Market Revenue (Million), by Offering 2024 & 2032
- Figure 47: Latin America Explainable AI Market Revenue Share (%), by Offering 2024 & 2032
- Figure 48: Latin America Explainable AI Market Revenue (Million), by Deployment 2024 & 2032
- Figure 49: Latin America Explainable AI Market Revenue Share (%), by Deployment 2024 & 2032
- Figure 50: Latin America Explainable AI Market Revenue (Million), by End-user Industry 2024 & 2032
- Figure 51: Latin America Explainable AI Market Revenue Share (%), by End-user Industry 2024 & 2032
- Figure 52: Latin America Explainable AI Market Revenue (Million), by Country 2024 & 2032
- Figure 53: Latin America Explainable AI Market Revenue Share (%), by Country 2024 & 2032
- Figure 54: Middle East and Africa Explainable AI Market Revenue (Million), by Offering 2024 & 2032
- Figure 55: Middle East and Africa Explainable AI Market Revenue Share (%), by Offering 2024 & 2032
- Figure 56: Middle East and Africa Explainable AI Market Revenue (Million), by Deployment 2024 & 2032
- Figure 57: Middle East and Africa Explainable AI Market Revenue Share (%), by Deployment 2024 & 2032
- Figure 58: Middle East and Africa Explainable AI Market Revenue (Million), by End-user Industry 2024 & 2032
- Figure 59: Middle East and Africa Explainable AI Market Revenue Share (%), by End-user Industry 2024 & 2032
- Figure 60: Middle East and Africa Explainable AI Market Revenue (Million), by Country 2024 & 2032
- Figure 61: Middle East and Africa Explainable AI Market Revenue Share (%), by Country 2024 & 2032
List of Tables
- Table 1: Global Explainable AI Market Revenue Million Forecast, by Region 2019 & 2032
- Table 2: Global Explainable AI Market Revenue Million Forecast, by Offering 2019 & 2032
- Table 3: Global Explainable AI Market Revenue Million Forecast, by Deployment 2019 & 2032
- Table 4: Global Explainable AI Market Revenue Million Forecast, by End-user Industry 2019 & 2032
- Table 5: Global Explainable AI Market Revenue Million Forecast, by Region 2019 & 2032
- Table 6: Global Explainable AI Market Revenue Million Forecast, by Country 2019 & 2032
- Table 7: United States Explainable AI Market Revenue (Million) Forecast, by Application 2019 & 2032
- Table 8: Canada Explainable AI Market Revenue (Million) Forecast, by Application 2019 & 2032
- Table 9: Mexico Explainable AI Market Revenue (Million) Forecast, by Application 2019 & 2032
- Table 10: Global Explainable AI Market Revenue Million Forecast, by Country 2019 & 2032
- Table 11: Germany Explainable AI Market Revenue (Million) Forecast, by Application 2019 & 2032
- Table 12: United Kingdom Explainable AI Market Revenue (Million) Forecast, by Application 2019 & 2032
- Table 13: France Explainable AI Market Revenue (Million) Forecast, by Application 2019 & 2032
- Table 14: Spain Explainable AI Market Revenue (Million) Forecast, by Application 2019 & 2032
- Table 15: Italy Explainable AI Market Revenue (Million) Forecast, by Application 2019 & 2032
- Table 16: Spain Explainable AI Market Revenue (Million) Forecast, by Application 2019 & 2032
- Table 17: Belgium Explainable AI Market Revenue (Million) Forecast, by Application 2019 & 2032
- Table 18: Netherland Explainable AI Market Revenue (Million) Forecast, by Application 2019 & 2032
- Table 19: Nordics Explainable AI Market Revenue (Million) Forecast, by Application 2019 & 2032
- Table 20: Rest of Europe Explainable AI Market Revenue (Million) Forecast, by Application 2019 & 2032
- Table 21: Global Explainable AI Market Revenue Million Forecast, by Country 2019 & 2032
- Table 22: China Explainable AI Market Revenue (Million) Forecast, by Application 2019 & 2032
- Table 23: Japan Explainable AI Market Revenue (Million) Forecast, by Application 2019 & 2032
- Table 24: India Explainable AI Market Revenue (Million) Forecast, by Application 2019 & 2032
- Table 25: South Korea Explainable AI Market Revenue (Million) Forecast, by Application 2019 & 2032
- Table 26: Southeast Asia Explainable AI Market Revenue (Million) Forecast, by Application 2019 & 2032
- Table 27: Australia Explainable AI Market Revenue (Million) Forecast, by Application 2019 & 2032
- Table 28: Indonesia Explainable AI Market Revenue (Million) Forecast, by Application 2019 & 2032
- Table 29: Phillipes Explainable AI Market Revenue (Million) Forecast, by Application 2019 & 2032
- Table 30: Singapore Explainable AI Market Revenue (Million) Forecast, by Application 2019 & 2032
- Table 31: Thailandc Explainable AI Market Revenue (Million) Forecast, by Application 2019 & 2032
- Table 32: Rest of Asia Pacific Explainable AI Market Revenue (Million) Forecast, by Application 2019 & 2032
- Table 33: Global Explainable AI Market Revenue Million Forecast, by Country 2019 & 2032
- Table 34: Brazil Explainable AI Market Revenue (Million) Forecast, by Application 2019 & 2032
- Table 35: Argentina Explainable AI Market Revenue (Million) Forecast, by Application 2019 & 2032
- Table 36: Peru Explainable AI Market Revenue (Million) Forecast, by Application 2019 & 2032
- Table 37: Chile Explainable AI Market Revenue (Million) Forecast, by Application 2019 & 2032
- Table 38: Colombia Explainable AI Market Revenue (Million) Forecast, by Application 2019 & 2032
- Table 39: Ecuador Explainable AI Market Revenue (Million) Forecast, by Application 2019 & 2032
- Table 40: Venezuela Explainable AI Market Revenue (Million) Forecast, by Application 2019 & 2032
- Table 41: Rest of South America Explainable AI Market Revenue (Million) Forecast, by Application 2019 & 2032
- Table 42: Global Explainable AI Market Revenue Million Forecast, by Country 2019 & 2032
- Table 43: United States Explainable AI Market Revenue (Million) Forecast, by Application 2019 & 2032
- Table 44: Canada Explainable AI Market Revenue (Million) Forecast, by Application 2019 & 2032
- Table 45: Mexico Explainable AI Market Revenue (Million) Forecast, by Application 2019 & 2032
- Table 46: Global Explainable AI Market Revenue Million Forecast, by Country 2019 & 2032
- Table 47: United Arab Emirates Explainable AI Market Revenue (Million) Forecast, by Application 2019 & 2032
- Table 48: Saudi Arabia Explainable AI Market Revenue (Million) Forecast, by Application 2019 & 2032
- Table 49: South Africa Explainable AI Market Revenue (Million) Forecast, by Application 2019 & 2032
- Table 50: Rest of Middle East and Africa Explainable AI Market Revenue (Million) Forecast, by Application 2019 & 2032
- Table 51: Global Explainable AI Market Revenue Million Forecast, by Offering 2019 & 2032
- Table 52: Global Explainable AI Market Revenue Million Forecast, by Deployment 2019 & 2032
- Table 53: Global Explainable AI Market Revenue Million Forecast, by End-user Industry 2019 & 2032
- Table 54: Global Explainable AI Market Revenue Million Forecast, by Country 2019 & 2032
- Table 55: Global Explainable AI Market Revenue Million Forecast, by Offering 2019 & 2032
- Table 56: Global Explainable AI Market Revenue Million Forecast, by Deployment 2019 & 2032
- Table 57: Global Explainable AI Market Revenue Million Forecast, by End-user Industry 2019 & 2032
- Table 58: Global Explainable AI Market Revenue Million Forecast, by Country 2019 & 2032
- Table 59: Global Explainable AI Market Revenue Million Forecast, by Offering 2019 & 2032
- Table 60: Global Explainable AI Market Revenue Million Forecast, by Deployment 2019 & 2032
- Table 61: Global Explainable AI Market Revenue Million Forecast, by End-user Industry 2019 & 2032
- Table 62: Global Explainable AI Market Revenue Million Forecast, by Country 2019 & 2032
- Table 63: Global Explainable AI Market Revenue Million Forecast, by Offering 2019 & 2032
- Table 64: Global Explainable AI Market Revenue Million Forecast, by Deployment 2019 & 2032
- Table 65: Global Explainable AI Market Revenue Million Forecast, by End-user Industry 2019 & 2032
- Table 66: Global Explainable AI Market Revenue Million Forecast, by Country 2019 & 2032
- Table 67: Global Explainable AI Market Revenue Million Forecast, by Offering 2019 & 2032
- Table 68: Global Explainable AI Market Revenue Million Forecast, by Deployment 2019 & 2032
- Table 69: Global Explainable AI Market Revenue Million Forecast, by End-user Industry 2019 & 2032
- Table 70: Global Explainable AI Market Revenue Million Forecast, by Country 2019 & 2032
- Table 71: Global Explainable AI Market Revenue Million Forecast, by Offering 2019 & 2032
- Table 72: Global Explainable AI Market Revenue Million Forecast, by Deployment 2019 & 2032
- Table 73: Global Explainable AI Market Revenue Million Forecast, by End-user Industry 2019 & 2032
- Table 74: Global Explainable AI Market Revenue Million Forecast, by Country 2019 & 2032
Frequently Asked Questions
1. What is the projected Compound Annual Growth Rate (CAGR) of the Explainable AI Market?
The projected CAGR is approximately 19.69%.
2. Which companies are prominent players in the Explainable AI Market?
Key companies in the market include Mphasis, IBM Corporation, Intel, Google LLC, Arthur ai, Microsoft Corporation, NVIDIA, Amelia US LLC, AWS, Ditto ai, Altery.
3. What are the main segments of the Explainable AI Market?
The market segments include Offering, Deployment, End-user Industry.
4. Can you provide details about the market size?
The market size is estimated to be USD 8.63 Million as of 2022.
5. What are some drivers contributing to market growth?
Growing Need for Accountability and Transparency in AI Systems; Increasing Use of Cutting-edge Technologies for Innovation.
6. What are the notable trends driving market growth?
BFSI Segment is Expected to Hold Significant Share of the Market.
7. Are there any restraints impacting market growth?
High Implementation Cost of Explainable AI; Lack of Skilled and Expert AI Technicians.
8. Can you provide examples of recent developments in the market?
N/A
9. What pricing options are available for accessing the report?
Pricing options include single-user, multi-user, and enterprise licenses priced at USD 4750, USD 5250, and USD 8750 respectively.
10. Is the market size provided in terms of value or volume?
The market size is provided in terms of value, measured in Million.
11. Are there any specific market keywords associated with the report?
Yes, the market keyword associated with the report is "Explainable AI Market," which aids in identifying and referencing the specific market segment covered.
12. How do I determine which pricing option suits my needs best?
The pricing options vary based on user requirements and access needs. Individual users may opt for single-user licenses, while businesses requiring broader access may choose multi-user or enterprise licenses for cost-effective access to the report.
13. Are there any additional resources or data provided in the Explainable AI Market report?
While the report offers comprehensive insights, it's advisable to review the specific contents or supplementary materials provided to ascertain if additional resources or data are available.
14. How can I stay updated on further developments or reports in the Explainable AI Market?
To stay informed about further developments, trends, and reports in the Explainable AI Market, consider subscribing to industry newsletters, following relevant companies and organizations, or regularly checking reputable industry news sources and publications.
Methodology
Step 1 - Identification of Relevant Samples Size from Population Database


Step 2 - Approaches for Defining Global Market Size (Value, Volume* & Price*)

Note*: In applicable scenarios
Step 3 - Data Sources
Primary Research
- Web Analytics
- Survey Reports
- Research Institute
- Latest Research Reports
- Opinion Leaders
Secondary Research
- Annual Reports
- White Paper
- Latest Press Release
- Industry Association
- Paid Database
- Investor Presentations

Step 4 - Data Triangulation
Involves using different sources of information in order to increase the validity of a study
These sources are likely to be stakeholders in a program - participants, other researchers, program staff, other community members, and so on.
Then we put all data in single framework & apply various statistical tools to find out the dynamic on the market.
During the analysis stage, feedback from the stakeholder groups would be compared to determine areas of agreement as well as areas of divergence
