

Key Insights
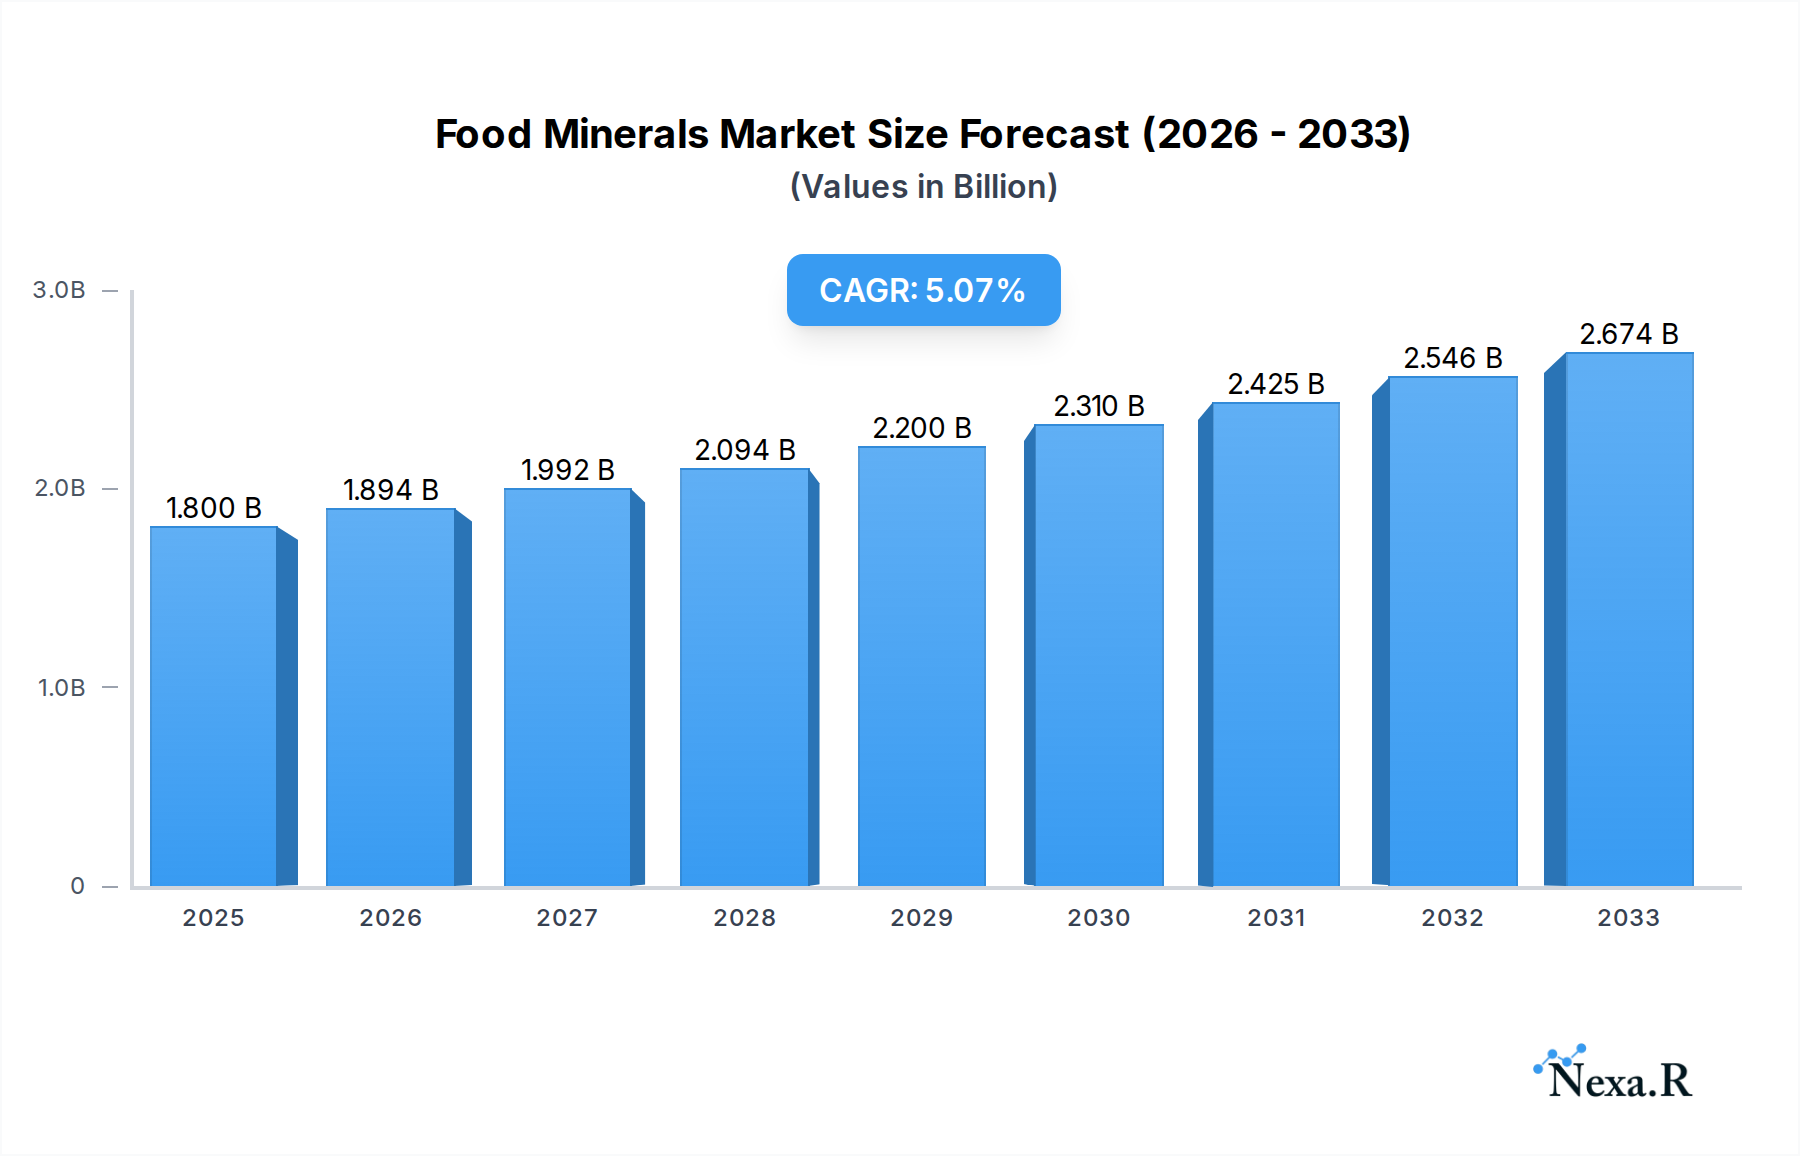
The global Food Minerals market is projected to experience significant growth, reaching an estimated USD 1.7 billion in 2023 and expanding at a robust Compound Annual Growth Rate (CAGR) of 5.2% from 2025 through 2033. This expansion is fueled by increasing consumer awareness regarding the health benefits of mineral supplementation and a growing demand for fortified foods and dietary supplements. Key drivers include the rising prevalence of mineral deficiencies, the aging global population seeking to maintain bone health and overall vitality, and the burgeoning wellness industry that emphasizes preventive healthcare. Furthermore, evolving dietary habits, particularly in emerging economies, and the convenience offered by online retail channels are significantly contributing to market penetration. The market is also benefiting from advancements in food processing technologies that allow for effective fortification of various food products without compromising taste or texture.

Food Minerals Market Size (In Billion)
The market is segmented across diverse applications, with Supermarkets & Hypermarkets currently dominating distribution, followed by Convenience Stores and the rapidly growing Online Retailers segment. In terms of product type, Zinc and Calcium are expected to remain the leading mineral segments due to their critical roles in immune function, bone health, and various metabolic processes. However, the demand for Magnesium and Iron is also anticipated to surge, driven by their importance in energy production, muscle function, and combating anemia. Geographically, North America and Europe are established markets, while the Asia Pacific region is emerging as a high-growth area due to increasing disposable incomes, a burgeoning middle class, and a greater adoption of health-conscious lifestyles. While the market is poised for expansion, potential restraints include stringent regulatory frameworks for dietary supplements and the fluctuating prices of raw materials.
Food Minerals Company Market Share
Food Minerals Market: Comprehensive Analysis & Forecast 2019-2033
This in-depth report provides a definitive analysis of the global Food Minerals market, offering critical insights into its dynamics, growth trajectory, and future potential. Covering the historical period from 2019 to 2024 and projecting growth through 2033, with a base and estimated year of 2025, this report is essential for stakeholders seeking to understand and capitalize on this burgeoning sector. We delve into parent and child market segments, analyzing key applications, product types, and regional dominance, while equipping you with actionable intelligence for strategic decision-making.
Food Minerals Market Dynamics & Structure
The global food minerals market exhibits a moderately concentrated structure, characterized by the presence of both large multinational corporations and specialized regional players. Technological innovation is a significant driver, with advancements in extraction, purification, and bioavailability enhancing product efficacy and appeal. Regulatory frameworks, particularly those concerning food fortification and supplement quality, play a crucial role in shaping market entry and product development. Competitive product substitutes, such as fortified foods and other dietary supplements, present a dynamic landscape influencing consumer choices. End-user demographics are increasingly health-conscious, with a growing demand for nutrient-rich products and preventative health solutions. Mergers and acquisitions (M&A) are a consistent trend, as companies seek to expand their product portfolios, geographical reach, and technological capabilities.
- Market Concentration: Moderate, with key players holding substantial market shares.
- Technological Innovation: Focus on bioavailability enhancement, novel delivery systems, and sustainable sourcing.
- Regulatory Frameworks: Stringent regulations for food safety, fortification, and dietary supplement claims are prevalent globally.
- Competitive Product Substitutes: Fortified foods, other dietary supplements, and functional beverages.
- End-User Demographics: Aging populations, health-conscious millennials and Gen Z, and individuals with specific dietary needs.
- M&A Trends: Strategic acquisitions to gain market share, acquire new technologies, and diversify product offerings. Estimated M&A deal volume in the historical period was approximately $1.2 billion.
Food Minerals Growth Trends & Insights
The global food minerals market has witnessed robust growth driven by a confluence of factors, including increasing health awareness, rising disposable incomes, and the growing prevalence of dietary deficiencies. The market size, valued at approximately $35 billion in 2024, is projected to expand at a Compound Annual Growth Rate (CAGR) of 6.8% during the forecast period of 2025-2033, reaching an estimated value of $65 billion by 2033. Adoption rates for mineral supplements and fortified foods are escalating, particularly in emerging economies where nutritional awareness is rapidly increasing. Technological disruptions, such as the development of more bioavailable mineral forms and advancements in encapsulation technologies, are further enhancing product efficacy and consumer acceptance. Consumer behavior shifts towards preventative healthcare and personalized nutrition are directly fueling demand for a wide array of food minerals. The growing emphasis on plant-based diets also presents an opportunity, as individuals seek to supplement essential minerals often found in animal products. The penetration of online retail channels has democratized access to a wider variety of food minerals, further accelerating market expansion.
Dominant Regions, Countries, or Segments in Food Minerals
North America currently stands as the dominant region in the global food minerals market, driven by its well-established healthcare infrastructure, high consumer spending power, and a deeply ingrained culture of health and wellness. The United States, in particular, accounts for a significant portion of this regional dominance due to a large, health-conscious population, extensive distribution networks, and strong regulatory support for dietary supplements. In terms of Application, Supermarkets & Hypermarkets are the leading channel, providing widespread accessibility and a broad product selection for consumers. However, Online Retailers are experiencing the most rapid growth, driven by convenience, competitive pricing, and the ability to offer a wider niche product selection that caters to specialized dietary needs. Among the product types, Zinc, Magnesium, and Calcium collectively represent the largest segment due to their essential roles in numerous bodily functions and widespread awareness of their benefits. Zinc's role in immune support, Magnesium's impact on muscle function and stress reduction, and Calcium's cruciality for bone health have propelled their demand. The "Others" category, which includes essential trace minerals like Iron, Selenium, and Iodine, is also experiencing significant growth, fueled by an increasing understanding of their unique health benefits and specific deficiencies. The growing trend towards fortified foods and beverages, often distributed through convenience stores as well, is also contributing to the overall market expansion.
- Dominant Region: North America, with the United States as a key contributor.
- Leading Application Segment: Supermarkets & Hypermarkets, with Online Retailers exhibiting the highest growth rate.
- Dominant Type Segments: Zinc, Magnesium, and Calcium are leading, with "Others" (including Iron, Selenium, Iodine) showing strong growth potential.
- Key Drivers of Dominance:
- North America: High disposable income, advanced healthcare systems, strong consumer awareness of health and nutrition.
- Supermarkets & Hypermarkets: Wide availability, convenience, and diverse product offerings.
- Online Retailers: Growing e-commerce penetration, convenience, competitive pricing, and access to niche products.
- Zinc, Magnesium, Calcium: Essential bodily functions, widespread health benefits, and established consumer knowledge.
- "Others" Segment: Increasing awareness of trace mineral importance, targeted health solutions, and fortified food trends.
Food Minerals Product Landscape
The food minerals product landscape is characterized by continuous innovation aimed at enhancing bioavailability and efficacy. Companies are focusing on developing chelated forms of minerals for improved absorption, such as bisglycinate forms of magnesium and zinc, and highly absorbable calcium citrate malate. Advanced encapsulation technologies are also being employed to protect sensitive minerals from degradation and ensure targeted delivery within the digestive system. Applications span across dietary supplements, fortified foods and beverages, and functional foods, catering to a broad spectrum of consumer needs from general wellness to specific health concerns like immune support, bone health, and energy metabolism. Performance metrics increasingly emphasize scientific validation and clinical studies supporting the claimed benefits.
Key Drivers, Barriers & Challenges in Food Minerals
The food minerals industry is propelled by a confluence of key drivers. Technological advancements in absorption and delivery systems are enhancing product efficacy. Growing global health awareness and the increasing prevalence of lifestyle diseases are driving demand for preventative healthcare solutions. The rising aging population, coupled with a greater understanding of age-related nutritional needs, further fuels market growth. Government initiatives promoting fortification of staple foods also play a crucial role.
However, the market faces several barriers and challenges. Stringent and evolving regulatory landscapes across different regions can impede market entry and product development. High manufacturing costs associated with premium, bioavailable forms of minerals can limit affordability for some consumer segments. Intense competition from established brands and emerging players, as well as the availability of fortified foods as substitutes, exert constant pressure on market players. Supply chain disruptions, particularly for specialized raw materials, can impact production and cost.
Emerging Opportunities in Food Minerals
Emerging opportunities in the food minerals sector are primarily driven by evolving consumer preferences and untapped market segments. The increasing adoption of plant-based and vegan diets is creating a demand for mineral supplements that address potential deficiencies, such as iron and vitamin B12, which are naturally less abundant in these diets. Personalized nutrition, enabled by advancements in genetic testing and AI, presents a significant opportunity for tailored mineral formulations addressing individual needs. The functional food and beverage sector continues to expand, with opportunities for innovative product development incorporating specific minerals for targeted health benefits, such as stress relief or cognitive enhancement. Emerging economies with rising disposable incomes and growing health consciousness represent a significant untapped market potential.
Growth Accelerators in the Food Minerals Industry
Several catalysts are accelerating long-term growth in the food minerals industry. Technological breakthroughs in nanotechnology for enhanced mineral delivery and absorption are poised to revolutionize product efficacy. Strategic partnerships between ingredient suppliers, supplement manufacturers, and food and beverage companies are fostering innovation and expanding market reach. Furthermore, market expansion strategies focusing on emerging economies, coupled with targeted marketing campaigns emphasizing the preventative health benefits of essential minerals, are driving sustained growth. The growing trend of ingredient transparency and traceability is also becoming a key differentiator, building consumer trust and loyalty.
Key Players Shaping the Food Minerals Market
- Bee Health
- Geri-Care Pharmaceuticals
- Youngevity
- Novartis
- Bayer
- LifeExtension
- Rainbow Light
- Pharmaca
- Thorne Research
- Solgar
- Bluebonnet Nutrition
Notable Milestones in Food Minerals Sector
- 2019: Increased focus on immune-boosting minerals like Zinc and Vitamin D following global health concerns.
- 2020: Growth in online sales of dietary supplements, including food minerals, due to lockdowns and convenience.
- 2021: Advancements in bioavailability research, leading to the development of more absorbable mineral forms.
- 2022: Growing consumer demand for clean-label and plant-based mineral supplements.
- 2023: Increased investment in R&D for personalized nutrition solutions incorporating specific mineral blends.
- 2024 (Q1-Q2): Expansion of fortified functional beverages into mainstream markets.
In-Depth Food Minerals Market Outlook
The future of the food minerals market is exceptionally promising, driven by persistent growth accelerators such as ongoing technological innovations, increasing health consciousness across all age groups, and the burgeoning demand for personalized nutrition solutions. Strategic partnerships are expected to deepen, fostering the development of novel delivery systems and expanding the reach of essential mineral products. Market expansion into emerging economies, coupled with effective consumer education campaigns highlighting the preventative health benefits of minerals, will be pivotal for sustained growth. The industry is poised for significant expansion, offering substantial opportunities for stakeholders willing to adapt to evolving consumer needs and embrace innovative approaches to nutrient delivery.
Food Minerals Segmentation
-
1. Application
- 1.1. Supermarkets & Hypermarkets
- 1.2. Convenience Stores
- 1.3. Online Retailers
-
2. Type
- 2.1. Zinc
- 2.2. Magnesium
- 2.3. Calcium
- 2.4. Iron
- 2.5. Others
Food Minerals Segmentation By Geography
-
1. North America
- 1.1. United States
- 1.2. Canada
- 1.3. Mexico
-
2. South America
- 2.1. Brazil
- 2.2. Argentina
- 2.3. Rest of South America
-
3. Europe
- 3.1. United Kingdom
- 3.2. Germany
- 3.3. France
- 3.4. Italy
- 3.5. Spain
- 3.6. Russia
- 3.7. Benelux
- 3.8. Nordics
- 3.9. Rest of Europe
-
4. Middle East & Africa
- 4.1. Turkey
- 4.2. Israel
- 4.3. GCC
- 4.4. North Africa
- 4.5. South Africa
- 4.6. Rest of Middle East & Africa
-
5. Asia Pacific
- 5.1. China
- 5.2. India
- 5.3. Japan
- 5.4. South Korea
- 5.5. ASEAN
- 5.6. Oceania
- 5.7. Rest of Asia Pacific
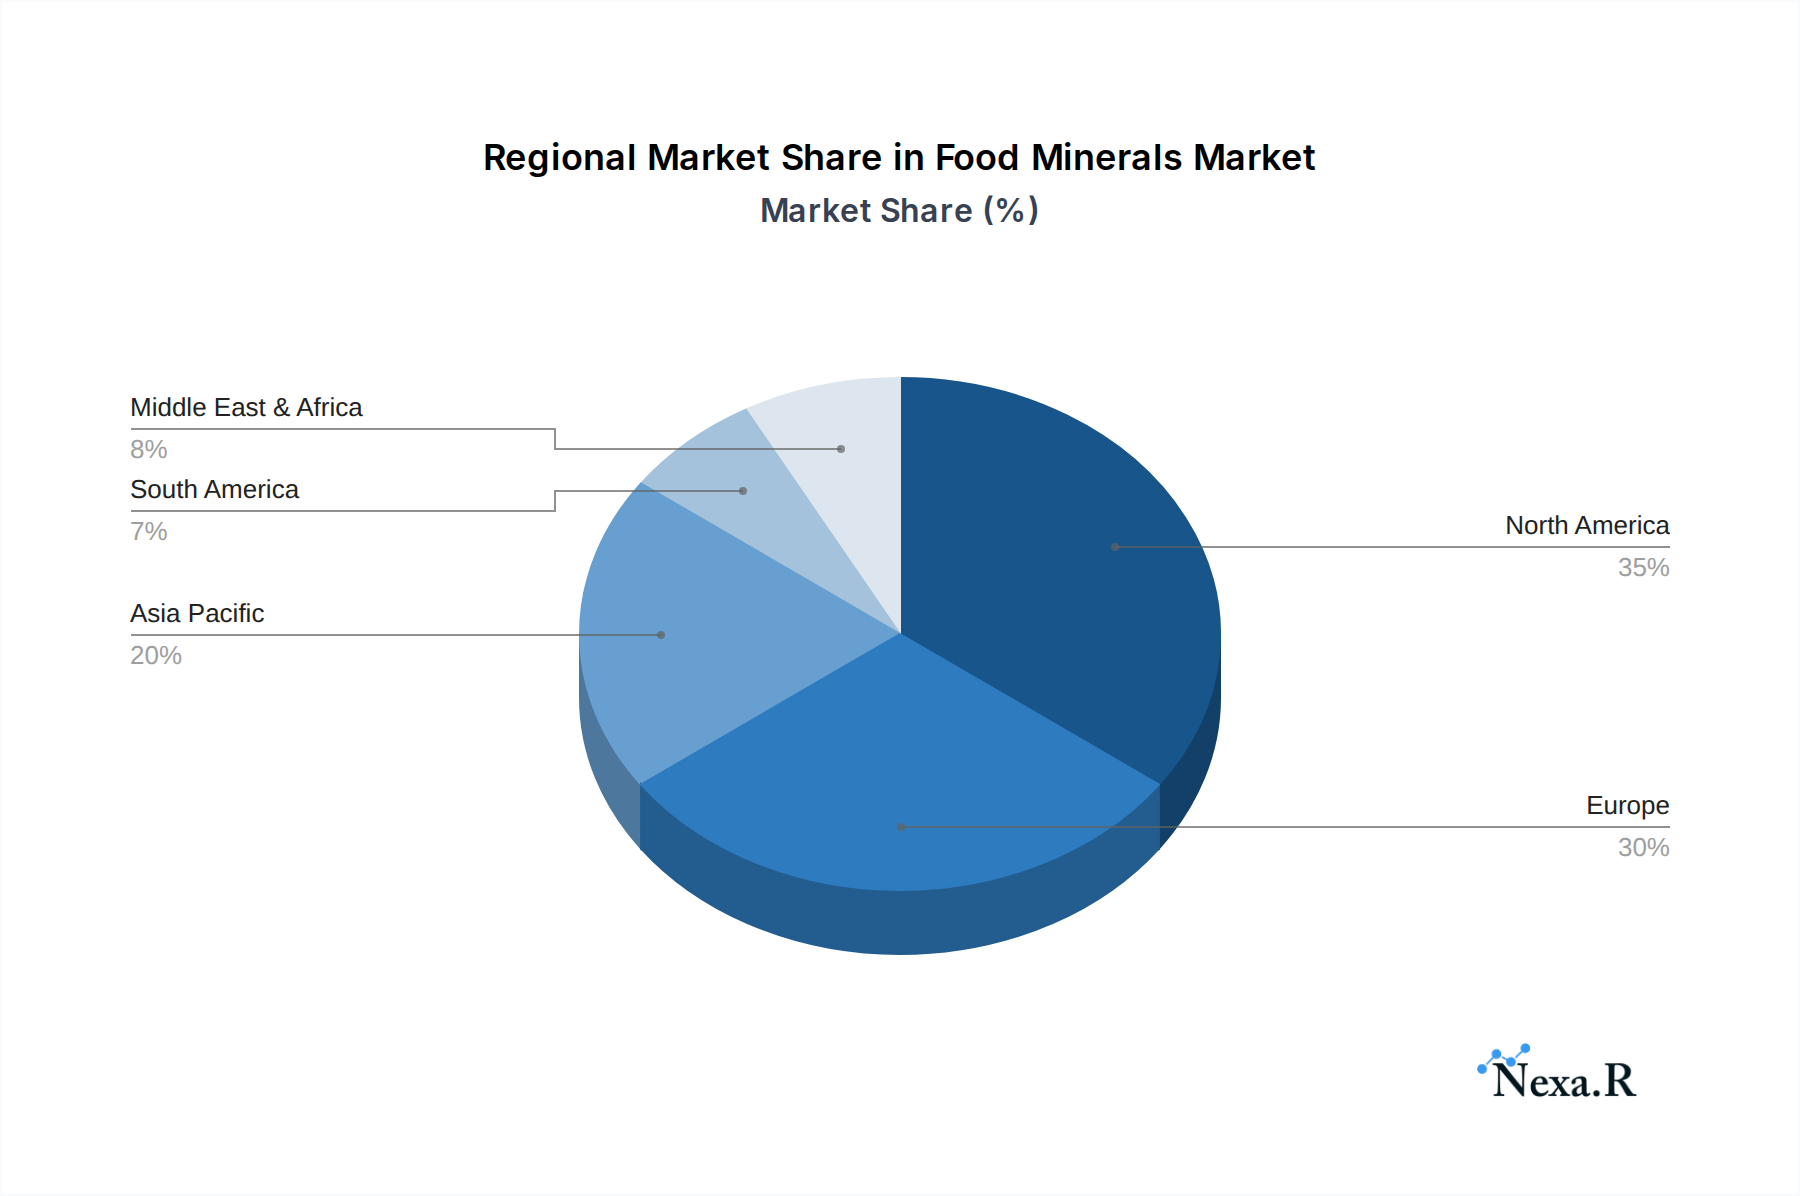
Food Minerals Regional Market Share
Geographic Coverage of Food Minerals
Food Minerals REPORT HIGHLIGHTS
| Aspects | Details |
|---|---|
| Study Period | 2020-2034 |
| Base Year | 2025 |
| Estimated Year | 2026 |
| Forecast Period | 2026-2034 |
| Historical Period | 2020-2025 |
| Growth Rate | CAGR of 5.2% from 2020-2034 |
| Segmentation |
|
Table of Contents
- 1. Introduction
- 1.1. Research Scope
- 1.2. Market Segmentation
- 1.3. Research Methodology
- 1.4. Definitions and Assumptions
- 2. Executive Summary
- 2.1. Introduction
- 3. Market Dynamics
- 3.1. Introduction
- 3.2. Market Drivers
- 3.3. Market Restrains
- 3.4. Market Trends
- 4. Market Factor Analysis
- 4.1. Porters Five Forces
- 4.2. Supply/Value Chain
- 4.3. PESTEL analysis
- 4.4. Market Entropy
- 4.5. Patent/Trademark Analysis
- 5. Global Food Minerals Analysis, Insights and Forecast, 2020-2032
- 5.1. Market Analysis, Insights and Forecast - by Application
- 5.1.1. Supermarkets & Hypermarkets
- 5.1.2. Convenience Stores
- 5.1.3. Online Retailers
- 5.2. Market Analysis, Insights and Forecast - by Type
- 5.2.1. Zinc
- 5.2.2. Magnesium
- 5.2.3. Calcium
- 5.2.4. Iron
- 5.2.5. Others
- 5.3. Market Analysis, Insights and Forecast - by Region
- 5.3.1. North America
- 5.3.2. South America
- 5.3.3. Europe
- 5.3.4. Middle East & Africa
- 5.3.5. Asia Pacific
- 5.1. Market Analysis, Insights and Forecast - by Application
- 6. North America Food Minerals Analysis, Insights and Forecast, 2020-2032
- 6.1. Market Analysis, Insights and Forecast - by Application
- 6.1.1. Supermarkets & Hypermarkets
- 6.1.2. Convenience Stores
- 6.1.3. Online Retailers
- 6.2. Market Analysis, Insights and Forecast - by Type
- 6.2.1. Zinc
- 6.2.2. Magnesium
- 6.2.3. Calcium
- 6.2.4. Iron
- 6.2.5. Others
- 6.1. Market Analysis, Insights and Forecast - by Application
- 7. South America Food Minerals Analysis, Insights and Forecast, 2020-2032
- 7.1. Market Analysis, Insights and Forecast - by Application
- 7.1.1. Supermarkets & Hypermarkets
- 7.1.2. Convenience Stores
- 7.1.3. Online Retailers
- 7.2. Market Analysis, Insights and Forecast - by Type
- 7.2.1. Zinc
- 7.2.2. Magnesium
- 7.2.3. Calcium
- 7.2.4. Iron
- 7.2.5. Others
- 7.1. Market Analysis, Insights and Forecast - by Application
- 8. Europe Food Minerals Analysis, Insights and Forecast, 2020-2032
- 8.1. Market Analysis, Insights and Forecast - by Application
- 8.1.1. Supermarkets & Hypermarkets
- 8.1.2. Convenience Stores
- 8.1.3. Online Retailers
- 8.2. Market Analysis, Insights and Forecast - by Type
- 8.2.1. Zinc
- 8.2.2. Magnesium
- 8.2.3. Calcium
- 8.2.4. Iron
- 8.2.5. Others
- 8.1. Market Analysis, Insights and Forecast - by Application
- 9. Middle East & Africa Food Minerals Analysis, Insights and Forecast, 2020-2032
- 9.1. Market Analysis, Insights and Forecast - by Application
- 9.1.1. Supermarkets & Hypermarkets
- 9.1.2. Convenience Stores
- 9.1.3. Online Retailers
- 9.2. Market Analysis, Insights and Forecast - by Type
- 9.2.1. Zinc
- 9.2.2. Magnesium
- 9.2.3. Calcium
- 9.2.4. Iron
- 9.2.5. Others
- 9.1. Market Analysis, Insights and Forecast - by Application
- 10. Asia Pacific Food Minerals Analysis, Insights and Forecast, 2020-2032
- 10.1. Market Analysis, Insights and Forecast - by Application
- 10.1.1. Supermarkets & Hypermarkets
- 10.1.2. Convenience Stores
- 10.1.3. Online Retailers
- 10.2. Market Analysis, Insights and Forecast - by Type
- 10.2.1. Zinc
- 10.2.2. Magnesium
- 10.2.3. Calcium
- 10.2.4. Iron
- 10.2.5. Others
- 10.1. Market Analysis, Insights and Forecast - by Application
- 11. Competitive Analysis
- 11.1. Global Market Share Analysis 2025
- 11.2. Company Profiles
- 11.2.1 Bee Health
- 11.2.1.1. Overview
- 11.2.1.2. Products
- 11.2.1.3. SWOT Analysis
- 11.2.1.4. Recent Developments
- 11.2.1.5. Financials (Based on Availability)
- 11.2.2 Geri-Care Pharmaceuticals
- 11.2.2.1. Overview
- 11.2.2.2. Products
- 11.2.2.3. SWOT Analysis
- 11.2.2.4. Recent Developments
- 11.2.2.5. Financials (Based on Availability)
- 11.2.3 Youngevity
- 11.2.3.1. Overview
- 11.2.3.2. Products
- 11.2.3.3. SWOT Analysis
- 11.2.3.4. Recent Developments
- 11.2.3.5. Financials (Based on Availability)
- 11.2.4 Novartis
- 11.2.4.1. Overview
- 11.2.4.2. Products
- 11.2.4.3. SWOT Analysis
- 11.2.4.4. Recent Developments
- 11.2.4.5. Financials (Based on Availability)
- 11.2.5 Bayer
- 11.2.5.1. Overview
- 11.2.5.2. Products
- 11.2.5.3. SWOT Analysis
- 11.2.5.4. Recent Developments
- 11.2.5.5. Financials (Based on Availability)
- 11.2.6 LifeExtension
- 11.2.6.1. Overview
- 11.2.6.2. Products
- 11.2.6.3. SWOT Analysis
- 11.2.6.4. Recent Developments
- 11.2.6.5. Financials (Based on Availability)
- 11.2.7 Rainbow Light
- 11.2.7.1. Overview
- 11.2.7.2. Products
- 11.2.7.3. SWOT Analysis
- 11.2.7.4. Recent Developments
- 11.2.7.5. Financials (Based on Availability)
- 11.2.8 Pharmaca
- 11.2.8.1. Overview
- 11.2.8.2. Products
- 11.2.8.3. SWOT Analysis
- 11.2.8.4. Recent Developments
- 11.2.8.5. Financials (Based on Availability)
- 11.2.9 Thorne Research
- 11.2.9.1. Overview
- 11.2.9.2. Products
- 11.2.9.3. SWOT Analysis
- 11.2.9.4. Recent Developments
- 11.2.9.5. Financials (Based on Availability)
- 11.2.10 Solgar
- 11.2.10.1. Overview
- 11.2.10.2. Products
- 11.2.10.3. SWOT Analysis
- 11.2.10.4. Recent Developments
- 11.2.10.5. Financials (Based on Availability)
- 11.2.11 Bluebonnet Nutrition
- 11.2.11.1. Overview
- 11.2.11.2. Products
- 11.2.11.3. SWOT Analysis
- 11.2.11.4. Recent Developments
- 11.2.11.5. Financials (Based on Availability)
- 11.2.1 Bee Health
List of Figures
- Figure 1: Global Food Minerals Revenue Breakdown (undefined, %) by Region 2025 & 2033
- Figure 2: Global Food Minerals Volume Breakdown (K, %) by Region 2025 & 2033
- Figure 3: North America Food Minerals Revenue (undefined), by Application 2025 & 2033
- Figure 4: North America Food Minerals Volume (K), by Application 2025 & 2033
- Figure 5: North America Food Minerals Revenue Share (%), by Application 2025 & 2033
- Figure 6: North America Food Minerals Volume Share (%), by Application 2025 & 2033
- Figure 7: North America Food Minerals Revenue (undefined), by Type 2025 & 2033
- Figure 8: North America Food Minerals Volume (K), by Type 2025 & 2033
- Figure 9: North America Food Minerals Revenue Share (%), by Type 2025 & 2033
- Figure 10: North America Food Minerals Volume Share (%), by Type 2025 & 2033
- Figure 11: North America Food Minerals Revenue (undefined), by Country 2025 & 2033
- Figure 12: North America Food Minerals Volume (K), by Country 2025 & 2033
- Figure 13: North America Food Minerals Revenue Share (%), by Country 2025 & 2033
- Figure 14: North America Food Minerals Volume Share (%), by Country 2025 & 2033
- Figure 15: South America Food Minerals Revenue (undefined), by Application 2025 & 2033
- Figure 16: South America Food Minerals Volume (K), by Application 2025 & 2033
- Figure 17: South America Food Minerals Revenue Share (%), by Application 2025 & 2033
- Figure 18: South America Food Minerals Volume Share (%), by Application 2025 & 2033
- Figure 19: South America Food Minerals Revenue (undefined), by Type 2025 & 2033
- Figure 20: South America Food Minerals Volume (K), by Type 2025 & 2033
- Figure 21: South America Food Minerals Revenue Share (%), by Type 2025 & 2033
- Figure 22: South America Food Minerals Volume Share (%), by Type 2025 & 2033
- Figure 23: South America Food Minerals Revenue (undefined), by Country 2025 & 2033
- Figure 24: South America Food Minerals Volume (K), by Country 2025 & 2033
- Figure 25: South America Food Minerals Revenue Share (%), by Country 2025 & 2033
- Figure 26: South America Food Minerals Volume Share (%), by Country 2025 & 2033
- Figure 27: Europe Food Minerals Revenue (undefined), by Application 2025 & 2033
- Figure 28: Europe Food Minerals Volume (K), by Application 2025 & 2033
- Figure 29: Europe Food Minerals Revenue Share (%), by Application 2025 & 2033
- Figure 30: Europe Food Minerals Volume Share (%), by Application 2025 & 2033
- Figure 31: Europe Food Minerals Revenue (undefined), by Type 2025 & 2033
- Figure 32: Europe Food Minerals Volume (K), by Type 2025 & 2033
- Figure 33: Europe Food Minerals Revenue Share (%), by Type 2025 & 2033
- Figure 34: Europe Food Minerals Volume Share (%), by Type 2025 & 2033
- Figure 35: Europe Food Minerals Revenue (undefined), by Country 2025 & 2033
- Figure 36: Europe Food Minerals Volume (K), by Country 2025 & 2033
- Figure 37: Europe Food Minerals Revenue Share (%), by Country 2025 & 2033
- Figure 38: Europe Food Minerals Volume Share (%), by Country 2025 & 2033
- Figure 39: Middle East & Africa Food Minerals Revenue (undefined), by Application 2025 & 2033
- Figure 40: Middle East & Africa Food Minerals Volume (K), by Application 2025 & 2033
- Figure 41: Middle East & Africa Food Minerals Revenue Share (%), by Application 2025 & 2033
- Figure 42: Middle East & Africa Food Minerals Volume Share (%), by Application 2025 & 2033
- Figure 43: Middle East & Africa Food Minerals Revenue (undefined), by Type 2025 & 2033
- Figure 44: Middle East & Africa Food Minerals Volume (K), by Type 2025 & 2033
- Figure 45: Middle East & Africa Food Minerals Revenue Share (%), by Type 2025 & 2033
- Figure 46: Middle East & Africa Food Minerals Volume Share (%), by Type 2025 & 2033
- Figure 47: Middle East & Africa Food Minerals Revenue (undefined), by Country 2025 & 2033
- Figure 48: Middle East & Africa Food Minerals Volume (K), by Country 2025 & 2033
- Figure 49: Middle East & Africa Food Minerals Revenue Share (%), by Country 2025 & 2033
- Figure 50: Middle East & Africa Food Minerals Volume Share (%), by Country 2025 & 2033
- Figure 51: Asia Pacific Food Minerals Revenue (undefined), by Application 2025 & 2033
- Figure 52: Asia Pacific Food Minerals Volume (K), by Application 2025 & 2033
- Figure 53: Asia Pacific Food Minerals Revenue Share (%), by Application 2025 & 2033
- Figure 54: Asia Pacific Food Minerals Volume Share (%), by Application 2025 & 2033
- Figure 55: Asia Pacific Food Minerals Revenue (undefined), by Type 2025 & 2033
- Figure 56: Asia Pacific Food Minerals Volume (K), by Type 2025 & 2033
- Figure 57: Asia Pacific Food Minerals Revenue Share (%), by Type 2025 & 2033
- Figure 58: Asia Pacific Food Minerals Volume Share (%), by Type 2025 & 2033
- Figure 59: Asia Pacific Food Minerals Revenue (undefined), by Country 2025 & 2033
- Figure 60: Asia Pacific Food Minerals Volume (K), by Country 2025 & 2033
- Figure 61: Asia Pacific Food Minerals Revenue Share (%), by Country 2025 & 2033
- Figure 62: Asia Pacific Food Minerals Volume Share (%), by Country 2025 & 2033
List of Tables
- Table 1: Global Food Minerals Revenue undefined Forecast, by Application 2020 & 2033
- Table 2: Global Food Minerals Volume K Forecast, by Application 2020 & 2033
- Table 3: Global Food Minerals Revenue undefined Forecast, by Type 2020 & 2033
- Table 4: Global Food Minerals Volume K Forecast, by Type 2020 & 2033
- Table 5: Global Food Minerals Revenue undefined Forecast, by Region 2020 & 2033
- Table 6: Global Food Minerals Volume K Forecast, by Region 2020 & 2033
- Table 7: Global Food Minerals Revenue undefined Forecast, by Application 2020 & 2033
- Table 8: Global Food Minerals Volume K Forecast, by Application 2020 & 2033
- Table 9: Global Food Minerals Revenue undefined Forecast, by Type 2020 & 2033
- Table 10: Global Food Minerals Volume K Forecast, by Type 2020 & 2033
- Table 11: Global Food Minerals Revenue undefined Forecast, by Country 2020 & 2033
- Table 12: Global Food Minerals Volume K Forecast, by Country 2020 & 2033
- Table 13: United States Food Minerals Revenue (undefined) Forecast, by Application 2020 & 2033
- Table 14: United States Food Minerals Volume (K) Forecast, by Application 2020 & 2033
- Table 15: Canada Food Minerals Revenue (undefined) Forecast, by Application 2020 & 2033
- Table 16: Canada Food Minerals Volume (K) Forecast, by Application 2020 & 2033
- Table 17: Mexico Food Minerals Revenue (undefined) Forecast, by Application 2020 & 2033
- Table 18: Mexico Food Minerals Volume (K) Forecast, by Application 2020 & 2033
- Table 19: Global Food Minerals Revenue undefined Forecast, by Application 2020 & 2033
- Table 20: Global Food Minerals Volume K Forecast, by Application 2020 & 2033
- Table 21: Global Food Minerals Revenue undefined Forecast, by Type 2020 & 2033
- Table 22: Global Food Minerals Volume K Forecast, by Type 2020 & 2033
- Table 23: Global Food Minerals Revenue undefined Forecast, by Country 2020 & 2033
- Table 24: Global Food Minerals Volume K Forecast, by Country 2020 & 2033
- Table 25: Brazil Food Minerals Revenue (undefined) Forecast, by Application 2020 & 2033
- Table 26: Brazil Food Minerals Volume (K) Forecast, by Application 2020 & 2033
- Table 27: Argentina Food Minerals Revenue (undefined) Forecast, by Application 2020 & 2033
- Table 28: Argentina Food Minerals Volume (K) Forecast, by Application 2020 & 2033
- Table 29: Rest of South America Food Minerals Revenue (undefined) Forecast, by Application 2020 & 2033
- Table 30: Rest of South America Food Minerals Volume (K) Forecast, by Application 2020 & 2033
- Table 31: Global Food Minerals Revenue undefined Forecast, by Application 2020 & 2033
- Table 32: Global Food Minerals Volume K Forecast, by Application 2020 & 2033
- Table 33: Global Food Minerals Revenue undefined Forecast, by Type 2020 & 2033
- Table 34: Global Food Minerals Volume K Forecast, by Type 2020 & 2033
- Table 35: Global Food Minerals Revenue undefined Forecast, by Country 2020 & 2033
- Table 36: Global Food Minerals Volume K Forecast, by Country 2020 & 2033
- Table 37: United Kingdom Food Minerals Revenue (undefined) Forecast, by Application 2020 & 2033
- Table 38: United Kingdom Food Minerals Volume (K) Forecast, by Application 2020 & 2033
- Table 39: Germany Food Minerals Revenue (undefined) Forecast, by Application 2020 & 2033
- Table 40: Germany Food Minerals Volume (K) Forecast, by Application 2020 & 2033
- Table 41: France Food Minerals Revenue (undefined) Forecast, by Application 2020 & 2033
- Table 42: France Food Minerals Volume (K) Forecast, by Application 2020 & 2033
- Table 43: Italy Food Minerals Revenue (undefined) Forecast, by Application 2020 & 2033
- Table 44: Italy Food Minerals Volume (K) Forecast, by Application 2020 & 2033
- Table 45: Spain Food Minerals Revenue (undefined) Forecast, by Application 2020 & 2033
- Table 46: Spain Food Minerals Volume (K) Forecast, by Application 2020 & 2033
- Table 47: Russia Food Minerals Revenue (undefined) Forecast, by Application 2020 & 2033
- Table 48: Russia Food Minerals Volume (K) Forecast, by Application 2020 & 2033
- Table 49: Benelux Food Minerals Revenue (undefined) Forecast, by Application 2020 & 2033
- Table 50: Benelux Food Minerals Volume (K) Forecast, by Application 2020 & 2033
- Table 51: Nordics Food Minerals Revenue (undefined) Forecast, by Application 2020 & 2033
- Table 52: Nordics Food Minerals Volume (K) Forecast, by Application 2020 & 2033
- Table 53: Rest of Europe Food Minerals Revenue (undefined) Forecast, by Application 2020 & 2033
- Table 54: Rest of Europe Food Minerals Volume (K) Forecast, by Application 2020 & 2033
- Table 55: Global Food Minerals Revenue undefined Forecast, by Application 2020 & 2033
- Table 56: Global Food Minerals Volume K Forecast, by Application 2020 & 2033
- Table 57: Global Food Minerals Revenue undefined Forecast, by Type 2020 & 2033
- Table 58: Global Food Minerals Volume K Forecast, by Type 2020 & 2033
- Table 59: Global Food Minerals Revenue undefined Forecast, by Country 2020 & 2033
- Table 60: Global Food Minerals Volume K Forecast, by Country 2020 & 2033
- Table 61: Turkey Food Minerals Revenue (undefined) Forecast, by Application 2020 & 2033
- Table 62: Turkey Food Minerals Volume (K) Forecast, by Application 2020 & 2033
- Table 63: Israel Food Minerals Revenue (undefined) Forecast, by Application 2020 & 2033
- Table 64: Israel Food Minerals Volume (K) Forecast, by Application 2020 & 2033
- Table 65: GCC Food Minerals Revenue (undefined) Forecast, by Application 2020 & 2033
- Table 66: GCC Food Minerals Volume (K) Forecast, by Application 2020 & 2033
- Table 67: North Africa Food Minerals Revenue (undefined) Forecast, by Application 2020 & 2033
- Table 68: North Africa Food Minerals Volume (K) Forecast, by Application 2020 & 2033
- Table 69: South Africa Food Minerals Revenue (undefined) Forecast, by Application 2020 & 2033
- Table 70: South Africa Food Minerals Volume (K) Forecast, by Application 2020 & 2033
- Table 71: Rest of Middle East & Africa Food Minerals Revenue (undefined) Forecast, by Application 2020 & 2033
- Table 72: Rest of Middle East & Africa Food Minerals Volume (K) Forecast, by Application 2020 & 2033
- Table 73: Global Food Minerals Revenue undefined Forecast, by Application 2020 & 2033
- Table 74: Global Food Minerals Volume K Forecast, by Application 2020 & 2033
- Table 75: Global Food Minerals Revenue undefined Forecast, by Type 2020 & 2033
- Table 76: Global Food Minerals Volume K Forecast, by Type 2020 & 2033
- Table 77: Global Food Minerals Revenue undefined Forecast, by Country 2020 & 2033
- Table 78: Global Food Minerals Volume K Forecast, by Country 2020 & 2033
- Table 79: China Food Minerals Revenue (undefined) Forecast, by Application 2020 & 2033
- Table 80: China Food Minerals Volume (K) Forecast, by Application 2020 & 2033
- Table 81: India Food Minerals Revenue (undefined) Forecast, by Application 2020 & 2033
- Table 82: India Food Minerals Volume (K) Forecast, by Application 2020 & 2033
- Table 83: Japan Food Minerals Revenue (undefined) Forecast, by Application 2020 & 2033
- Table 84: Japan Food Minerals Volume (K) Forecast, by Application 2020 & 2033
- Table 85: South Korea Food Minerals Revenue (undefined) Forecast, by Application 2020 & 2033
- Table 86: South Korea Food Minerals Volume (K) Forecast, by Application 2020 & 2033
- Table 87: ASEAN Food Minerals Revenue (undefined) Forecast, by Application 2020 & 2033
- Table 88: ASEAN Food Minerals Volume (K) Forecast, by Application 2020 & 2033
- Table 89: Oceania Food Minerals Revenue (undefined) Forecast, by Application 2020 & 2033
- Table 90: Oceania Food Minerals Volume (K) Forecast, by Application 2020 & 2033
- Table 91: Rest of Asia Pacific Food Minerals Revenue (undefined) Forecast, by Application 2020 & 2033
- Table 92: Rest of Asia Pacific Food Minerals Volume (K) Forecast, by Application 2020 & 2033
Frequently Asked Questions
1. What is the projected Compound Annual Growth Rate (CAGR) of the Food Minerals?
The projected CAGR is approximately 5.2%.
2. Which companies are prominent players in the Food Minerals?
Key companies in the market include Bee Health, Geri-Care Pharmaceuticals, Youngevity, Novartis, Bayer, LifeExtension, Rainbow Light, Pharmaca, Thorne Research, Solgar, Bluebonnet Nutrition.
3. What are the main segments of the Food Minerals?
The market segments include Application, Type.
4. Can you provide details about the market size?
The market size is estimated to be USD XXX N/A as of 2022.
5. What are some drivers contributing to market growth?
N/A
6. What are the notable trends driving market growth?
N/A
7. Are there any restraints impacting market growth?
N/A
8. Can you provide examples of recent developments in the market?
N/A
9. What pricing options are available for accessing the report?
Pricing options include single-user, multi-user, and enterprise licenses priced at USD 3950.00, USD 5925.00, and USD 7900.00 respectively.
10. Is the market size provided in terms of value or volume?
The market size is provided in terms of value, measured in N/A and volume, measured in K.
11. Are there any specific market keywords associated with the report?
Yes, the market keyword associated with the report is "Food Minerals," which aids in identifying and referencing the specific market segment covered.
12. How do I determine which pricing option suits my needs best?
The pricing options vary based on user requirements and access needs. Individual users may opt for single-user licenses, while businesses requiring broader access may choose multi-user or enterprise licenses for cost-effective access to the report.
13. Are there any additional resources or data provided in the Food Minerals report?
While the report offers comprehensive insights, it's advisable to review the specific contents or supplementary materials provided to ascertain if additional resources or data are available.
14. How can I stay updated on further developments or reports in the Food Minerals?
To stay informed about further developments, trends, and reports in the Food Minerals, consider subscribing to industry newsletters, following relevant companies and organizations, or regularly checking reputable industry news sources and publications.
Methodology
Step 1 - Identification of Relevant Samples Size from Population Database


Step 2 - Approaches for Defining Global Market Size (Value, Volume* & Price*)

Note*: In applicable scenarios
Step 3 - Data Sources
Primary Research
- Web Analytics
- Survey Reports
- Research Institute
- Latest Research Reports
- Opinion Leaders
Secondary Research
- Annual Reports
- White Paper
- Latest Press Release
- Industry Association
- Paid Database
- Investor Presentations

Step 4 - Data Triangulation
Involves using different sources of information in order to increase the validity of a study
These sources are likely to be stakeholders in a program - participants, other researchers, program staff, other community members, and so on.
Then we put all data in single framework & apply various statistical tools to find out the dynamic on the market.
During the analysis stage, feedback from the stakeholder groups would be compared to determine areas of agreement as well as areas of divergence