

Key Insights
The global chicken health market, valued at approximately $316.77 billion in 2025, is projected to grow at a compound annual growth rate (CAGR) of 2.8% from 2025 to 2033. This expansion is driven by increasing global demand for poultry products, necessitating effective disease prevention and control. Growing consumer emphasis on animal welfare and food safety further stimulates the adoption of advanced diagnostic tools and preventative treatments. Technological advancements in vaccine development, such as mRNA technology, and the increasing use of sophisticated diagnostic tests like PCR and ELISA are significant contributors. Key market constraints include the high cost of advanced solutions, stringent regulatory approval processes, and the potential for antimicrobial resistance. The market is segmented by product type (vaccines, parasiticides, anti-infectives, medical feed additives, others) and test type (ELISA, PCR, molecular diagnostics, others). Leading companies such as Elanco, Boehringer Ingelheim, IDEXX Laboratories, Merck, and Zoetis are key market players. North America and Asia-Pacific are experiencing robust growth due to substantial poultry production and investments in animal health infrastructure.
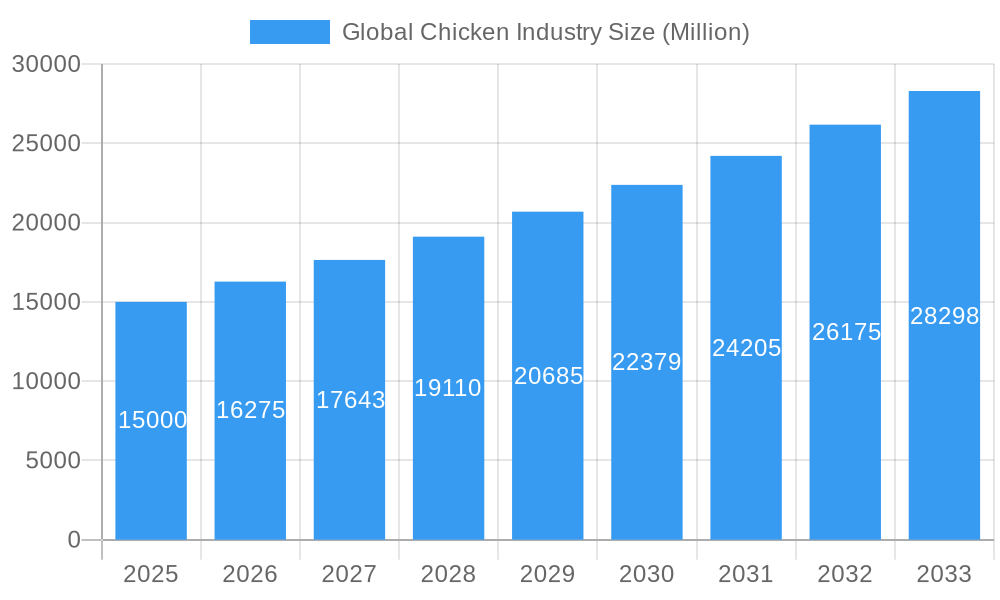
Global Chicken Industry Market Size (In Billion)
The forecast period (2025-2033) anticipates continued market expansion, driven by sustained global poultry consumption. Emerging markets in Asia and Africa offer significant growth opportunities, despite varying regulatory landscapes and infrastructure limitations. The persistent focus on disease prevention, biosecurity, and the integration of digital technologies within the poultry industry will shape future market dynamics. Further segmentation analysis, examining disease prevalence and product uptake by region, will offer deeper insights. Market consolidation among players is anticipated, with larger companies acquiring smaller ones to enhance market share and product portfolios.
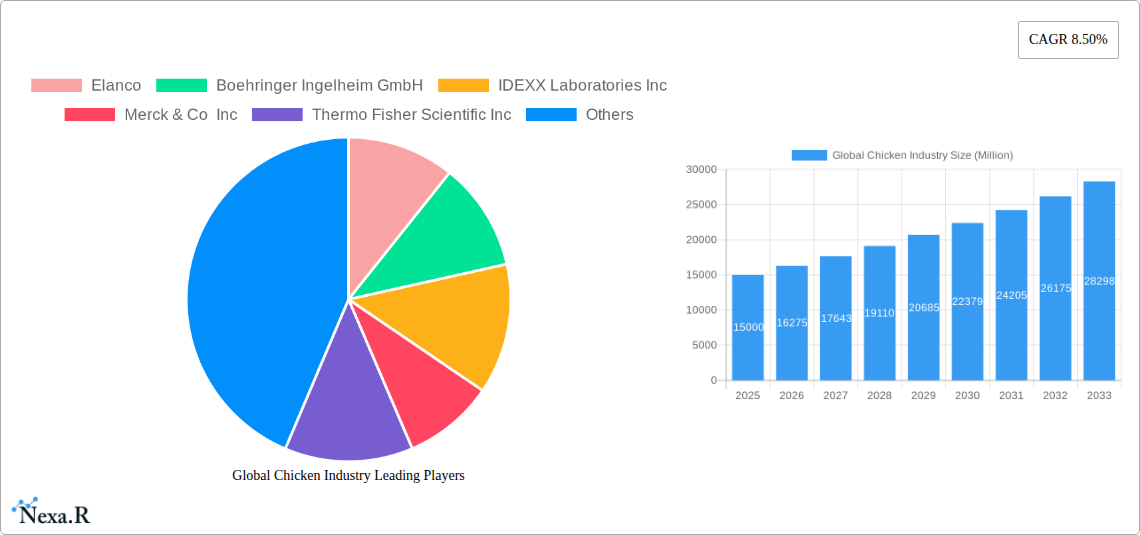
Global Chicken Industry Company Market Share
Global Chicken Industry Market Report: 2019-2033
This comprehensive report provides an in-depth analysis of the global chicken industry, encompassing market dynamics, growth trends, regional dominance, product landscape, key players, and future outlook. With a focus on parent and child markets, including vaccines, parasiticides, diagnostics, and feed additives, this report is essential for industry professionals, investors, and researchers seeking to navigate this dynamic sector. The report covers the period 2019-2033, with a base year of 2025 and a forecast period of 2025-2033. Market values are presented in Million units.
Study Period: 2019–2033 Base Year: 2025 Estimated Year: 2025 Forecast Period: 2025–2033 Historical Period: 2019–2024
Global Chicken Industry Market Dynamics & Structure
The global chicken industry is characterized by a moderately concentrated market structure, with a few large multinational corporations and numerous smaller regional players. Technological innovation, particularly in diagnostics and vaccine development, plays a crucial role in shaping market dynamics. Stringent regulatory frameworks, varying across countries, impact product approvals and market access. Competitive product substitutes, such as plant-based protein alternatives, exert pressure on traditional chicken production. The end-user demographic is primarily comprised of poultry farmers, integrators, and processors, with evolving consumer demands impacting production practices. Mergers and acquisitions (M&A) activity has been relatively high in recent years, driven by consolidation and expansion strategies.
- Market Concentration: The top 5 players hold an estimated xx% market share in 2025.
- Technological Innovation: Key drivers include advancements in disease diagnostics (ELISA, PCR), vaccine development (live attenuated vaccines), and automated poultry farming technologies.
- Regulatory Landscape: Variations in regulations across regions create complexities for market entry and product standardization. Compliance costs are significant.
- Competitive Substitutes: The growing popularity of plant-based alternatives presents a challenge to chicken industry growth. Market penetration of alternatives is estimated at xx% in 2025.
- End-User Demographics: The industry is dominated by large-scale commercial poultry operations, with increasing interest in sustainable and ethical farming practices.
- M&A Activity: An average of xx M&A deals per year have been observed in the period 2019-2024, predominantly focused on consolidating production and distribution networks.
Global Chicken Industry Growth Trends & Insights
The global chicken industry experienced steady growth during the historical period (2019-2024), with a CAGR of xx%. This growth is projected to continue during the forecast period (2025-2033), driven by factors such as increasing global population, rising per capita meat consumption (particularly in developing economies), and advancements in poultry farming technologies. Technological disruptions, such as precision farming techniques and AI-powered disease monitoring, are enhancing efficiency and productivity. Consumer behavior shifts towards healthier and more sustainably produced chicken also influence market trends. The market penetration of advanced diagnostic tests is projected to increase from xx% in 2025 to xx% by 2033.
Dominant Regions, Countries, or Segments in Global Chicken Industry
The Asia-Pacific region currently holds the largest market share in the global chicken industry, followed by North America and Europe. Within product types, vaccines and parasiticides represent the largest segments, with robust growth anticipated in both segments driven by disease prevalence and the need for preventative measures. In diagnostics, ELISA tests currently dominate the market, but PCR and molecular diagnostic tests are experiencing significant growth due to their higher sensitivity and specificity.
- By Product Type: Vaccines (xx Million units in 2025), Parasiticides (xx Million units in 2025), Anti-infectives (xx Million units in 2025), Medical Feed Additives (xx Million units in 2025), Other Product Types (xx Million units in 2025).
- By Test Type: ELISA (xx Million units in 2025), PCR (xx Million units in 2025), Molecular Diagnostic (xx Million units in 2025), Other Test Types (xx Million units in 2025).
- Key Drivers: Strong economic growth in developing economies, supportive government policies promoting poultry farming, and increasing investments in research and development are key factors driving market growth.
Global Chicken Industry Product Landscape
The chicken industry product landscape is diverse, ranging from traditional vaccines and parasiticides to advanced diagnostic tools and innovative feed additives. Recent innovations include the development of next-generation vaccines with improved efficacy and safety profiles, rapid diagnostic tests for faster disease detection, and precision feed formulations optimizing poultry health and productivity. These products are characterized by enhanced performance metrics such as improved disease prevention, reduced mortality rates, and improved feed conversion ratios. Unique selling propositions often focus on cost-effectiveness, ease of use, and improved animal welfare.
Key Drivers, Barriers & Challenges in Global Chicken Industry
Key Drivers: Increasing global population, rising demand for affordable protein, technological advancements improving efficiency and productivity, and supportive government policies fostering poultry farming.
Challenges: Disease outbreaks (avian influenza, Newcastle disease) pose significant threats. Supply chain disruptions (feed costs, transportation) impact profitability. Stricter environmental regulations increase operational costs. Intense competition among players and the rise of plant-based alternatives impact market share. Estimated economic losses due to disease outbreaks are in the range of xx Million units annually.
Emerging Opportunities in Global Chicken Industry
Untapped markets in developing regions, particularly in Africa and parts of Asia, offer significant growth potential. The increasing adoption of precision farming technologies opens up opportunities for data-driven decision-making in poultry production. Growing consumer demand for sustainably and ethically produced chicken presents opportunities for businesses adopting responsible farming practices.
Growth Accelerators in the Global Chicken Industry Industry
Technological breakthroughs in disease prevention and diagnostics, strategic partnerships between poultry producers and technology providers, and expansion into new markets are key growth accelerators. Investments in research and development of novel vaccines, feed additives, and diagnostic tools will significantly impact the industry's growth trajectory.
Key Players Shaping the Global Chicken Industry Market
- Elanco
- Boehringer Ingelheim GmbH
- IDEXX Laboratories Inc
- Merck & Co Inc
- Thermo Fisher Scientific Inc
- Megacor Diagnostik GmbH
- Provet Pharma Private Limited
- Bimeda Inc
- Ceva Sante Animale
- Indovax
- Zoetis Inc
- Hester Biosciences Limited
Notable Milestones in Global Chicken Industry Sector
- May 2022: Canada invests USD 3 million in projects to enhance emergency management and mitigate disease outbreaks in the poultry industry.
- April 2022: Ceva Animal Health launches CEVAC IBird vaccine for avian infectious bronchitis virus in India.
In-Depth Global Chicken Industry Market Outlook
The global chicken industry is poised for continued growth, driven by favorable demographic trends, technological advancements, and expanding market opportunities. Strategic partnerships, investments in research and development, and adoption of sustainable practices will be crucial for success in this competitive landscape. The future market potential is significant, with substantial opportunities for companies that can effectively address the challenges and capitalize on emerging trends.
Global Chicken Industry Segmentation
-
1. Product Type
- 1.1. Vaccines
- 1.2. Parasiticides
- 1.3. Anti Infectives
- 1.4. Medical Feed Additives
- 1.5. Other Product Types
-
2. Test Type
- 2.1. ELISA (Enzyme-Linked Immunosorbent Assay) Test
- 2.2. PCR (Polymerase Chain Reaction) Test
- 2.3. Molecular Diagnostic Test
- 2.4. Other Test Types
Global Chicken Industry Segmentation By Geography
-
1. North America
- 1.1. United States
- 1.2. Canada
- 1.3. Mexico
-
2. Europe
- 2.1. Germany
- 2.2. United Kingdom
- 2.3. France
- 2.4. Italy
- 2.5. Spain
- 2.6. Rest of Europe
-
3. Asia Pacific
- 3.1. China
- 3.2. Japan
- 3.3. India
- 3.4. Australia
- 3.5. South Korea
- 3.6. Rest of Asia Pacific
-
4. Middle East and Africa
- 4.1. GCC
- 4.2. South Africa
- 4.3. Rest of Middle East and Africa
-
5. South America
- 5.1. Brazil
- 5.2. Argentina
- 5.3. Rest of South America
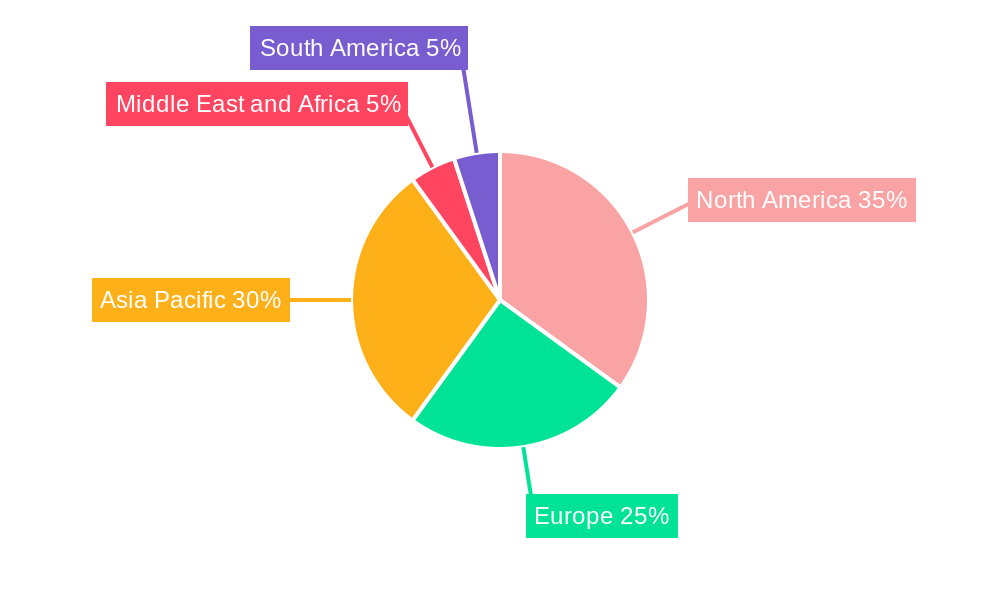
Global Chicken Industry Regional Market Share
Geographic Coverage of Global Chicken Industry
Global Chicken Industry REPORT HIGHLIGHTS
| Aspects | Details |
|---|---|
| Study Period | 2020-2034 |
| Base Year | 2025 |
| Estimated Year | 2026 |
| Forecast Period | 2026-2034 |
| Historical Period | 2020-2025 |
| Growth Rate | CAGR of 2.8% from 2020-2034 |
| Segmentation |
|
Table of Contents
- 1. Introduction
- 1.1. Research Scope
- 1.2. Market Segmentation
- 1.3. Research Objective
- 1.4. Definitions and Assumptions
- 2. Executive Summary
- 2.1. Market Snapshot
- 3. Market Dynamics
- 3.1. Market Drivers
- 3.2. Market Restrains
- 3.3. Market Trends
- 3.4. Market Opportunities
- 4. Market Factor Analysis
- 4.1. Porters Five Forces
- 4.1.1. Bargaining Power of Suppliers
- 4.1.2. Bargaining Power of Buyers
- 4.1.3. Threat of New Entrants
- 4.1.4. Threat of Substitutes
- 4.1.5. Competitive Rivalry
- 4.2. PESTEL analysis
- 4.3. BCG Analysis
- 4.3.1. Stars (High Growth, High Market Share)
- 4.3.2. Cash Cows (Low Growth, High Market Share)
- 4.3.3. Question Mark (High Growth, Low Market Share)
- 4.3.4. Dogs (Low Growth, Low Market Share)
- 4.4. Ansoff Matrix Analysis
- 4.5. Supply Chain Analysis
- 4.6. Regulatory Landscape
- 4.7. Current Market Potential and Opportunity Assessment (TAM–SAM–SOM Framework)
- 4.8. NRP Analyst Note
- 4.1. Porters Five Forces
- 5. Market Analysis, Insights and Forecast 2021-2033
- 5.1. Market Analysis, Insights and Forecast - by Product Type
- 5.1.1. Vaccines
- 5.1.2. Parasiticides
- 5.1.3. Anti Infectives
- 5.1.4. Medical Feed Additives
- 5.1.5. Other Product Types
- 5.2. Market Analysis, Insights and Forecast - by Test Type
- 5.2.1. ELISA (Enzyme-Linked Immunosorbent Assay) Test
- 5.2.2. PCR (Polymerase Chain Reaction) Test
- 5.2.3. Molecular Diagnostic Test
- 5.2.4. Other Test Types
- 5.3. Market Analysis, Insights and Forecast - by Region
- 5.3.1. North America
- 5.3.2. Europe
- 5.3.3. Asia Pacific
- 5.3.4. Middle East and Africa
- 5.3.5. South America
- 5.1. Market Analysis, Insights and Forecast - by Product Type
- 6. Global Chicken Industry Analysis, Insights and Forecast, 2021-2033
- 6.1. Market Analysis, Insights and Forecast - by Product Type
- 6.1.1. Vaccines
- 6.1.2. Parasiticides
- 6.1.3. Anti Infectives
- 6.1.4. Medical Feed Additives
- 6.1.5. Other Product Types
- 6.2. Market Analysis, Insights and Forecast - by Test Type
- 6.2.1. ELISA (Enzyme-Linked Immunosorbent Assay) Test
- 6.2.2. PCR (Polymerase Chain Reaction) Test
- 6.2.3. Molecular Diagnostic Test
- 6.2.4. Other Test Types
- 6.1. Market Analysis, Insights and Forecast - by Product Type
- 7. North America Global Chicken Industry Analysis, Insights and Forecast, 2020-2032
- 7.1. Market Analysis, Insights and Forecast - by Product Type
- 7.1.1. Vaccines
- 7.1.2. Parasiticides
- 7.1.3. Anti Infectives
- 7.1.4. Medical Feed Additives
- 7.1.5. Other Product Types
- 7.2. Market Analysis, Insights and Forecast - by Test Type
- 7.2.1. ELISA (Enzyme-Linked Immunosorbent Assay) Test
- 7.2.2. PCR (Polymerase Chain Reaction) Test
- 7.2.3. Molecular Diagnostic Test
- 7.2.4. Other Test Types
- 7.1. Market Analysis, Insights and Forecast - by Product Type
- 8. Europe Global Chicken Industry Analysis, Insights and Forecast, 2020-2032
- 8.1. Market Analysis, Insights and Forecast - by Product Type
- 8.1.1. Vaccines
- 8.1.2. Parasiticides
- 8.1.3. Anti Infectives
- 8.1.4. Medical Feed Additives
- 8.1.5. Other Product Types
- 8.2. Market Analysis, Insights and Forecast - by Test Type
- 8.2.1. ELISA (Enzyme-Linked Immunosorbent Assay) Test
- 8.2.2. PCR (Polymerase Chain Reaction) Test
- 8.2.3. Molecular Diagnostic Test
- 8.2.4. Other Test Types
- 8.1. Market Analysis, Insights and Forecast - by Product Type
- 9. Asia Pacific Global Chicken Industry Analysis, Insights and Forecast, 2020-2032
- 9.1. Market Analysis, Insights and Forecast - by Product Type
- 9.1.1. Vaccines
- 9.1.2. Parasiticides
- 9.1.3. Anti Infectives
- 9.1.4. Medical Feed Additives
- 9.1.5. Other Product Types
- 9.2. Market Analysis, Insights and Forecast - by Test Type
- 9.2.1. ELISA (Enzyme-Linked Immunosorbent Assay) Test
- 9.2.2. PCR (Polymerase Chain Reaction) Test
- 9.2.3. Molecular Diagnostic Test
- 9.2.4. Other Test Types
- 9.1. Market Analysis, Insights and Forecast - by Product Type
- 10. Middle East and Africa Global Chicken Industry Analysis, Insights and Forecast, 2020-2032
- 10.1. Market Analysis, Insights and Forecast - by Product Type
- 10.1.1. Vaccines
- 10.1.2. Parasiticides
- 10.1.3. Anti Infectives
- 10.1.4. Medical Feed Additives
- 10.1.5. Other Product Types
- 10.2. Market Analysis, Insights and Forecast - by Test Type
- 10.2.1. ELISA (Enzyme-Linked Immunosorbent Assay) Test
- 10.2.2. PCR (Polymerase Chain Reaction) Test
- 10.2.3. Molecular Diagnostic Test
- 10.2.4. Other Test Types
- 10.1. Market Analysis, Insights and Forecast - by Product Type
- 11. South America Global Chicken Industry Analysis, Insights and Forecast, 2020-2032
- 11.1. Market Analysis, Insights and Forecast - by Product Type
- 11.1.1. Vaccines
- 11.1.2. Parasiticides
- 11.1.3. Anti Infectives
- 11.1.4. Medical Feed Additives
- 11.1.5. Other Product Types
- 11.2. Market Analysis, Insights and Forecast - by Test Type
- 11.2.1. ELISA (Enzyme-Linked Immunosorbent Assay) Test
- 11.2.2. PCR (Polymerase Chain Reaction) Test
- 11.2.3. Molecular Diagnostic Test
- 11.2.4. Other Test Types
- 11.1. Market Analysis, Insights and Forecast - by Product Type
- 12. Competitive Analysis
- 12.1. Company Profiles
- 12.1.1 Elanco
- 12.1.1.1. Company Overview
- 12.1.1.2. Products
- 12.1.1.3. Company Financials
- 12.1.1.4. SWOT Analysis
- 12.1.2 Boehringer Ingelheim GmbH
- 12.1.2.1. Company Overview
- 12.1.2.2. Products
- 12.1.2.3. Company Financials
- 12.1.2.4. SWOT Analysis
- 12.1.3 IDEXX Laboratories Inc
- 12.1.3.1. Company Overview
- 12.1.3.2. Products
- 12.1.3.3. Company Financials
- 12.1.3.4. SWOT Analysis
- 12.1.4 Merck & Co Inc
- 12.1.4.1. Company Overview
- 12.1.4.2. Products
- 12.1.4.3. Company Financials
- 12.1.4.4. SWOT Analysis
- 12.1.5 Thermo Fisher Scientific Inc
- 12.1.5.1. Company Overview
- 12.1.5.2. Products
- 12.1.5.3. Company Financials
- 12.1.5.4. SWOT Analysis
- 12.1.6 Megacor Diagnostik GmbH
- 12.1.6.1. Company Overview
- 12.1.6.2. Products
- 12.1.6.3. Company Financials
- 12.1.6.4. SWOT Analysis
- 12.1.7 Provet Pharma Private Limited
- 12.1.7.1. Company Overview
- 12.1.7.2. Products
- 12.1.7.3. Company Financials
- 12.1.7.4. SWOT Analysis
- 12.1.8 Bimeda Inc
- 12.1.8.1. Company Overview
- 12.1.8.2. Products
- 12.1.8.3. Company Financials
- 12.1.8.4. SWOT Analysis
- 12.1.9 Ceva Sante Animale
- 12.1.9.1. Company Overview
- 12.1.9.2. Products
- 12.1.9.3. Company Financials
- 12.1.9.4. SWOT Analysis
- 12.1.10 Indovax
- 12.1.10.1. Company Overview
- 12.1.10.2. Products
- 12.1.10.3. Company Financials
- 12.1.10.4. SWOT Analysis
- 12.1.11 Zoetis Inc
- 12.1.11.1. Company Overview
- 12.1.11.2. Products
- 12.1.11.3. Company Financials
- 12.1.11.4. SWOT Analysis
- 12.1.12 Hester Biosciences Limited
- 12.1.12.1. Company Overview
- 12.1.12.2. Products
- 12.1.12.3. Company Financials
- 12.1.12.4. SWOT Analysis
- 12.1.1 Elanco
- 12.2. Market Entropy
- 12.2.1 Company's Key Areas Served
- 12.2.2 Recent Developments
- 12.3. Company Market Share Analysis 2025
- 12.3.1 Top 5 Companies Market Share Analysis
- 12.3.2 Top 3 Companies Market Share Analysis
- 12.4. List of Potential Customers
- 13. Research Methodology
List of Figures
- Figure 1: Global Global Chicken Industry Revenue Breakdown (billion, %) by Region 2025 & 2033
- Figure 2: Global Global Chicken Industry Volume Breakdown (K Unit, %) by Region 2025 & 2033
- Figure 3: North America Global Chicken Industry Revenue (billion), by Product Type 2025 & 2033
- Figure 4: North America Global Chicken Industry Volume (K Unit), by Product Type 2025 & 2033
- Figure 5: North America Global Chicken Industry Revenue Share (%), by Product Type 2025 & 2033
- Figure 6: North America Global Chicken Industry Volume Share (%), by Product Type 2025 & 2033
- Figure 7: North America Global Chicken Industry Revenue (billion), by Test Type 2025 & 2033
- Figure 8: North America Global Chicken Industry Volume (K Unit), by Test Type 2025 & 2033
- Figure 9: North America Global Chicken Industry Revenue Share (%), by Test Type 2025 & 2033
- Figure 10: North America Global Chicken Industry Volume Share (%), by Test Type 2025 & 2033
- Figure 11: North America Global Chicken Industry Revenue (billion), by Country 2025 & 2033
- Figure 12: North America Global Chicken Industry Volume (K Unit), by Country 2025 & 2033
- Figure 13: North America Global Chicken Industry Revenue Share (%), by Country 2025 & 2033
- Figure 14: North America Global Chicken Industry Volume Share (%), by Country 2025 & 2033
- Figure 15: Europe Global Chicken Industry Revenue (billion), by Product Type 2025 & 2033
- Figure 16: Europe Global Chicken Industry Volume (K Unit), by Product Type 2025 & 2033
- Figure 17: Europe Global Chicken Industry Revenue Share (%), by Product Type 2025 & 2033
- Figure 18: Europe Global Chicken Industry Volume Share (%), by Product Type 2025 & 2033
- Figure 19: Europe Global Chicken Industry Revenue (billion), by Test Type 2025 & 2033
- Figure 20: Europe Global Chicken Industry Volume (K Unit), by Test Type 2025 & 2033
- Figure 21: Europe Global Chicken Industry Revenue Share (%), by Test Type 2025 & 2033
- Figure 22: Europe Global Chicken Industry Volume Share (%), by Test Type 2025 & 2033
- Figure 23: Europe Global Chicken Industry Revenue (billion), by Country 2025 & 2033
- Figure 24: Europe Global Chicken Industry Volume (K Unit), by Country 2025 & 2033
- Figure 25: Europe Global Chicken Industry Revenue Share (%), by Country 2025 & 2033
- Figure 26: Europe Global Chicken Industry Volume Share (%), by Country 2025 & 2033
- Figure 27: Asia Pacific Global Chicken Industry Revenue (billion), by Product Type 2025 & 2033
- Figure 28: Asia Pacific Global Chicken Industry Volume (K Unit), by Product Type 2025 & 2033
- Figure 29: Asia Pacific Global Chicken Industry Revenue Share (%), by Product Type 2025 & 2033
- Figure 30: Asia Pacific Global Chicken Industry Volume Share (%), by Product Type 2025 & 2033
- Figure 31: Asia Pacific Global Chicken Industry Revenue (billion), by Test Type 2025 & 2033
- Figure 32: Asia Pacific Global Chicken Industry Volume (K Unit), by Test Type 2025 & 2033
- Figure 33: Asia Pacific Global Chicken Industry Revenue Share (%), by Test Type 2025 & 2033
- Figure 34: Asia Pacific Global Chicken Industry Volume Share (%), by Test Type 2025 & 2033
- Figure 35: Asia Pacific Global Chicken Industry Revenue (billion), by Country 2025 & 2033
- Figure 36: Asia Pacific Global Chicken Industry Volume (K Unit), by Country 2025 & 2033
- Figure 37: Asia Pacific Global Chicken Industry Revenue Share (%), by Country 2025 & 2033
- Figure 38: Asia Pacific Global Chicken Industry Volume Share (%), by Country 2025 & 2033
- Figure 39: Middle East and Africa Global Chicken Industry Revenue (billion), by Product Type 2025 & 2033
- Figure 40: Middle East and Africa Global Chicken Industry Volume (K Unit), by Product Type 2025 & 2033
- Figure 41: Middle East and Africa Global Chicken Industry Revenue Share (%), by Product Type 2025 & 2033
- Figure 42: Middle East and Africa Global Chicken Industry Volume Share (%), by Product Type 2025 & 2033
- Figure 43: Middle East and Africa Global Chicken Industry Revenue (billion), by Test Type 2025 & 2033
- Figure 44: Middle East and Africa Global Chicken Industry Volume (K Unit), by Test Type 2025 & 2033
- Figure 45: Middle East and Africa Global Chicken Industry Revenue Share (%), by Test Type 2025 & 2033
- Figure 46: Middle East and Africa Global Chicken Industry Volume Share (%), by Test Type 2025 & 2033
- Figure 47: Middle East and Africa Global Chicken Industry Revenue (billion), by Country 2025 & 2033
- Figure 48: Middle East and Africa Global Chicken Industry Volume (K Unit), by Country 2025 & 2033
- Figure 49: Middle East and Africa Global Chicken Industry Revenue Share (%), by Country 2025 & 2033
- Figure 50: Middle East and Africa Global Chicken Industry Volume Share (%), by Country 2025 & 2033
- Figure 51: South America Global Chicken Industry Revenue (billion), by Product Type 2025 & 2033
- Figure 52: South America Global Chicken Industry Volume (K Unit), by Product Type 2025 & 2033
- Figure 53: South America Global Chicken Industry Revenue Share (%), by Product Type 2025 & 2033
- Figure 54: South America Global Chicken Industry Volume Share (%), by Product Type 2025 & 2033
- Figure 55: South America Global Chicken Industry Revenue (billion), by Test Type 2025 & 2033
- Figure 56: South America Global Chicken Industry Volume (K Unit), by Test Type 2025 & 2033
- Figure 57: South America Global Chicken Industry Revenue Share (%), by Test Type 2025 & 2033
- Figure 58: South America Global Chicken Industry Volume Share (%), by Test Type 2025 & 2033
- Figure 59: South America Global Chicken Industry Revenue (billion), by Country 2025 & 2033
- Figure 60: South America Global Chicken Industry Volume (K Unit), by Country 2025 & 2033
- Figure 61: South America Global Chicken Industry Revenue Share (%), by Country 2025 & 2033
- Figure 62: South America Global Chicken Industry Volume Share (%), by Country 2025 & 2033
List of Tables
- Table 1: Global Chicken Industry Revenue billion Forecast, by Product Type 2020 & 2033
- Table 2: Global Chicken Industry Volume K Unit Forecast, by Product Type 2020 & 2033
- Table 3: Global Chicken Industry Revenue billion Forecast, by Test Type 2020 & 2033
- Table 4: Global Chicken Industry Volume K Unit Forecast, by Test Type 2020 & 2033
- Table 5: Global Chicken Industry Revenue billion Forecast, by Region 2020 & 2033
- Table 6: Global Chicken Industry Volume K Unit Forecast, by Region 2020 & 2033
- Table 7: Global Chicken Industry Revenue billion Forecast, by Product Type 2020 & 2033
- Table 8: Global Chicken Industry Volume K Unit Forecast, by Product Type 2020 & 2033
- Table 9: Global Chicken Industry Revenue billion Forecast, by Test Type 2020 & 2033
- Table 10: Global Chicken Industry Volume K Unit Forecast, by Test Type 2020 & 2033
- Table 11: Global Chicken Industry Revenue billion Forecast, by Country 2020 & 2033
- Table 12: Global Chicken Industry Volume K Unit Forecast, by Country 2020 & 2033
- Table 13: United States Global Chicken Industry Revenue (billion) Forecast, by Application 2020 & 2033
- Table 14: United States Global Chicken Industry Volume (K Unit) Forecast, by Application 2020 & 2033
- Table 15: Canada Global Chicken Industry Revenue (billion) Forecast, by Application 2020 & 2033
- Table 16: Canada Global Chicken Industry Volume (K Unit) Forecast, by Application 2020 & 2033
- Table 17: Mexico Global Chicken Industry Revenue (billion) Forecast, by Application 2020 & 2033
- Table 18: Mexico Global Chicken Industry Volume (K Unit) Forecast, by Application 2020 & 2033
- Table 19: Global Chicken Industry Revenue billion Forecast, by Product Type 2020 & 2033
- Table 20: Global Chicken Industry Volume K Unit Forecast, by Product Type 2020 & 2033
- Table 21: Global Chicken Industry Revenue billion Forecast, by Test Type 2020 & 2033
- Table 22: Global Chicken Industry Volume K Unit Forecast, by Test Type 2020 & 2033
- Table 23: Global Chicken Industry Revenue billion Forecast, by Country 2020 & 2033
- Table 24: Global Chicken Industry Volume K Unit Forecast, by Country 2020 & 2033
- Table 25: Germany Global Chicken Industry Revenue (billion) Forecast, by Application 2020 & 2033
- Table 26: Germany Global Chicken Industry Volume (K Unit) Forecast, by Application 2020 & 2033
- Table 27: United Kingdom Global Chicken Industry Revenue (billion) Forecast, by Application 2020 & 2033
- Table 28: United Kingdom Global Chicken Industry Volume (K Unit) Forecast, by Application 2020 & 2033
- Table 29: France Global Chicken Industry Revenue (billion) Forecast, by Application 2020 & 2033
- Table 30: France Global Chicken Industry Volume (K Unit) Forecast, by Application 2020 & 2033
- Table 31: Italy Global Chicken Industry Revenue (billion) Forecast, by Application 2020 & 2033
- Table 32: Italy Global Chicken Industry Volume (K Unit) Forecast, by Application 2020 & 2033
- Table 33: Spain Global Chicken Industry Revenue (billion) Forecast, by Application 2020 & 2033
- Table 34: Spain Global Chicken Industry Volume (K Unit) Forecast, by Application 2020 & 2033
- Table 35: Rest of Europe Global Chicken Industry Revenue (billion) Forecast, by Application 2020 & 2033
- Table 36: Rest of Europe Global Chicken Industry Volume (K Unit) Forecast, by Application 2020 & 2033
- Table 37: Global Chicken Industry Revenue billion Forecast, by Product Type 2020 & 2033
- Table 38: Global Chicken Industry Volume K Unit Forecast, by Product Type 2020 & 2033
- Table 39: Global Chicken Industry Revenue billion Forecast, by Test Type 2020 & 2033
- Table 40: Global Chicken Industry Volume K Unit Forecast, by Test Type 2020 & 2033
- Table 41: Global Chicken Industry Revenue billion Forecast, by Country 2020 & 2033
- Table 42: Global Chicken Industry Volume K Unit Forecast, by Country 2020 & 2033
- Table 43: China Global Chicken Industry Revenue (billion) Forecast, by Application 2020 & 2033
- Table 44: China Global Chicken Industry Volume (K Unit) Forecast, by Application 2020 & 2033
- Table 45: Japan Global Chicken Industry Revenue (billion) Forecast, by Application 2020 & 2033
- Table 46: Japan Global Chicken Industry Volume (K Unit) Forecast, by Application 2020 & 2033
- Table 47: India Global Chicken Industry Revenue (billion) Forecast, by Application 2020 & 2033
- Table 48: India Global Chicken Industry Volume (K Unit) Forecast, by Application 2020 & 2033
- Table 49: Australia Global Chicken Industry Revenue (billion) Forecast, by Application 2020 & 2033
- Table 50: Australia Global Chicken Industry Volume (K Unit) Forecast, by Application 2020 & 2033
- Table 51: South Korea Global Chicken Industry Revenue (billion) Forecast, by Application 2020 & 2033
- Table 52: South Korea Global Chicken Industry Volume (K Unit) Forecast, by Application 2020 & 2033
- Table 53: Rest of Asia Pacific Global Chicken Industry Revenue (billion) Forecast, by Application 2020 & 2033
- Table 54: Rest of Asia Pacific Global Chicken Industry Volume (K Unit) Forecast, by Application 2020 & 2033
- Table 55: Global Chicken Industry Revenue billion Forecast, by Product Type 2020 & 2033
- Table 56: Global Chicken Industry Volume K Unit Forecast, by Product Type 2020 & 2033
- Table 57: Global Chicken Industry Revenue billion Forecast, by Test Type 2020 & 2033
- Table 58: Global Chicken Industry Volume K Unit Forecast, by Test Type 2020 & 2033
- Table 59: Global Chicken Industry Revenue billion Forecast, by Country 2020 & 2033
- Table 60: Global Chicken Industry Volume K Unit Forecast, by Country 2020 & 2033
- Table 61: GCC Global Chicken Industry Revenue (billion) Forecast, by Application 2020 & 2033
- Table 62: GCC Global Chicken Industry Volume (K Unit) Forecast, by Application 2020 & 2033
- Table 63: South Africa Global Chicken Industry Revenue (billion) Forecast, by Application 2020 & 2033
- Table 64: South Africa Global Chicken Industry Volume (K Unit) Forecast, by Application 2020 & 2033
- Table 65: Rest of Middle East and Africa Global Chicken Industry Revenue (billion) Forecast, by Application 2020 & 2033
- Table 66: Rest of Middle East and Africa Global Chicken Industry Volume (K Unit) Forecast, by Application 2020 & 2033
- Table 67: Global Chicken Industry Revenue billion Forecast, by Product Type 2020 & 2033
- Table 68: Global Chicken Industry Volume K Unit Forecast, by Product Type 2020 & 2033
- Table 69: Global Chicken Industry Revenue billion Forecast, by Test Type 2020 & 2033
- Table 70: Global Chicken Industry Volume K Unit Forecast, by Test Type 2020 & 2033
- Table 71: Global Chicken Industry Revenue billion Forecast, by Country 2020 & 2033
- Table 72: Global Chicken Industry Volume K Unit Forecast, by Country 2020 & 2033
- Table 73: Brazil Global Chicken Industry Revenue (billion) Forecast, by Application 2020 & 2033
- Table 74: Brazil Global Chicken Industry Volume (K Unit) Forecast, by Application 2020 & 2033
- Table 75: Argentina Global Chicken Industry Revenue (billion) Forecast, by Application 2020 & 2033
- Table 76: Argentina Global Chicken Industry Volume (K Unit) Forecast, by Application 2020 & 2033
- Table 77: Rest of South America Global Chicken Industry Revenue (billion) Forecast, by Application 2020 & 2033
- Table 78: Rest of South America Global Chicken Industry Volume (K Unit) Forecast, by Application 2020 & 2033
Frequently Asked Questions
1. What is the projected Compound Annual Growth Rate (CAGR) of the Global Chicken Industry?
The projected CAGR is approximately 2.8%.
2. Which companies are prominent players in the Global Chicken Industry?
Key companies in the market include Elanco, Boehringer Ingelheim GmbH, IDEXX Laboratories Inc, Merck & Co Inc, Thermo Fisher Scientific Inc, Megacor Diagnostik GmbH, Provet Pharma Private Limited, Bimeda Inc , Ceva Sante Animale, Indovax, Zoetis Inc, Hester Biosciences Limited.
3. What are the main segments of the Global Chicken Industry?
The market segments include Product Type, Test Type.
4. Can you provide details about the market size?
The market size is estimated to be USD 316.77 billion as of 2022.
5. What are some drivers contributing to market growth?
Increasing Initiatives by Government and Animal Welfare Associations; Rising Occurrence of Zoonotic Diseases; Rise in Demand for Poultry-derived Food Products.
6. What are the notable trends driving market growth?
The Vaccines Segment is Expected to Show Better Growth Over the Forecast Period.
7. Are there any restraints impacting market growth?
Use of Counterfeit Medicines; Lack of Veterinarians and Shortage of Skilled Farm Workers.
8. Can you provide examples of recent developments in the market?
In May 2022, Canada invested over USD 3 million in two projects to enhance emergency management and develop risk assessments and strategies to mitigate disease outbreaks. This project will help enhance the emergency management capabilities of Canada's livestock and poultry industries to remain ready in the face of adverse events and a continually evolving disease landscape.
9. What pricing options are available for accessing the report?
Pricing options include single-user, multi-user, and enterprise licenses priced at USD 4750, USD 5250, and USD 8750 respectively.
10. Is the market size provided in terms of value or volume?
The market size is provided in terms of value, measured in billion and volume, measured in K Unit.
11. Are there any specific market keywords associated with the report?
Yes, the market keyword associated with the report is "Global Chicken Industry," which aids in identifying and referencing the specific market segment covered.
12. How do I determine which pricing option suits my needs best?
The pricing options vary based on user requirements and access needs. Individual users may opt for single-user licenses, while businesses requiring broader access may choose multi-user or enterprise licenses for cost-effective access to the report.
13. Are there any additional resources or data provided in the Global Chicken Industry report?
While the report offers comprehensive insights, it's advisable to review the specific contents or supplementary materials provided to ascertain if additional resources or data are available.
14. How can I stay updated on further developments or reports in the Global Chicken Industry?
To stay informed about further developments, trends, and reports in the Global Chicken Industry, consider subscribing to industry newsletters, following relevant companies and organizations, or regularly checking reputable industry news sources and publications.
Methodology
Step 1 - Identification of Relevant Samples Size from Population Database


Step 2 - Approaches for Defining Global Market Size (Value, Volume* & Price*)

Note*: In applicable scenarios
Step 3 - Data Sources
Primary Research
- Web Analytics
- Survey Reports
- Research Institute
- Latest Research Reports
- Opinion Leaders
Secondary Research
- Annual Reports
- White Paper
- Latest Press Release
- Industry Association
- Paid Database
- Investor Presentations

Step 4 - Data Triangulation
Involves using different sources of information in order to increase the validity of a study
These sources are likely to be stakeholders in a program - participants, other researchers, program staff, other community members, and so on.
Then we put all data in single framework & apply various statistical tools to find out the dynamic on the market.
During the analysis stage, feedback from the stakeholder groups would be compared to determine areas of agreement as well as areas of divergence