

Key Insights
The global enterprise augmented reality (AR) market is experiencing explosive growth, projected to reach a substantial size driven by increasing adoption across diverse sectors. A compound annual growth rate (CAGR) of 48.60% from 2019 to 2024 indicates a rapid expansion, fueled by several key factors. The convergence of advanced technologies like 5G, improved AR hardware, and sophisticated software solutions are lowering barriers to entry and enabling more sophisticated AR applications. Furthermore, the growing need for enhanced efficiency, improved worker training, and streamlined processes across industries like manufacturing, healthcare, and retail are significantly driving demand. The retail and e-commerce segments are leading the charge, leveraging AR for immersive shopping experiences and product visualization. However, the education (e-learning) and industrial sectors are also rapidly adopting AR for training and maintenance purposes, showcasing the technology's versatility.
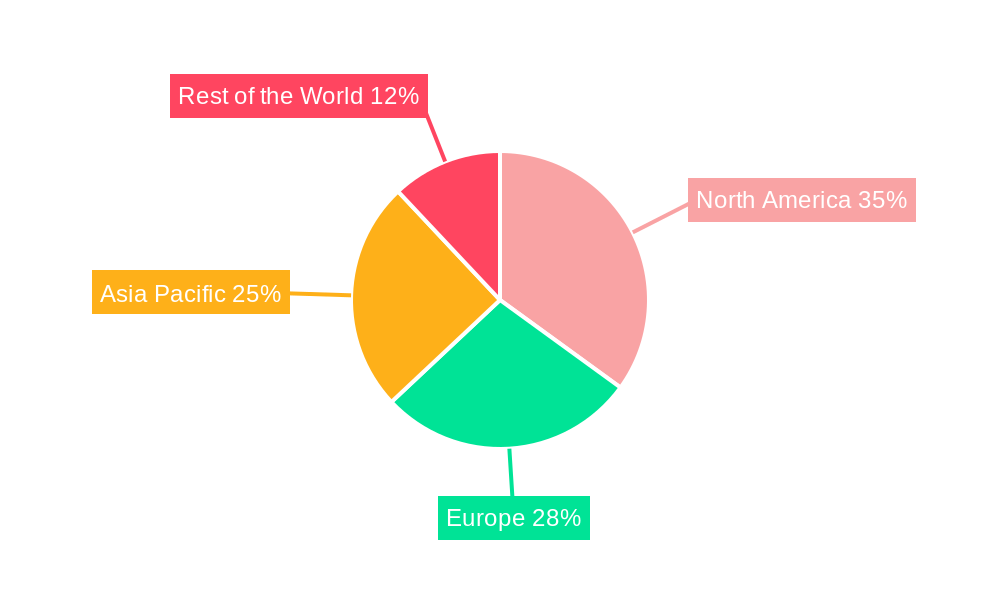
While the market faces challenges such as high initial investment costs and the need for robust infrastructure, these hurdles are being progressively overcome by technological advancements and the growing affordability of AR solutions. The market segmentation reveals strong performance across North America and Europe, driven by early adoption and technological maturity. However, the Asia-Pacific region is predicted to witness the most significant growth in the coming years, fueled by rapid technological development and expanding digital infrastructure. The presence of key players like PTC, Microsoft, and others, coupled with ongoing research and development, will propel further innovation and market expansion, leading to diverse applications of AR across various business functions and ultimately shaping a future of increased productivity and efficiency. We project continued robust growth throughout the forecast period (2025-2033).
Global Enterprise Augmented Reality Market: A Comprehensive Report (2019-2033)
This comprehensive report provides an in-depth analysis of the Global Enterprise Augmented Reality (AR) Market, encompassing market dynamics, growth trends, regional dominance, product landscape, key players, and future outlook. The study period spans from 2019 to 2033, with 2025 serving as the base and estimated year. The report segments the market by end-user, offering a granular view of the parent market and its various child markets. The total market value in 2025 is estimated at xx Million.
Global Enterprise Augmented Reality Market Dynamics & Structure
The Global Enterprise Augmented Reality market is characterized by moderate concentration, with key players vying for market share. Technological innovation, particularly in areas like 5G connectivity and improved AR hardware, is a significant growth driver. Regulatory frameworks, including data privacy regulations and safety standards for AR applications, are increasingly influential. Competitive substitutes, such as virtual reality (VR) and traditional training methods, pose challenges to AR adoption. The end-user demographics are expanding, with increased adoption across various industries. M&A activity in the sector remains relatively active, although deal volume has fluctuated in recent years.
- Market Concentration: Moderately concentrated, with top 5 players holding approximately xx% market share in 2025.
- Technological Innovation: Continuous advancements in AR hardware, software, and processing power are key drivers.
- Regulatory Landscape: Evolving data privacy and safety regulations are shaping market development.
- Competitive Substitutes: VR and traditional methods compete for market share.
- End-User Demographics: Diverse end-user sectors contribute to market growth, with particular strength in industrial and retail applications.
- M&A Activity: An estimated xx M&A deals occurred between 2019 and 2024, with a projected xx deals for 2025-2033. A significant portion of these were focused on acquiring smaller technology firms and strengthening product portfolios. Innovation barriers include high development costs and the need for specialized expertise.
Global Enterprise Augmented Reality Market Growth Trends & Insights
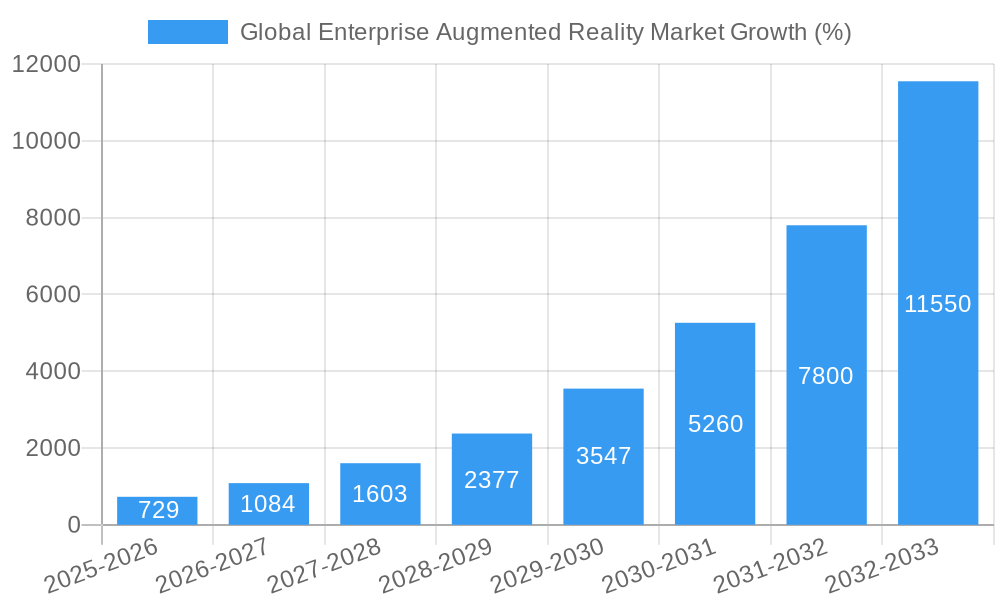
The Global Enterprise Augmented Reality market experienced significant growth between 2019 and 2024, with a CAGR of xx%. This growth is primarily driven by increasing adoption across diverse sectors, including industrial manufacturing, retail, and healthcare. Technological advancements, such as improved image recognition and processing capabilities, have facilitated wider application and greater user acceptance. The shift in consumer behavior toward immersive digital experiences further fuels market expansion. Market penetration remains relatively low, particularly in certain emerging markets, creating considerable potential for future growth. Disruptions caused by rapid technological development will alter adoption patterns as newer technologies become mainstream.
- Market Size Evolution: The market value grew from xx Million in 2019 to xx Million in 2024, expected to reach xx Million by 2033.
- Adoption Rates: Industrial applications show the highest adoption rates, followed by retail and e-commerce.
- Technological Disruptions: Advancements in 5G, AI, and cloud computing are accelerating market growth.
- Consumer Behavior Shifts: A growing preference for interactive and immersive digital experiences is driving demand.
Dominant Regions, Countries, or Segments in Global Enterprise Augmented Reality Market
North America currently holds the largest market share in the Global Enterprise Augmented Reality market, driven by significant investments in AR technology, a strong presence of key players, and robust technological infrastructure. The industrial sector, particularly in manufacturing and aerospace, demonstrates the highest adoption rate. However, Asia-Pacific is projected to show the fastest growth rate due to increasing government support for technology adoption, a burgeoning manufacturing sector, and a large consumer base.
- North America: Dominant market share due to strong technological advancement, established industry players, and high investment in AR technologies.
- Europe: Significant market growth, with strong adoption in sectors such as automotive and professional services.
- Asia-Pacific: Fastest-growing region, driven by increasing investment in AR technologies and expanding manufacturing sector.
- Other Regions: Latin America and the Middle East and Africa exhibit emerging market potential with incremental growth.
By End-user: The industrial segment leads in market share and is expected to maintain its dominance throughout the forecast period due to its potential for efficiency gains and safety improvements through AR applications. The retail and e-commerce segment shows promising growth potential due to the increasing popularity of AR-enhanced shopping experiences.
Global Enterprise Augmented Reality Market Product Landscape
The enterprise AR market encompasses a range of products, including AR headsets, smart glasses, software development kits (SDKs), and various applications tailored to specific industry needs. These solutions offer diverse functionalities such as remote assistance, training simulations, and data visualization. Technological advancements focus on enhanced spatial awareness, improved user interfaces, and seamless integration with existing enterprise systems. Unique selling propositions include improved operational efficiency, reduced training costs, and enhanced safety measures.
Key Drivers, Barriers & Challenges in Global Enterprise Augmented Reality Market
Key Drivers:
- Technological advancements in AR hardware and software.
- Increased adoption of AR in various industries for enhanced productivity and efficiency.
- Government initiatives and investments supporting AR development.
Key Barriers and Challenges:
- High initial investment costs associated with AR implementation.
- Concerns regarding data privacy and security.
- Limited technical expertise and skilled workforce for AR development and integration. The lack of skilled personnel has created a barrier to adoption, slowing the market’s potential growth by an estimated xx%.
Emerging Opportunities in Global Enterprise Augmented Reality Market
- Untapped markets in emerging economies present significant growth potential.
- Development of innovative AR applications for new industries like agriculture and healthcare.
- Expansion of AR applications beyond visual enhancement to encompass haptic feedback and other sensory experiences.
Growth Accelerators in the Global Enterprise Augmented Reality Market Industry
Strategic partnerships between technology companies and industry leaders are accelerating market growth, enabling the development and deployment of customized AR solutions. Technological breakthroughs, particularly in areas such as computer vision and AI, will fuel innovation and drive adoption. Continued expansion into untapped market segments and geographical areas further contributes to long-term growth.
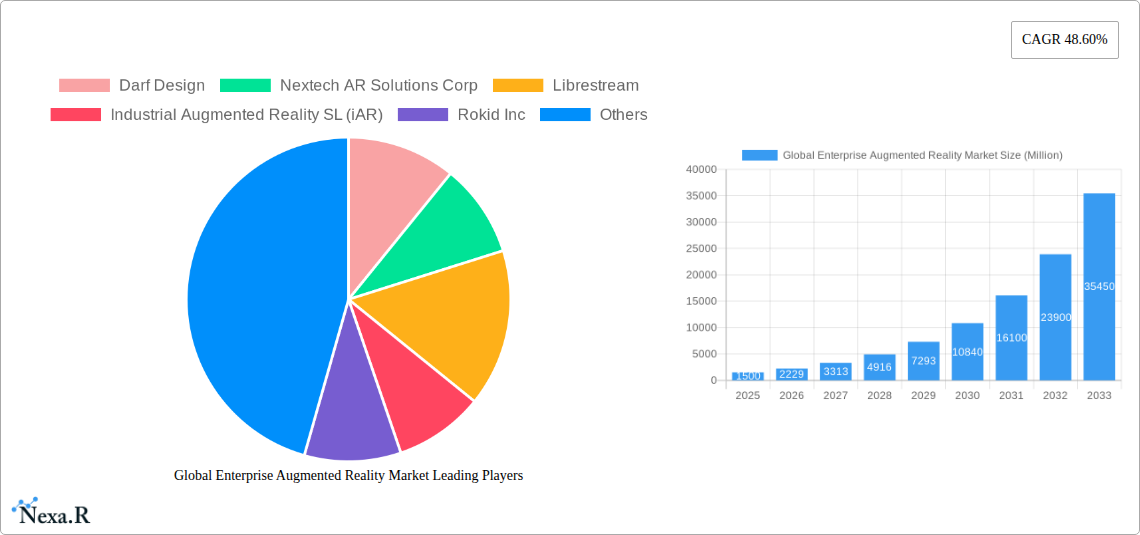
Key Players Shaping the Global Enterprise Augmented Reality Market Market
- Darf Design
- Nextech AR Solutions Corp
- Librestream
- Industrial Augmented Reality SL (iAR)
- Rokid Inc
- Dynabook Americas Inc
- Dalux
- Vuzix Corporation
- Epson America Inc (Seiko Epson Corporation)
- Plutomen Technologies Pvt Ltd
- Lenovo Corporation
- Atheer Inc
- ThirdEye
- Vuforia (PTC Inc)
Notable Milestones in Global Enterprise Augmented Reality Market Sector
- November 2021: Qualcomm and Lenovo partnered to launch new augmented reality applications using Snapdragon Spaces and ThinkReality A3 smart glasses. This collaboration significantly expanded the development ecosystem for AR applications.
- May 2022: ThirdEye launched a decentralized AR 3D social network, highlighting the growing potential of AR for social interaction and user-generated content. This innovative approach could redefine user engagement and data ownership within AR experiences.
In-Depth Global Enterprise Augmented Reality Market Market Outlook
The future of the Global Enterprise Augmented Reality market looks bright, with strong potential for sustained growth. Continued technological advancements, strategic partnerships, and expanding applications across diverse industries will drive market expansion. Untapped market segments and emerging economies present significant opportunities. The market is poised for substantial growth, with projected annual increases in market value expected to exceed xx Million in the coming years. Strategic investments in R&D and expansion into new markets will be crucial for companies to maintain their competitiveness.
Global Enterprise Augmented Reality Market Segmentation
-
1. End-user
- 1.1. Retail and E-commerce
- 1.2. Education (E-learning)
- 1.3. Industrial
- 1.4. Automotive and Aerospace
- 1.5. Professional Services
- 1.6. Other
Global Enterprise Augmented Reality Market Segmentation By Geography
- 1. North America
- 2. Europe
- 3. Asia Pacific
- 4. Rest of the World
Global Enterprise Augmented Reality Market REPORT HIGHLIGHTS
| Aspects | Details |
|---|---|
| Study Period | 2019-2033 |
| Base Year | 2024 |
| Estimated Year | 2025 |
| Forecast Period | 2025-2033 |
| Historical Period | 2019-2024 |
| Growth Rate | CAGR of 48.60% from 2019-2033 |
| Segmentation |
|
Table of Contents
- 1. Introduction
- 1.1. Research Scope
- 1.2. Market Segmentation
- 1.3. Research Methodology
- 1.4. Definitions and Assumptions
- 2. Executive Summary
- 2.1. Introduction
- 3. Market Dynamics
- 3.1. Introduction
- 3.2. Market Drivers
- 3.2.1. Higher Effectiveness and Efficacy of AR Applications; High Demand for Mobile-based Augmented Reality
- 3.3. Market Restrains
- 3.3.1. Increased Demand for Outsourcing and Automation in Pharmaceutical Manufacturing
- 3.4. Market Trends
- 3.4.1. Demand for Mobile-base AR is Expected to Witness Significant Growth
- 4. Market Factor Analysis
- 4.1. Porters Five Forces
- 4.2. Supply/Value Chain
- 4.3. PESTEL analysis
- 4.4. Market Entropy
- 4.5. Patent/Trademark Analysis
- 5. Global Enterprise Augmented Reality Market Analysis, Insights and Forecast, 2019-2031
- 5.1. Market Analysis, Insights and Forecast - by End-user
- 5.1.1. Retail and E-commerce
- 5.1.2. Education (E-learning)
- 5.1.3. Industrial
- 5.1.4. Automotive and Aerospace
- 5.1.5. Professional Services
- 5.1.6. Other
- 5.2. Market Analysis, Insights and Forecast - by Region
- 5.2.1. North America
- 5.2.2. Europe
- 5.2.3. Asia Pacific
- 5.2.4. Rest of the World
- 5.1. Market Analysis, Insights and Forecast - by End-user
- 6. North America Global Enterprise Augmented Reality Market Analysis, Insights and Forecast, 2019-2031
- 6.1. Market Analysis, Insights and Forecast - by End-user
- 6.1.1. Retail and E-commerce
- 6.1.2. Education (E-learning)
- 6.1.3. Industrial
- 6.1.4. Automotive and Aerospace
- 6.1.5. Professional Services
- 6.1.6. Other
- 6.1. Market Analysis, Insights and Forecast - by End-user
- 7. Europe Global Enterprise Augmented Reality Market Analysis, Insights and Forecast, 2019-2031
- 7.1. Market Analysis, Insights and Forecast - by End-user
- 7.1.1. Retail and E-commerce
- 7.1.2. Education (E-learning)
- 7.1.3. Industrial
- 7.1.4. Automotive and Aerospace
- 7.1.5. Professional Services
- 7.1.6. Other
- 7.1. Market Analysis, Insights and Forecast - by End-user
- 8. Asia Pacific Global Enterprise Augmented Reality Market Analysis, Insights and Forecast, 2019-2031
- 8.1. Market Analysis, Insights and Forecast - by End-user
- 8.1.1. Retail and E-commerce
- 8.1.2. Education (E-learning)
- 8.1.3. Industrial
- 8.1.4. Automotive and Aerospace
- 8.1.5. Professional Services
- 8.1.6. Other
- 8.1. Market Analysis, Insights and Forecast - by End-user
- 9. Rest of the World Global Enterprise Augmented Reality Market Analysis, Insights and Forecast, 2019-2031
- 9.1. Market Analysis, Insights and Forecast - by End-user
- 9.1.1. Retail and E-commerce
- 9.1.2. Education (E-learning)
- 9.1.3. Industrial
- 9.1.4. Automotive and Aerospace
- 9.1.5. Professional Services
- 9.1.6. Other
- 9.1. Market Analysis, Insights and Forecast - by End-user
- 10. North America Global Enterprise Augmented Reality Market Analysis, Insights and Forecast, 2019-2031
- 10.1. Market Analysis, Insights and Forecast - By Country/Sub-region
- 10.1.1.
- 11. Europe Global Enterprise Augmented Reality Market Analysis, Insights and Forecast, 2019-2031
- 11.1. Market Analysis, Insights and Forecast - By Country/Sub-region
- 11.1.1.
- 12. Asia Pacific Global Enterprise Augmented Reality Market Analysis, Insights and Forecast, 2019-2031
- 12.1. Market Analysis, Insights and Forecast - By Country/Sub-region
- 12.1.1.
- 13. Rest of the World Global Enterprise Augmented Reality Market Analysis, Insights and Forecast, 2019-2031
- 13.1. Market Analysis, Insights and Forecast - By Country/Sub-region
- 13.1.1.
- 14. Competitive Analysis
- 14.1. Market Share Analysis 2024
- 14.2. Company Profiles
- 14.2.1 Darf Design
- 14.2.1.1. Overview
- 14.2.1.2. Products
- 14.2.1.3. SWOT Analysis
- 14.2.1.4. Recent Developments
- 14.2.1.5. Financials (Based on Availability)
- 14.2.2 Nextech AR Solutions Corp
- 14.2.2.1. Overview
- 14.2.2.2. Products
- 14.2.2.3. SWOT Analysis
- 14.2.2.4. Recent Developments
- 14.2.2.5. Financials (Based on Availability)
- 14.2.3 Librestream
- 14.2.3.1. Overview
- 14.2.3.2. Products
- 14.2.3.3. SWOT Analysis
- 14.2.3.4. Recent Developments
- 14.2.3.5. Financials (Based on Availability)
- 14.2.4 Industrial Augmented Reality SL (iAR)
- 14.2.4.1. Overview
- 14.2.4.2. Products
- 14.2.4.3. SWOT Analysis
- 14.2.4.4. Recent Developments
- 14.2.4.5. Financials (Based on Availability)
- 14.2.5 Rokid Inc
- 14.2.5.1. Overview
- 14.2.5.2. Products
- 14.2.5.3. SWOT Analysis
- 14.2.5.4. Recent Developments
- 14.2.5.5. Financials (Based on Availability)
- 14.2.6 Dynabook Americas Inc
- 14.2.6.1. Overview
- 14.2.6.2. Products
- 14.2.6.3. SWOT Analysis
- 14.2.6.4. Recent Developments
- 14.2.6.5. Financials (Based on Availability)
- 14.2.7 Dalux
- 14.2.7.1. Overview
- 14.2.7.2. Products
- 14.2.7.3. SWOT Analysis
- 14.2.7.4. Recent Developments
- 14.2.7.5. Financials (Based on Availability)
- 14.2.8 Vuzix Corporation
- 14.2.8.1. Overview
- 14.2.8.2. Products
- 14.2.8.3. SWOT Analysis
- 14.2.8.4. Recent Developments
- 14.2.8.5. Financials (Based on Availability)
- 14.2.9 Epson America Inc (Seiko Epson Corporation)
- 14.2.9.1. Overview
- 14.2.9.2. Products
- 14.2.9.3. SWOT Analysis
- 14.2.9.4. Recent Developments
- 14.2.9.5. Financials (Based on Availability)
- 14.2.10 Plutomen Technologies Pvt Ltd
- 14.2.10.1. Overview
- 14.2.10.2. Products
- 14.2.10.3. SWOT Analysis
- 14.2.10.4. Recent Developments
- 14.2.10.5. Financials (Based on Availability)
- 14.2.11 Lenovo Corporation
- 14.2.11.1. Overview
- 14.2.11.2. Products
- 14.2.11.3. SWOT Analysis
- 14.2.11.4. Recent Developments
- 14.2.11.5. Financials (Based on Availability)
- 14.2.12 Atheer Inc
- 14.2.12.1. Overview
- 14.2.12.2. Products
- 14.2.12.3. SWOT Analysis
- 14.2.12.4. Recent Developments
- 14.2.12.5. Financials (Based on Availability)
- 14.2.13 ThirdEye
- 14.2.13.1. Overview
- 14.2.13.2. Products
- 14.2.13.3. SWOT Analysis
- 14.2.13.4. Recent Developments
- 14.2.13.5. Financials (Based on Availability)
- 14.2.14 Vuforia (PTC Inc )
- 14.2.14.1. Overview
- 14.2.14.2. Products
- 14.2.14.3. SWOT Analysis
- 14.2.14.4. Recent Developments
- 14.2.14.5. Financials (Based on Availability)
- 14.2.1 Darf Design
List of Figures
- Figure 1: Global Global Enterprise Augmented Reality Market Revenue Breakdown (Million, %) by Region 2024 & 2032
- Figure 2: North America Global Enterprise Augmented Reality Market Revenue (Million), by Country 2024 & 2032
- Figure 3: North America Global Enterprise Augmented Reality Market Revenue Share (%), by Country 2024 & 2032
- Figure 4: Europe Global Enterprise Augmented Reality Market Revenue (Million), by Country 2024 & 2032
- Figure 5: Europe Global Enterprise Augmented Reality Market Revenue Share (%), by Country 2024 & 2032
- Figure 6: Asia Pacific Global Enterprise Augmented Reality Market Revenue (Million), by Country 2024 & 2032
- Figure 7: Asia Pacific Global Enterprise Augmented Reality Market Revenue Share (%), by Country 2024 & 2032
- Figure 8: Rest of the World Global Enterprise Augmented Reality Market Revenue (Million), by Country 2024 & 2032
- Figure 9: Rest of the World Global Enterprise Augmented Reality Market Revenue Share (%), by Country 2024 & 2032
- Figure 10: North America Global Enterprise Augmented Reality Market Revenue (Million), by End-user 2024 & 2032
- Figure 11: North America Global Enterprise Augmented Reality Market Revenue Share (%), by End-user 2024 & 2032
- Figure 12: North America Global Enterprise Augmented Reality Market Revenue (Million), by Country 2024 & 2032
- Figure 13: North America Global Enterprise Augmented Reality Market Revenue Share (%), by Country 2024 & 2032
- Figure 14: Europe Global Enterprise Augmented Reality Market Revenue (Million), by End-user 2024 & 2032
- Figure 15: Europe Global Enterprise Augmented Reality Market Revenue Share (%), by End-user 2024 & 2032
- Figure 16: Europe Global Enterprise Augmented Reality Market Revenue (Million), by Country 2024 & 2032
- Figure 17: Europe Global Enterprise Augmented Reality Market Revenue Share (%), by Country 2024 & 2032
- Figure 18: Asia Pacific Global Enterprise Augmented Reality Market Revenue (Million), by End-user 2024 & 2032
- Figure 19: Asia Pacific Global Enterprise Augmented Reality Market Revenue Share (%), by End-user 2024 & 2032
- Figure 20: Asia Pacific Global Enterprise Augmented Reality Market Revenue (Million), by Country 2024 & 2032
- Figure 21: Asia Pacific Global Enterprise Augmented Reality Market Revenue Share (%), by Country 2024 & 2032
- Figure 22: Rest of the World Global Enterprise Augmented Reality Market Revenue (Million), by End-user 2024 & 2032
- Figure 23: Rest of the World Global Enterprise Augmented Reality Market Revenue Share (%), by End-user 2024 & 2032
- Figure 24: Rest of the World Global Enterprise Augmented Reality Market Revenue (Million), by Country 2024 & 2032
- Figure 25: Rest of the World Global Enterprise Augmented Reality Market Revenue Share (%), by Country 2024 & 2032
List of Tables
- Table 1: Global Enterprise Augmented Reality Market Revenue Million Forecast, by Region 2019 & 2032
- Table 2: Global Enterprise Augmented Reality Market Revenue Million Forecast, by End-user 2019 & 2032
- Table 3: Global Enterprise Augmented Reality Market Revenue Million Forecast, by Region 2019 & 2032
- Table 4: Global Enterprise Augmented Reality Market Revenue Million Forecast, by Country 2019 & 2032
- Table 5: Global Enterprise Augmented Reality Market Revenue (Million) Forecast, by Application 2019 & 2032
- Table 6: Global Enterprise Augmented Reality Market Revenue Million Forecast, by Country 2019 & 2032
- Table 7: Global Enterprise Augmented Reality Market Revenue (Million) Forecast, by Application 2019 & 2032
- Table 8: Global Enterprise Augmented Reality Market Revenue Million Forecast, by Country 2019 & 2032
- Table 9: Global Enterprise Augmented Reality Market Revenue (Million) Forecast, by Application 2019 & 2032
- Table 10: Global Enterprise Augmented Reality Market Revenue Million Forecast, by Country 2019 & 2032
- Table 11: Global Enterprise Augmented Reality Market Revenue (Million) Forecast, by Application 2019 & 2032
- Table 12: Global Enterprise Augmented Reality Market Revenue Million Forecast, by End-user 2019 & 2032
- Table 13: Global Enterprise Augmented Reality Market Revenue Million Forecast, by Country 2019 & 2032
- Table 14: Global Enterprise Augmented Reality Market Revenue Million Forecast, by End-user 2019 & 2032
- Table 15: Global Enterprise Augmented Reality Market Revenue Million Forecast, by Country 2019 & 2032
- Table 16: Global Enterprise Augmented Reality Market Revenue Million Forecast, by End-user 2019 & 2032
- Table 17: Global Enterprise Augmented Reality Market Revenue Million Forecast, by Country 2019 & 2032
- Table 18: Global Enterprise Augmented Reality Market Revenue Million Forecast, by End-user 2019 & 2032
- Table 19: Global Enterprise Augmented Reality Market Revenue Million Forecast, by Country 2019 & 2032
Frequently Asked Questions
1. What is the projected Compound Annual Growth Rate (CAGR) of the Global Enterprise Augmented Reality Market?
The projected CAGR is approximately 48.60%.
2. Which companies are prominent players in the Global Enterprise Augmented Reality Market?
Key companies in the market include Darf Design, Nextech AR Solutions Corp, Librestream, Industrial Augmented Reality SL (iAR), Rokid Inc, Dynabook Americas Inc, Dalux, Vuzix Corporation, Epson America Inc (Seiko Epson Corporation), Plutomen Technologies Pvt Ltd, Lenovo Corporation, Atheer Inc, ThirdEye, Vuforia (PTC Inc ).
3. What are the main segments of the Global Enterprise Augmented Reality Market?
The market segments include End-user.
4. Can you provide details about the market size?
The market size is estimated to be USD XX Million as of 2022.
5. What are some drivers contributing to market growth?
Higher Effectiveness and Efficacy of AR Applications; High Demand for Mobile-based Augmented Reality.
6. What are the notable trends driving market growth?
Demand for Mobile-base AR is Expected to Witness Significant Growth.
7. Are there any restraints impacting market growth?
Increased Demand for Outsourcing and Automation in Pharmaceutical Manufacturing.
8. Can you provide examples of recent developments in the market?
May 2022 - ThirdEye, an Augmented Reality & Artificial Intelligence (AR/AI) solution, has launched a decentralized Augmented Reality (AR) 3D social network for consumers, where they have control over their data and will be able to place virtual AR objects in the real world
9. What pricing options are available for accessing the report?
Pricing options include single-user, multi-user, and enterprise licenses priced at USD 4750, USD 5250, and USD 8750 respectively.
10. Is the market size provided in terms of value or volume?
The market size is provided in terms of value, measured in Million.
11. Are there any specific market keywords associated with the report?
Yes, the market keyword associated with the report is "Global Enterprise Augmented Reality Market," which aids in identifying and referencing the specific market segment covered.
12. How do I determine which pricing option suits my needs best?
The pricing options vary based on user requirements and access needs. Individual users may opt for single-user licenses, while businesses requiring broader access may choose multi-user or enterprise licenses for cost-effective access to the report.
13. Are there any additional resources or data provided in the Global Enterprise Augmented Reality Market report?
While the report offers comprehensive insights, it's advisable to review the specific contents or supplementary materials provided to ascertain if additional resources or data are available.
14. How can I stay updated on further developments or reports in the Global Enterprise Augmented Reality Market?
To stay informed about further developments, trends, and reports in the Global Enterprise Augmented Reality Market, consider subscribing to industry newsletters, following relevant companies and organizations, or regularly checking reputable industry news sources and publications.
Methodology
Step 1 - Identification of Relevant Samples Size from Population Database


Step 2 - Approaches for Defining Global Market Size (Value, Volume* & Price*)

Note*: In applicable scenarios
Step 3 - Data Sources
Primary Research
- Web Analytics
- Survey Reports
- Research Institute
- Latest Research Reports
- Opinion Leaders
Secondary Research
- Annual Reports
- White Paper
- Latest Press Release
- Industry Association
- Paid Database
- Investor Presentations

Step 4 - Data Triangulation
Involves using different sources of information in order to increase the validity of a study
These sources are likely to be stakeholders in a program - participants, other researchers, program staff, other community members, and so on.
Then we put all data in single framework & apply various statistical tools to find out the dynamic on the market.
During the analysis stage, feedback from the stakeholder groups would be compared to determine areas of agreement as well as areas of divergence
