

Key Insights
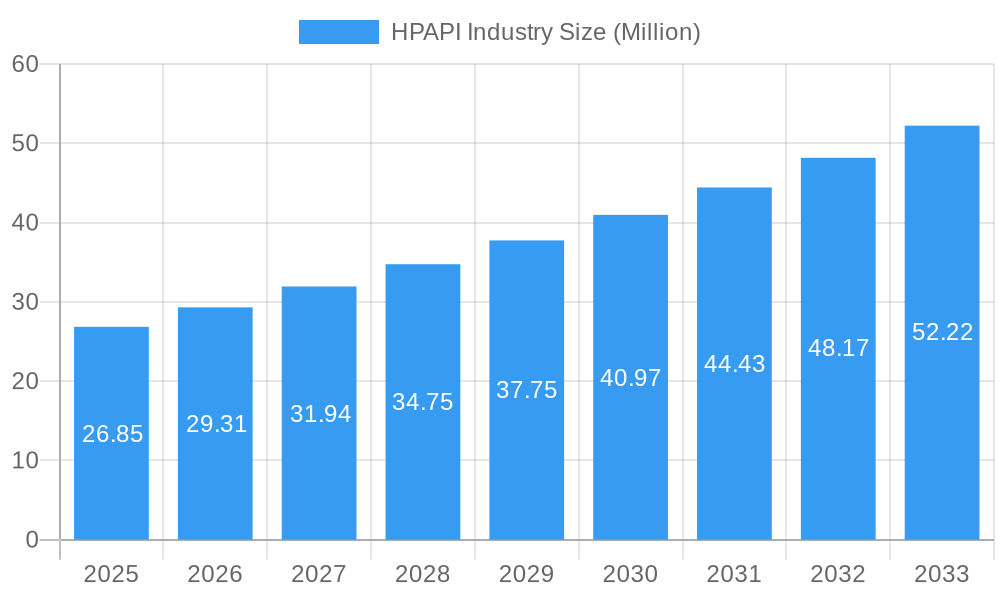
The global Highly Potent Active Pharmaceutical Ingredients (HPAPI) market is projected for substantial growth, currently valued at an estimated USD 26.85 million and anticipated to expand at a Compound Annual Growth Rate (CAGR) of 9.27% from 2025 to 2033. This robust expansion is fueled by the increasing prevalence of chronic diseases, particularly in oncology, and the growing demand for targeted therapies that often require highly potent compounds. The development of advanced synthesis technologies, including both synthetic and biotech approaches, is significantly contributing to the market's dynamism by enabling the efficient and scalable production of complex HPAPIs. Furthermore, the rise of specialized Contract Development and Manufacturing Organizations (CDMOs) catering to HPAPI production and the increasing outsourcing by large pharmaceutical companies are key drivers of this market's upward trajectory.
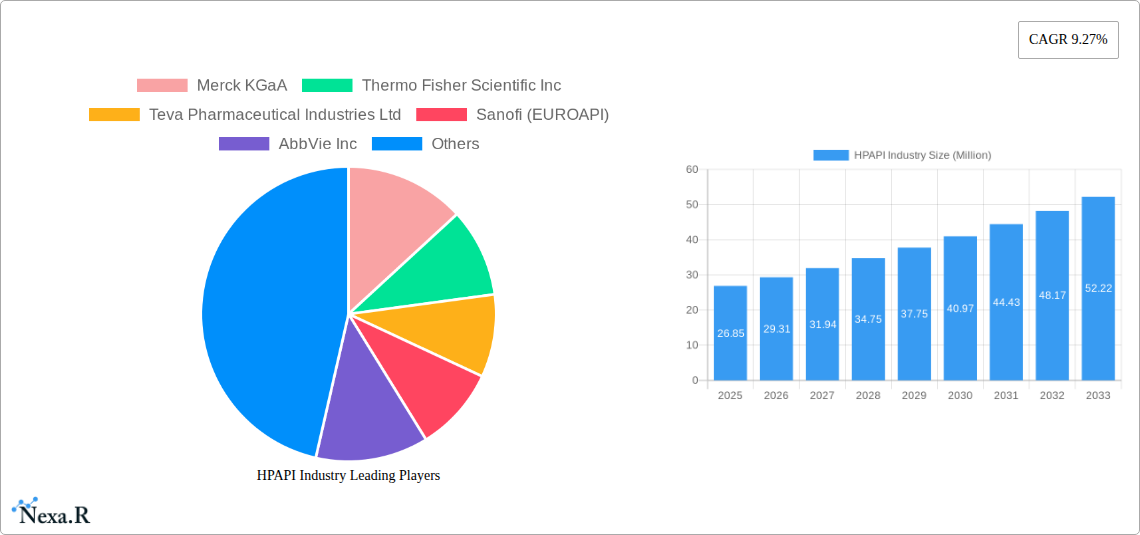
HPAPI Industry Market Size (In Million)
The HPAPI market is segmented across various product types, applications, and synthesis methods. The "Innovative" product type segment is expected to lead growth due to ongoing research and development in novel drug discovery. In terms of applications, oncology remains the dominant segment, reflecting its critical role in treating a wide range of cancers. Hormonal imbalances and glaucoma also represent significant application areas with growing HPAPI demand. The market landscape features both captive HPAPI manufacturers, integrated within larger pharmaceutical corporations, and merchant HPAPI manufacturers, who specialize in producing these highly potent compounds for external clients. Key players like Merck KGaA, Thermo Fisher Scientific Inc., Teva Pharmaceutical Industries Ltd., and Sanofi (EUROAPI) are actively investing in R&D, expanding manufacturing capabilities, and forming strategic partnerships to capitalize on the burgeoning opportunities within this critical pharmaceutical sector.
HPAPI Industry Company Market Share
HPAPI Industry Report: Comprehensive Market Analysis 2019–2033
This in-depth report provides a detailed examination of the High-Potency Active Pharmaceutical Ingredient (HPAPI) industry, offering crucial insights into market dynamics, growth trends, and future opportunities. Analyzing the parent and child market segments, this report equips industry professionals with the data and foresight needed to navigate this complex and rapidly evolving landscape. All quantitative values are presented in Million units.
HPAPI Industry Market Dynamics & Structure
The High-Potency API (HPAPI) market is characterized by a moderate level of concentration, with key players investing heavily in specialized manufacturing capabilities and advanced technologies. The primary driver of technological innovation stems from the increasing demand for highly targeted therapies, particularly in oncology, necessitating the production of APIs with extremely low permissible daily exposure (PDE) levels. Stringent regulatory frameworks from bodies like the FDA and EMA govern every aspect of HPAPI development and manufacturing, emphasizing containment, safety, and purity. Competitive product substitutes are limited due to the specialized nature of HPAPIs, though advancements in drug delivery systems can influence the demand for specific API formulations. End-user demographics are increasingly driven by an aging global population and the rising incidence of chronic diseases, fueling the need for advanced pharmaceutical treatments. Mergers and acquisitions (M&A) are a significant trend, as larger pharmaceutical companies seek to acquire specialized HPAPI expertise and manufacturing capacity to enhance their R&D pipelines and secure supply chains. The market is shaped by barriers to innovation such as the high cost of specialized containment equipment, the need for highly skilled personnel, and the extensive validation processes required.
- Market Concentration: Moderate, with key players investing in specialized infrastructure.
- Technological Innovation Drivers: Development of novel targeted therapies, particularly in oncology.
- Regulatory Frameworks: Strict adherence to FDA and EMA guidelines for containment and safety.
- Competitive Substitutes: Limited due to specialized API requirements.
- End-User Demographics: Driven by aging populations and increasing chronic disease prevalence.
- M&A Trends: Strategic acquisitions to gain expertise and manufacturing capacity.
- Innovation Barriers: High capital investment for containment, skilled workforce requirements, and lengthy validation cycles.
HPAPI Industry Growth Trends & Insights
The HPAPI industry is poised for robust growth, projected to expand at a significant Compound Annual Growth Rate (CAGR) of xx% over the forecast period from 2025 to 2033. This expansion is underpinned by a confluence of factors, including a substantial increase in the research and development of novel cancer therapeutics and treatments for hormonal imbalances, which frequently require HPAPI formulations. The market size is expected to reach approximately XXXX Million units by 2033, a substantial increase from an estimated XXX Million units in the base year of 2025. Adoption rates of HPAPIs are accelerating, driven by pharmaceutical companies’ strategic shift towards developing highly potent and targeted drugs that offer improved efficacy and reduced side effects. Technological disruptions, such as advancements in continuous manufacturing processes and closed-system handling technologies, are further optimizing HPAPI production, enhancing safety, and reducing manufacturing costs. Consumer behavior shifts are also playing a crucial role, with patients and healthcare providers increasingly favoring more effective and personalized treatment options, which often necessitate the use of HPAPIs. The penetration of HPAPIs into niche therapeutic areas beyond oncology is also contributing to market expansion, as new applications are continuously being explored. The historical period from 2019–2024 has laid a strong foundation for this anticipated growth, marked by consistent investments in research and manufacturing capabilities.
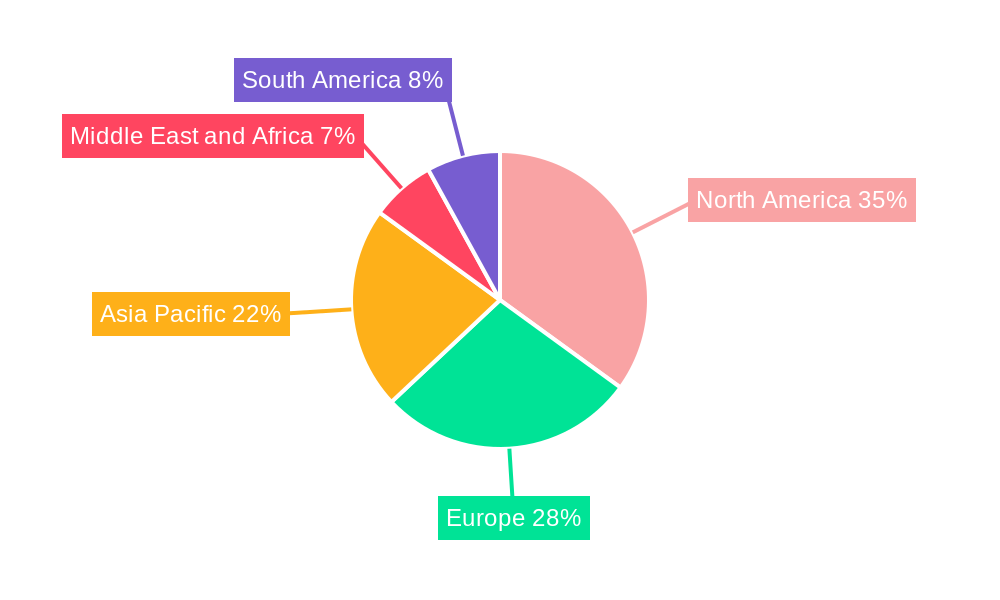
Dominant Regions, Countries, or Segments in HPAPI Industry
North America, particularly the United States, currently holds a dominant position in the global HPAPI industry, driven by a highly developed pharmaceutical research ecosystem, substantial government funding for medical innovation, and the presence of leading pharmaceutical giants. The segment of Innovati (Innovative) HPAPIs is the primary growth engine, fueled by extensive R&D investments in novel drug discovery, especially within the Oncology application segment. The Syntheti (Synthetic) HPAPIs also represent a significant portion of the market, catering to the vast majority of novel drug development. Captive HPAPI Manufacturers, those integrated within large pharmaceutical companies, play a crucial role due to their direct control over proprietary drug development and manufacturing processes. The market share of North America is estimated to be around xx% of the global HPAPI market in 2025, with a projected CAGR of xx% for the forecast period.
- Dominant Region: North America, led by the United States.
- Key Drivers: Robust R&D infrastructure, significant government investment, and major pharmaceutical players.
- Market Share (2025): Approximately xx%.
- Growth Potential: High, driven by ongoing innovation and demand for advanced therapies.
- Dominant Product Type Segment: Innovati (Innovative) HPAPIs.
- Key Drivers: Focus on novel drug development and unmet medical needs.
- Growth Potential: Expected to lead market expansion due to continuous pipeline of new drugs.
- Dominant Application Segment: Oncology.
- Key Drivers: High incidence of cancer and significant advancements in targeted therapies.
- Market Share: Anticipated to hold the largest share within application segments.
- Dominant Synthesis Segment: Syntheti (Synthetic) HPAPIs.
- Key Drivers: Primary method for producing complex and highly potent molecules.
- Growth Potential: Stable and consistent demand from innovative drug development.
- Dominant Manufacturer Segment: Captive HPAPI Manufacturers.
- Key Drivers: Strategic control over proprietary R&D and supply chain security for in-house drug pipelines.
- Market Influence: Significant role in driving innovation and production for key therapeutic areas.
HPAPI Industry Product Landscape
The HPAPI product landscape is defined by its focus on highly potent molecules, primarily for oncology, hormonal imbalance, and increasingly for other targeted therapeutic areas like autoimmune diseases and rare genetic disorders. Innovative HPAPIs are characterized by complex molecular structures, requiring advanced synthesis techniques and stringent containment measures. Performance metrics are critical, with a strong emphasis on extremely low PDE values, high purity, and specific pharmacokinetic profiles. The unique selling propositions of these products lie in their enhanced efficacy, improved safety profiles, and ability to address previously untreatable conditions. Technological advancements are continuously pushing the boundaries of what can be synthesized, enabling the development of highly targeted agents with minimal off-target effects.
Key Drivers, Barriers & Challenges in HPAPI Industry
Key Drivers: The HPAPI industry is propelled by a confluence of powerful drivers, including the ever-increasing prevalence of chronic and complex diseases like cancer, necessitating the development of highly potent and targeted therapeutics. Significant advancements in medicinal chemistry and biotechnology are enabling the synthesis of increasingly complex molecules with superior efficacy. Robust R&D investments by pharmaceutical companies, coupled with favorable government initiatives and tax incentives for drug development, further accelerate market growth. The rising global healthcare expenditure and expanding access to advanced treatments in emerging economies also contribute significantly.
Barriers & Challenges: Despite the promising growth, the HPAPI industry faces formidable challenges. The high capital expenditure required for specialized containment facilities and advanced manufacturing equipment represents a significant barrier to entry. The stringent and evolving regulatory landscape, demanding rigorous compliance for safety and environmental protection, adds complexity and cost. Scarcity of highly skilled personnel with expertise in handling potent compounds and complex synthesis processes poses a persistent challenge. Furthermore, the long lead times associated with R&D, clinical trials, and regulatory approvals for HPAPI-based drugs can impact market penetration speed. Supply chain vulnerabilities and geopolitical risks can also disrupt the availability of raw materials.
Emerging Opportunities in HPAPI Industry
Emerging opportunities within the HPAPI industry are abundant and diverse. The untapped potential in personalized medicine and gene therapy offers new avenues for HPAPI development, catering to highly specific patient needs. Growth in the development of antibody-drug conjugates (ADCs) is a significant trend, requiring specialized linker and payload HPAPIs. Expansion into emerging markets with increasing healthcare infrastructure and a growing demand for advanced treatments presents substantial growth prospects. Furthermore, the exploration of HPAPIs for rare diseases and neglected tropical diseases, often overlooked by traditional drug development, represents a socially impactful and commercially viable opportunity. The increasing focus on novel drug delivery systems is also creating opportunities for specialized HPAPI formulations.
Growth Accelerators in the HPAPI Industry Industry
Several key catalysts are accelerating the long-term growth of the HPAPI industry. Continuous technological breakthroughs in synthetic chemistry, particularly in areas like biocatalysis and flow chemistry, are enabling more efficient and sustainable HPAPI production. Strategic partnerships and collaborations between pharmaceutical companies, contract development and manufacturing organizations (CDMOs), and research institutions are fostering innovation and accelerating drug development pipelines. Market expansion strategies, including the penetration of HPAPIs into new therapeutic indications and geographic regions, are crucial growth drivers. The increasing outsourcing of HPAPI manufacturing to specialized CDMOs by pharmaceutical companies also plays a vital role in driving capacity and expertise across the industry.
Key Players Shaping the HPAPI Industry Market
- Merck KGaA
- Thermo Fisher Scientific Inc
- Teva Pharmaceutical Industries Ltd
- Sanofi (EUROAPI)
- AbbVie Inc
- Corden Pharma International
- Viatris Inc
- Sun Pharmaceutical Industries Ltd
- SK Biotek
- Pfizer Inc
Notable Milestones in HPAPI Industry Sector
- January 2023: Sai Life Sciences completed the construction of a new High-Potency API (HPAPI) manufacturing facility at its cGMP API Manufacturing site in Bidar, India. This addition significantly enhances the company's expertise in HPAPI development and production, providing customers with an expedited route for New Chemical Entity (NCE) development.
- February 2023: Piramal Pharma Solutions inaugurated a pharmaceutical API manufacturing plant in the United States. This state-of-the-art facility specializes in the production of active pharmaceutical ingredients (API) and high-potency active pharmaceutical ingredients (HPAPI).
In-Depth HPAPI Industry Market Outlook
The HPAPI industry is characterized by a dynamic and promising future, driven by relentless innovation and an expanding demand for advanced therapeutics. Growth accelerators such as breakthroughs in precision medicine, the rise of antibody-drug conjugates, and the expansion into novel therapeutic areas will continue to fuel market expansion. Strategic partnerships and the increasing reliance on specialized CDMOs will streamline development and manufacturing processes, leading to greater efficiency and accessibility. The outlook for the HPAPI market remains exceptionally strong, with significant opportunities for companies that can navigate the regulatory landscape and capitalize on the increasing need for highly potent and targeted drug solutions, promising sustained growth and impactful contributions to global healthcare.
HPAPI Industry Segmentation
-
1. Poduct Type
- 1.1. Innovati
- 1.2. Generic
-
2. Application
- 2.1. Oncology
- 2.2. Hormonal Imbalance
- 2.3. Glaucoma
- 2.4. Other Applications
-
3. Synthesis
- 3.1. Syntheti
- 3.2. Biotech
-
4. Manufacturer
- 4.1. Captive HPAPI Manufacturers
- 4.2. Merchant HPAPI Manufacturers
HPAPI Industry Segmentation By Geography
-
1. North America
- 1.1. United States
- 1.2. Canada
- 1.3. Mexico
-
2. Europe
- 2.1. Germany
- 2.2. United Kingdom
- 2.3. France
- 2.4. Italy
- 2.5. Spain
- 2.6. Rest of Europe
-
3. Asia Pacific
- 3.1. China
- 3.2. Japan
- 3.3. India
- 3.4. Australia
- 3.5. South Korea
- 3.6. Rest of Asia Pacific
-
4. Middle East and Africa
- 4.1. GCC
- 4.2. South Africa
- 4.3. Rest of Middle East and Africa
-
5. South America
- 5.1. Brazil
- 5.2. Argentina
- 5.3. Rest of South America
HPAPI Industry Regional Market Share
Geographic Coverage of HPAPI Industry
HPAPI Industry REPORT HIGHLIGHTS
| Aspects | Details |
|---|---|
| Study Period | 2020-2034 |
| Base Year | 2025 |
| Estimated Year | 2026 |
| Forecast Period | 2026-2034 |
| Historical Period | 2020-2025 |
| Growth Rate | CAGR of 9.27% from 2020-2034 |
| Segmentation |
|
Table of Contents
- 1. Introduction
- 1.1. Research Scope
- 1.2. Market Segmentation
- 1.3. Research Objective
- 1.4. Definitions and Assumptions
- 2. Executive Summary
- 2.1. Market Snapshot
- 3. Market Dynamics
- 3.1. Market Drivers
- 3.2. Market Restrains
- 3.3. Market Trends
- 3.4. Market Opportunities
- 4. Market Factor Analysis
- 4.1. Porters Five Forces
- 4.1.1. Bargaining Power of Suppliers
- 4.1.2. Bargaining Power of Buyers
- 4.1.3. Threat of New Entrants
- 4.1.4. Threat of Substitutes
- 4.1.5. Competitive Rivalry
- 4.2. PESTEL analysis
- 4.3. BCG Analysis
- 4.3.1. Stars (High Growth, High Market Share)
- 4.3.2. Cash Cows (Low Growth, High Market Share)
- 4.3.3. Question Mark (High Growth, Low Market Share)
- 4.3.4. Dogs (Low Growth, Low Market Share)
- 4.4. Ansoff Matrix Analysis
- 4.5. Supply Chain Analysis
- 4.6. Regulatory Landscape
- 4.7. Current Market Potential and Opportunity Assessment (TAM–SAM–SOM Framework)
- 4.8. NRP Analyst Note
- 4.1. Porters Five Forces
- 5. Market Analysis, Insights and Forecast 2021-2033
- 5.1. Market Analysis, Insights and Forecast - by Poduct Type
- 5.1.1. Innovati
- 5.1.2. Generic
- 5.2. Market Analysis, Insights and Forecast - by Application
- 5.2.1. Oncology
- 5.2.2. Hormonal Imbalance
- 5.2.3. Glaucoma
- 5.2.4. Other Applications
- 5.3. Market Analysis, Insights and Forecast - by Synthesis
- 5.3.1. Syntheti
- 5.3.2. Biotech
- 5.4. Market Analysis, Insights and Forecast - by Manufacturer
- 5.4.1. Captive HPAPI Manufacturers
- 5.4.2. Merchant HPAPI Manufacturers
- 5.5. Market Analysis, Insights and Forecast - by Region
- 5.5.1. North America
- 5.5.2. Europe
- 5.5.3. Asia Pacific
- 5.5.4. Middle East and Africa
- 5.5.5. South America
- 5.1. Market Analysis, Insights and Forecast - by Poduct Type
- 6. Global HPAPI Industry Analysis, Insights and Forecast, 2021-2033
- 6.1. Market Analysis, Insights and Forecast - by Poduct Type
- 6.1.1. Innovati
- 6.1.2. Generic
- 6.2. Market Analysis, Insights and Forecast - by Application
- 6.2.1. Oncology
- 6.2.2. Hormonal Imbalance
- 6.2.3. Glaucoma
- 6.2.4. Other Applications
- 6.3. Market Analysis, Insights and Forecast - by Synthesis
- 6.3.1. Syntheti
- 6.3.2. Biotech
- 6.4. Market Analysis, Insights and Forecast - by Manufacturer
- 6.4.1. Captive HPAPI Manufacturers
- 6.4.2. Merchant HPAPI Manufacturers
- 6.1. Market Analysis, Insights and Forecast - by Poduct Type
- 7. North America HPAPI Industry Analysis, Insights and Forecast, 2020-2032
- 7.1. Market Analysis, Insights and Forecast - by Poduct Type
- 7.1.1. Innovati
- 7.1.2. Generic
- 7.2. Market Analysis, Insights and Forecast - by Application
- 7.2.1. Oncology
- 7.2.2. Hormonal Imbalance
- 7.2.3. Glaucoma
- 7.2.4. Other Applications
- 7.3. Market Analysis, Insights and Forecast - by Synthesis
- 7.3.1. Syntheti
- 7.3.2. Biotech
- 7.4. Market Analysis, Insights and Forecast - by Manufacturer
- 7.4.1. Captive HPAPI Manufacturers
- 7.4.2. Merchant HPAPI Manufacturers
- 7.1. Market Analysis, Insights and Forecast - by Poduct Type
- 8. Europe HPAPI Industry Analysis, Insights and Forecast, 2020-2032
- 8.1. Market Analysis, Insights and Forecast - by Poduct Type
- 8.1.1. Innovati
- 8.1.2. Generic
- 8.2. Market Analysis, Insights and Forecast - by Application
- 8.2.1. Oncology
- 8.2.2. Hormonal Imbalance
- 8.2.3. Glaucoma
- 8.2.4. Other Applications
- 8.3. Market Analysis, Insights and Forecast - by Synthesis
- 8.3.1. Syntheti
- 8.3.2. Biotech
- 8.4. Market Analysis, Insights and Forecast - by Manufacturer
- 8.4.1. Captive HPAPI Manufacturers
- 8.4.2. Merchant HPAPI Manufacturers
- 8.1. Market Analysis, Insights and Forecast - by Poduct Type
- 9. Asia Pacific HPAPI Industry Analysis, Insights and Forecast, 2020-2032
- 9.1. Market Analysis, Insights and Forecast - by Poduct Type
- 9.1.1. Innovati
- 9.1.2. Generic
- 9.2. Market Analysis, Insights and Forecast - by Application
- 9.2.1. Oncology
- 9.2.2. Hormonal Imbalance
- 9.2.3. Glaucoma
- 9.2.4. Other Applications
- 9.3. Market Analysis, Insights and Forecast - by Synthesis
- 9.3.1. Syntheti
- 9.3.2. Biotech
- 9.4. Market Analysis, Insights and Forecast - by Manufacturer
- 9.4.1. Captive HPAPI Manufacturers
- 9.4.2. Merchant HPAPI Manufacturers
- 9.1. Market Analysis, Insights and Forecast - by Poduct Type
- 10. Middle East and Africa HPAPI Industry Analysis, Insights and Forecast, 2020-2032
- 10.1. Market Analysis, Insights and Forecast - by Poduct Type
- 10.1.1. Innovati
- 10.1.2. Generic
- 10.2. Market Analysis, Insights and Forecast - by Application
- 10.2.1. Oncology
- 10.2.2. Hormonal Imbalance
- 10.2.3. Glaucoma
- 10.2.4. Other Applications
- 10.3. Market Analysis, Insights and Forecast - by Synthesis
- 10.3.1. Syntheti
- 10.3.2. Biotech
- 10.4. Market Analysis, Insights and Forecast - by Manufacturer
- 10.4.1. Captive HPAPI Manufacturers
- 10.4.2. Merchant HPAPI Manufacturers
- 10.1. Market Analysis, Insights and Forecast - by Poduct Type
- 11. South America HPAPI Industry Analysis, Insights and Forecast, 2020-2032
- 11.1. Market Analysis, Insights and Forecast - by Poduct Type
- 11.1.1. Innovati
- 11.1.2. Generic
- 11.2. Market Analysis, Insights and Forecast - by Application
- 11.2.1. Oncology
- 11.2.2. Hormonal Imbalance
- 11.2.3. Glaucoma
- 11.2.4. Other Applications
- 11.3. Market Analysis, Insights and Forecast - by Synthesis
- 11.3.1. Syntheti
- 11.3.2. Biotech
- 11.4. Market Analysis, Insights and Forecast - by Manufacturer
- 11.4.1. Captive HPAPI Manufacturers
- 11.4.2. Merchant HPAPI Manufacturers
- 11.1. Market Analysis, Insights and Forecast - by Poduct Type
- 12. Competitive Analysis
- 12.1. Company Profiles
- 12.1.1 Merck KGaA
- 12.1.1.1. Company Overview
- 12.1.1.2. Products
- 12.1.1.3. Company Financials
- 12.1.1.4. SWOT Analysis
- 12.1.2 Thermo Fisher Scientific Inc
- 12.1.2.1. Company Overview
- 12.1.2.2. Products
- 12.1.2.3. Company Financials
- 12.1.2.4. SWOT Analysis
- 12.1.3 Teva Pharmaceutical Industries Ltd
- 12.1.3.1. Company Overview
- 12.1.3.2. Products
- 12.1.3.3. Company Financials
- 12.1.3.4. SWOT Analysis
- 12.1.4 Sanofi (EUROAPI)
- 12.1.4.1. Company Overview
- 12.1.4.2. Products
- 12.1.4.3. Company Financials
- 12.1.4.4. SWOT Analysis
- 12.1.5 AbbVie Inc
- 12.1.5.1. Company Overview
- 12.1.5.2. Products
- 12.1.5.3. Company Financials
- 12.1.5.4. SWOT Analysis
- 12.1.6 Corden Pharma International
- 12.1.6.1. Company Overview
- 12.1.6.2. Products
- 12.1.6.3. Company Financials
- 12.1.6.4. SWOT Analysis
- 12.1.7 Viatris Inc
- 12.1.7.1. Company Overview
- 12.1.7.2. Products
- 12.1.7.3. Company Financials
- 12.1.7.4. SWOT Analysis
- 12.1.8 Sun Pharmaceutical Industries Ltd
- 12.1.8.1. Company Overview
- 12.1.8.2. Products
- 12.1.8.3. Company Financials
- 12.1.8.4. SWOT Analysis
- 12.1.9 SK Biotek
- 12.1.9.1. Company Overview
- 12.1.9.2. Products
- 12.1.9.3. Company Financials
- 12.1.9.4. SWOT Analysis
- 12.1.10 Pfizer Inc
- 12.1.10.1. Company Overview
- 12.1.10.2. Products
- 12.1.10.3. Company Financials
- 12.1.10.4. SWOT Analysis
- 12.1.1 Merck KGaA
- 12.2. Market Entropy
- 12.2.1 Company's Key Areas Served
- 12.2.2 Recent Developments
- 12.3. Company Market Share Analysis 2025
- 12.3.1 Top 5 Companies Market Share Analysis
- 12.3.2 Top 3 Companies Market Share Analysis
- 12.4. List of Potential Customers
- 13. Research Methodology
List of Figures
- Figure 1: Global HPAPI Industry Revenue Breakdown (Million, %) by Region 2025 & 2033
- Figure 2: Global HPAPI Industry Volume Breakdown (K Unit, %) by Region 2025 & 2033
- Figure 3: North America HPAPI Industry Revenue (Million), by Poduct Type 2025 & 2033
- Figure 4: North America HPAPI Industry Volume (K Unit), by Poduct Type 2025 & 2033
- Figure 5: North America HPAPI Industry Revenue Share (%), by Poduct Type 2025 & 2033
- Figure 6: North America HPAPI Industry Volume Share (%), by Poduct Type 2025 & 2033
- Figure 7: North America HPAPI Industry Revenue (Million), by Application 2025 & 2033
- Figure 8: North America HPAPI Industry Volume (K Unit), by Application 2025 & 2033
- Figure 9: North America HPAPI Industry Revenue Share (%), by Application 2025 & 2033
- Figure 10: North America HPAPI Industry Volume Share (%), by Application 2025 & 2033
- Figure 11: North America HPAPI Industry Revenue (Million), by Synthesis 2025 & 2033
- Figure 12: North America HPAPI Industry Volume (K Unit), by Synthesis 2025 & 2033
- Figure 13: North America HPAPI Industry Revenue Share (%), by Synthesis 2025 & 2033
- Figure 14: North America HPAPI Industry Volume Share (%), by Synthesis 2025 & 2033
- Figure 15: North America HPAPI Industry Revenue (Million), by Manufacturer 2025 & 2033
- Figure 16: North America HPAPI Industry Volume (K Unit), by Manufacturer 2025 & 2033
- Figure 17: North America HPAPI Industry Revenue Share (%), by Manufacturer 2025 & 2033
- Figure 18: North America HPAPI Industry Volume Share (%), by Manufacturer 2025 & 2033
- Figure 19: North America HPAPI Industry Revenue (Million), by Country 2025 & 2033
- Figure 20: North America HPAPI Industry Volume (K Unit), by Country 2025 & 2033
- Figure 21: North America HPAPI Industry Revenue Share (%), by Country 2025 & 2033
- Figure 22: North America HPAPI Industry Volume Share (%), by Country 2025 & 2033
- Figure 23: Europe HPAPI Industry Revenue (Million), by Poduct Type 2025 & 2033
- Figure 24: Europe HPAPI Industry Volume (K Unit), by Poduct Type 2025 & 2033
- Figure 25: Europe HPAPI Industry Revenue Share (%), by Poduct Type 2025 & 2033
- Figure 26: Europe HPAPI Industry Volume Share (%), by Poduct Type 2025 & 2033
- Figure 27: Europe HPAPI Industry Revenue (Million), by Application 2025 & 2033
- Figure 28: Europe HPAPI Industry Volume (K Unit), by Application 2025 & 2033
- Figure 29: Europe HPAPI Industry Revenue Share (%), by Application 2025 & 2033
- Figure 30: Europe HPAPI Industry Volume Share (%), by Application 2025 & 2033
- Figure 31: Europe HPAPI Industry Revenue (Million), by Synthesis 2025 & 2033
- Figure 32: Europe HPAPI Industry Volume (K Unit), by Synthesis 2025 & 2033
- Figure 33: Europe HPAPI Industry Revenue Share (%), by Synthesis 2025 & 2033
- Figure 34: Europe HPAPI Industry Volume Share (%), by Synthesis 2025 & 2033
- Figure 35: Europe HPAPI Industry Revenue (Million), by Manufacturer 2025 & 2033
- Figure 36: Europe HPAPI Industry Volume (K Unit), by Manufacturer 2025 & 2033
- Figure 37: Europe HPAPI Industry Revenue Share (%), by Manufacturer 2025 & 2033
- Figure 38: Europe HPAPI Industry Volume Share (%), by Manufacturer 2025 & 2033
- Figure 39: Europe HPAPI Industry Revenue (Million), by Country 2025 & 2033
- Figure 40: Europe HPAPI Industry Volume (K Unit), by Country 2025 & 2033
- Figure 41: Europe HPAPI Industry Revenue Share (%), by Country 2025 & 2033
- Figure 42: Europe HPAPI Industry Volume Share (%), by Country 2025 & 2033
- Figure 43: Asia Pacific HPAPI Industry Revenue (Million), by Poduct Type 2025 & 2033
- Figure 44: Asia Pacific HPAPI Industry Volume (K Unit), by Poduct Type 2025 & 2033
- Figure 45: Asia Pacific HPAPI Industry Revenue Share (%), by Poduct Type 2025 & 2033
- Figure 46: Asia Pacific HPAPI Industry Volume Share (%), by Poduct Type 2025 & 2033
- Figure 47: Asia Pacific HPAPI Industry Revenue (Million), by Application 2025 & 2033
- Figure 48: Asia Pacific HPAPI Industry Volume (K Unit), by Application 2025 & 2033
- Figure 49: Asia Pacific HPAPI Industry Revenue Share (%), by Application 2025 & 2033
- Figure 50: Asia Pacific HPAPI Industry Volume Share (%), by Application 2025 & 2033
- Figure 51: Asia Pacific HPAPI Industry Revenue (Million), by Synthesis 2025 & 2033
- Figure 52: Asia Pacific HPAPI Industry Volume (K Unit), by Synthesis 2025 & 2033
- Figure 53: Asia Pacific HPAPI Industry Revenue Share (%), by Synthesis 2025 & 2033
- Figure 54: Asia Pacific HPAPI Industry Volume Share (%), by Synthesis 2025 & 2033
- Figure 55: Asia Pacific HPAPI Industry Revenue (Million), by Manufacturer 2025 & 2033
- Figure 56: Asia Pacific HPAPI Industry Volume (K Unit), by Manufacturer 2025 & 2033
- Figure 57: Asia Pacific HPAPI Industry Revenue Share (%), by Manufacturer 2025 & 2033
- Figure 58: Asia Pacific HPAPI Industry Volume Share (%), by Manufacturer 2025 & 2033
- Figure 59: Asia Pacific HPAPI Industry Revenue (Million), by Country 2025 & 2033
- Figure 60: Asia Pacific HPAPI Industry Volume (K Unit), by Country 2025 & 2033
- Figure 61: Asia Pacific HPAPI Industry Revenue Share (%), by Country 2025 & 2033
- Figure 62: Asia Pacific HPAPI Industry Volume Share (%), by Country 2025 & 2033
- Figure 63: Middle East and Africa HPAPI Industry Revenue (Million), by Poduct Type 2025 & 2033
- Figure 64: Middle East and Africa HPAPI Industry Volume (K Unit), by Poduct Type 2025 & 2033
- Figure 65: Middle East and Africa HPAPI Industry Revenue Share (%), by Poduct Type 2025 & 2033
- Figure 66: Middle East and Africa HPAPI Industry Volume Share (%), by Poduct Type 2025 & 2033
- Figure 67: Middle East and Africa HPAPI Industry Revenue (Million), by Application 2025 & 2033
- Figure 68: Middle East and Africa HPAPI Industry Volume (K Unit), by Application 2025 & 2033
- Figure 69: Middle East and Africa HPAPI Industry Revenue Share (%), by Application 2025 & 2033
- Figure 70: Middle East and Africa HPAPI Industry Volume Share (%), by Application 2025 & 2033
- Figure 71: Middle East and Africa HPAPI Industry Revenue (Million), by Synthesis 2025 & 2033
- Figure 72: Middle East and Africa HPAPI Industry Volume (K Unit), by Synthesis 2025 & 2033
- Figure 73: Middle East and Africa HPAPI Industry Revenue Share (%), by Synthesis 2025 & 2033
- Figure 74: Middle East and Africa HPAPI Industry Volume Share (%), by Synthesis 2025 & 2033
- Figure 75: Middle East and Africa HPAPI Industry Revenue (Million), by Manufacturer 2025 & 2033
- Figure 76: Middle East and Africa HPAPI Industry Volume (K Unit), by Manufacturer 2025 & 2033
- Figure 77: Middle East and Africa HPAPI Industry Revenue Share (%), by Manufacturer 2025 & 2033
- Figure 78: Middle East and Africa HPAPI Industry Volume Share (%), by Manufacturer 2025 & 2033
- Figure 79: Middle East and Africa HPAPI Industry Revenue (Million), by Country 2025 & 2033
- Figure 80: Middle East and Africa HPAPI Industry Volume (K Unit), by Country 2025 & 2033
- Figure 81: Middle East and Africa HPAPI Industry Revenue Share (%), by Country 2025 & 2033
- Figure 82: Middle East and Africa HPAPI Industry Volume Share (%), by Country 2025 & 2033
- Figure 83: South America HPAPI Industry Revenue (Million), by Poduct Type 2025 & 2033
- Figure 84: South America HPAPI Industry Volume (K Unit), by Poduct Type 2025 & 2033
- Figure 85: South America HPAPI Industry Revenue Share (%), by Poduct Type 2025 & 2033
- Figure 86: South America HPAPI Industry Volume Share (%), by Poduct Type 2025 & 2033
- Figure 87: South America HPAPI Industry Revenue (Million), by Application 2025 & 2033
- Figure 88: South America HPAPI Industry Volume (K Unit), by Application 2025 & 2033
- Figure 89: South America HPAPI Industry Revenue Share (%), by Application 2025 & 2033
- Figure 90: South America HPAPI Industry Volume Share (%), by Application 2025 & 2033
- Figure 91: South America HPAPI Industry Revenue (Million), by Synthesis 2025 & 2033
- Figure 92: South America HPAPI Industry Volume (K Unit), by Synthesis 2025 & 2033
- Figure 93: South America HPAPI Industry Revenue Share (%), by Synthesis 2025 & 2033
- Figure 94: South America HPAPI Industry Volume Share (%), by Synthesis 2025 & 2033
- Figure 95: South America HPAPI Industry Revenue (Million), by Manufacturer 2025 & 2033
- Figure 96: South America HPAPI Industry Volume (K Unit), by Manufacturer 2025 & 2033
- Figure 97: South America HPAPI Industry Revenue Share (%), by Manufacturer 2025 & 2033
- Figure 98: South America HPAPI Industry Volume Share (%), by Manufacturer 2025 & 2033
- Figure 99: South America HPAPI Industry Revenue (Million), by Country 2025 & 2033
- Figure 100: South America HPAPI Industry Volume (K Unit), by Country 2025 & 2033
- Figure 101: South America HPAPI Industry Revenue Share (%), by Country 2025 & 2033
- Figure 102: South America HPAPI Industry Volume Share (%), by Country 2025 & 2033
List of Tables
- Table 1: Global HPAPI Industry Revenue Million Forecast, by Poduct Type 2020 & 2033
- Table 2: Global HPAPI Industry Volume K Unit Forecast, by Poduct Type 2020 & 2033
- Table 3: Global HPAPI Industry Revenue Million Forecast, by Application 2020 & 2033
- Table 4: Global HPAPI Industry Volume K Unit Forecast, by Application 2020 & 2033
- Table 5: Global HPAPI Industry Revenue Million Forecast, by Synthesis 2020 & 2033
- Table 6: Global HPAPI Industry Volume K Unit Forecast, by Synthesis 2020 & 2033
- Table 7: Global HPAPI Industry Revenue Million Forecast, by Manufacturer 2020 & 2033
- Table 8: Global HPAPI Industry Volume K Unit Forecast, by Manufacturer 2020 & 2033
- Table 9: Global HPAPI Industry Revenue Million Forecast, by Region 2020 & 2033
- Table 10: Global HPAPI Industry Volume K Unit Forecast, by Region 2020 & 2033
- Table 11: Global HPAPI Industry Revenue Million Forecast, by Poduct Type 2020 & 2033
- Table 12: Global HPAPI Industry Volume K Unit Forecast, by Poduct Type 2020 & 2033
- Table 13: Global HPAPI Industry Revenue Million Forecast, by Application 2020 & 2033
- Table 14: Global HPAPI Industry Volume K Unit Forecast, by Application 2020 & 2033
- Table 15: Global HPAPI Industry Revenue Million Forecast, by Synthesis 2020 & 2033
- Table 16: Global HPAPI Industry Volume K Unit Forecast, by Synthesis 2020 & 2033
- Table 17: Global HPAPI Industry Revenue Million Forecast, by Manufacturer 2020 & 2033
- Table 18: Global HPAPI Industry Volume K Unit Forecast, by Manufacturer 2020 & 2033
- Table 19: Global HPAPI Industry Revenue Million Forecast, by Country 2020 & 2033
- Table 20: Global HPAPI Industry Volume K Unit Forecast, by Country 2020 & 2033
- Table 21: United States HPAPI Industry Revenue (Million) Forecast, by Application 2020 & 2033
- Table 22: United States HPAPI Industry Volume (K Unit) Forecast, by Application 2020 & 2033
- Table 23: Canada HPAPI Industry Revenue (Million) Forecast, by Application 2020 & 2033
- Table 24: Canada HPAPI Industry Volume (K Unit) Forecast, by Application 2020 & 2033
- Table 25: Mexico HPAPI Industry Revenue (Million) Forecast, by Application 2020 & 2033
- Table 26: Mexico HPAPI Industry Volume (K Unit) Forecast, by Application 2020 & 2033
- Table 27: Global HPAPI Industry Revenue Million Forecast, by Poduct Type 2020 & 2033
- Table 28: Global HPAPI Industry Volume K Unit Forecast, by Poduct Type 2020 & 2033
- Table 29: Global HPAPI Industry Revenue Million Forecast, by Application 2020 & 2033
- Table 30: Global HPAPI Industry Volume K Unit Forecast, by Application 2020 & 2033
- Table 31: Global HPAPI Industry Revenue Million Forecast, by Synthesis 2020 & 2033
- Table 32: Global HPAPI Industry Volume K Unit Forecast, by Synthesis 2020 & 2033
- Table 33: Global HPAPI Industry Revenue Million Forecast, by Manufacturer 2020 & 2033
- Table 34: Global HPAPI Industry Volume K Unit Forecast, by Manufacturer 2020 & 2033
- Table 35: Global HPAPI Industry Revenue Million Forecast, by Country 2020 & 2033
- Table 36: Global HPAPI Industry Volume K Unit Forecast, by Country 2020 & 2033
- Table 37: Germany HPAPI Industry Revenue (Million) Forecast, by Application 2020 & 2033
- Table 38: Germany HPAPI Industry Volume (K Unit) Forecast, by Application 2020 & 2033
- Table 39: United Kingdom HPAPI Industry Revenue (Million) Forecast, by Application 2020 & 2033
- Table 40: United Kingdom HPAPI Industry Volume (K Unit) Forecast, by Application 2020 & 2033
- Table 41: France HPAPI Industry Revenue (Million) Forecast, by Application 2020 & 2033
- Table 42: France HPAPI Industry Volume (K Unit) Forecast, by Application 2020 & 2033
- Table 43: Italy HPAPI Industry Revenue (Million) Forecast, by Application 2020 & 2033
- Table 44: Italy HPAPI Industry Volume (K Unit) Forecast, by Application 2020 & 2033
- Table 45: Spain HPAPI Industry Revenue (Million) Forecast, by Application 2020 & 2033
- Table 46: Spain HPAPI Industry Volume (K Unit) Forecast, by Application 2020 & 2033
- Table 47: Rest of Europe HPAPI Industry Revenue (Million) Forecast, by Application 2020 & 2033
- Table 48: Rest of Europe HPAPI Industry Volume (K Unit) Forecast, by Application 2020 & 2033
- Table 49: Global HPAPI Industry Revenue Million Forecast, by Poduct Type 2020 & 2033
- Table 50: Global HPAPI Industry Volume K Unit Forecast, by Poduct Type 2020 & 2033
- Table 51: Global HPAPI Industry Revenue Million Forecast, by Application 2020 & 2033
- Table 52: Global HPAPI Industry Volume K Unit Forecast, by Application 2020 & 2033
- Table 53: Global HPAPI Industry Revenue Million Forecast, by Synthesis 2020 & 2033
- Table 54: Global HPAPI Industry Volume K Unit Forecast, by Synthesis 2020 & 2033
- Table 55: Global HPAPI Industry Revenue Million Forecast, by Manufacturer 2020 & 2033
- Table 56: Global HPAPI Industry Volume K Unit Forecast, by Manufacturer 2020 & 2033
- Table 57: Global HPAPI Industry Revenue Million Forecast, by Country 2020 & 2033
- Table 58: Global HPAPI Industry Volume K Unit Forecast, by Country 2020 & 2033
- Table 59: China HPAPI Industry Revenue (Million) Forecast, by Application 2020 & 2033
- Table 60: China HPAPI Industry Volume (K Unit) Forecast, by Application 2020 & 2033
- Table 61: Japan HPAPI Industry Revenue (Million) Forecast, by Application 2020 & 2033
- Table 62: Japan HPAPI Industry Volume (K Unit) Forecast, by Application 2020 & 2033
- Table 63: India HPAPI Industry Revenue (Million) Forecast, by Application 2020 & 2033
- Table 64: India HPAPI Industry Volume (K Unit) Forecast, by Application 2020 & 2033
- Table 65: Australia HPAPI Industry Revenue (Million) Forecast, by Application 2020 & 2033
- Table 66: Australia HPAPI Industry Volume (K Unit) Forecast, by Application 2020 & 2033
- Table 67: South Korea HPAPI Industry Revenue (Million) Forecast, by Application 2020 & 2033
- Table 68: South Korea HPAPI Industry Volume (K Unit) Forecast, by Application 2020 & 2033
- Table 69: Rest of Asia Pacific HPAPI Industry Revenue (Million) Forecast, by Application 2020 & 2033
- Table 70: Rest of Asia Pacific HPAPI Industry Volume (K Unit) Forecast, by Application 2020 & 2033
- Table 71: Global HPAPI Industry Revenue Million Forecast, by Poduct Type 2020 & 2033
- Table 72: Global HPAPI Industry Volume K Unit Forecast, by Poduct Type 2020 & 2033
- Table 73: Global HPAPI Industry Revenue Million Forecast, by Application 2020 & 2033
- Table 74: Global HPAPI Industry Volume K Unit Forecast, by Application 2020 & 2033
- Table 75: Global HPAPI Industry Revenue Million Forecast, by Synthesis 2020 & 2033
- Table 76: Global HPAPI Industry Volume K Unit Forecast, by Synthesis 2020 & 2033
- Table 77: Global HPAPI Industry Revenue Million Forecast, by Manufacturer 2020 & 2033
- Table 78: Global HPAPI Industry Volume K Unit Forecast, by Manufacturer 2020 & 2033
- Table 79: Global HPAPI Industry Revenue Million Forecast, by Country 2020 & 2033
- Table 80: Global HPAPI Industry Volume K Unit Forecast, by Country 2020 & 2033
- Table 81: GCC HPAPI Industry Revenue (Million) Forecast, by Application 2020 & 2033
- Table 82: GCC HPAPI Industry Volume (K Unit) Forecast, by Application 2020 & 2033
- Table 83: South Africa HPAPI Industry Revenue (Million) Forecast, by Application 2020 & 2033
- Table 84: South Africa HPAPI Industry Volume (K Unit) Forecast, by Application 2020 & 2033
- Table 85: Rest of Middle East and Africa HPAPI Industry Revenue (Million) Forecast, by Application 2020 & 2033
- Table 86: Rest of Middle East and Africa HPAPI Industry Volume (K Unit) Forecast, by Application 2020 & 2033
- Table 87: Global HPAPI Industry Revenue Million Forecast, by Poduct Type 2020 & 2033
- Table 88: Global HPAPI Industry Volume K Unit Forecast, by Poduct Type 2020 & 2033
- Table 89: Global HPAPI Industry Revenue Million Forecast, by Application 2020 & 2033
- Table 90: Global HPAPI Industry Volume K Unit Forecast, by Application 2020 & 2033
- Table 91: Global HPAPI Industry Revenue Million Forecast, by Synthesis 2020 & 2033
- Table 92: Global HPAPI Industry Volume K Unit Forecast, by Synthesis 2020 & 2033
- Table 93: Global HPAPI Industry Revenue Million Forecast, by Manufacturer 2020 & 2033
- Table 94: Global HPAPI Industry Volume K Unit Forecast, by Manufacturer 2020 & 2033
- Table 95: Global HPAPI Industry Revenue Million Forecast, by Country 2020 & 2033
- Table 96: Global HPAPI Industry Volume K Unit Forecast, by Country 2020 & 2033
- Table 97: Brazil HPAPI Industry Revenue (Million) Forecast, by Application 2020 & 2033
- Table 98: Brazil HPAPI Industry Volume (K Unit) Forecast, by Application 2020 & 2033
- Table 99: Argentina HPAPI Industry Revenue (Million) Forecast, by Application 2020 & 2033
- Table 100: Argentina HPAPI Industry Volume (K Unit) Forecast, by Application 2020 & 2033
- Table 101: Rest of South America HPAPI Industry Revenue (Million) Forecast, by Application 2020 & 2033
- Table 102: Rest of South America HPAPI Industry Volume (K Unit) Forecast, by Application 2020 & 2033
Frequently Asked Questions
1. What is the projected Compound Annual Growth Rate (CAGR) of the HPAPI Industry?
The projected CAGR is approximately 9.27%.
2. Which companies are prominent players in the HPAPI Industry?
Key companies in the market include Merck KGaA, Thermo Fisher Scientific Inc, Teva Pharmaceutical Industries Ltd, Sanofi (EUROAPI), AbbVie Inc, Corden Pharma International, Viatris Inc , Sun Pharmaceutical Industries Ltd, SK Biotek, Pfizer Inc.
3. What are the main segments of the HPAPI Industry?
The market segments include Poduct Type, Application, Synthesis, Manufacturer.
4. Can you provide details about the market size?
The market size is estimated to be USD 26.85 Million as of 2022.
5. What are some drivers contributing to market growth?
Increasing Demand for Pharmaceutical Drugs; Increasing Focus on Precision Medicine and High-potency APIs; Technological Advancements in High-potency API Manufacturing.
6. What are the notable trends driving market growth?
Generic High-potency Active Pharmaceutical Ingredients Segment is Expected to Record Significant Growth.
7. Are there any restraints impacting market growth?
Huge Capital Investment; Ever Changing Industry Standards and Guidelines.
8. Can you provide examples of recent developments in the market?
January 2023: Sai Life Sciences completed the construction of a new High-Potency API (HPAPI) manufacturing facility at its cGMP API Manufacturing site in Bidar, India. This addition significantly enhances the company's expertise in HPAPI development and production, providing customers with an expedited route for New Chemical Entity (NCE) development.
9. What pricing options are available for accessing the report?
Pricing options include single-user, multi-user, and enterprise licenses priced at USD 4750, USD 5250, and USD 8750 respectively.
10. Is the market size provided in terms of value or volume?
The market size is provided in terms of value, measured in Million and volume, measured in K Unit.
11. Are there any specific market keywords associated with the report?
Yes, the market keyword associated with the report is "HPAPI Industry," which aids in identifying and referencing the specific market segment covered.
12. How do I determine which pricing option suits my needs best?
The pricing options vary based on user requirements and access needs. Individual users may opt for single-user licenses, while businesses requiring broader access may choose multi-user or enterprise licenses for cost-effective access to the report.
13. Are there any additional resources or data provided in the HPAPI Industry report?
While the report offers comprehensive insights, it's advisable to review the specific contents or supplementary materials provided to ascertain if additional resources or data are available.
14. How can I stay updated on further developments or reports in the HPAPI Industry?
To stay informed about further developments, trends, and reports in the HPAPI Industry, consider subscribing to industry newsletters, following relevant companies and organizations, or regularly checking reputable industry news sources and publications.
Methodology
Step 1 - Identification of Relevant Samples Size from Population Database


Step 2 - Approaches for Defining Global Market Size (Value, Volume* & Price*)

Note*: In applicable scenarios
Step 3 - Data Sources
Primary Research
- Web Analytics
- Survey Reports
- Research Institute
- Latest Research Reports
- Opinion Leaders
Secondary Research
- Annual Reports
- White Paper
- Latest Press Release
- Industry Association
- Paid Database
- Investor Presentations

Step 4 - Data Triangulation
Involves using different sources of information in order to increase the validity of a study
These sources are likely to be stakeholders in a program - participants, other researchers, program staff, other community members, and so on.
Then we put all data in single framework & apply various statistical tools to find out the dynamic on the market.
During the analysis stage, feedback from the stakeholder groups would be compared to determine areas of agreement as well as areas of divergence