

Key Insights
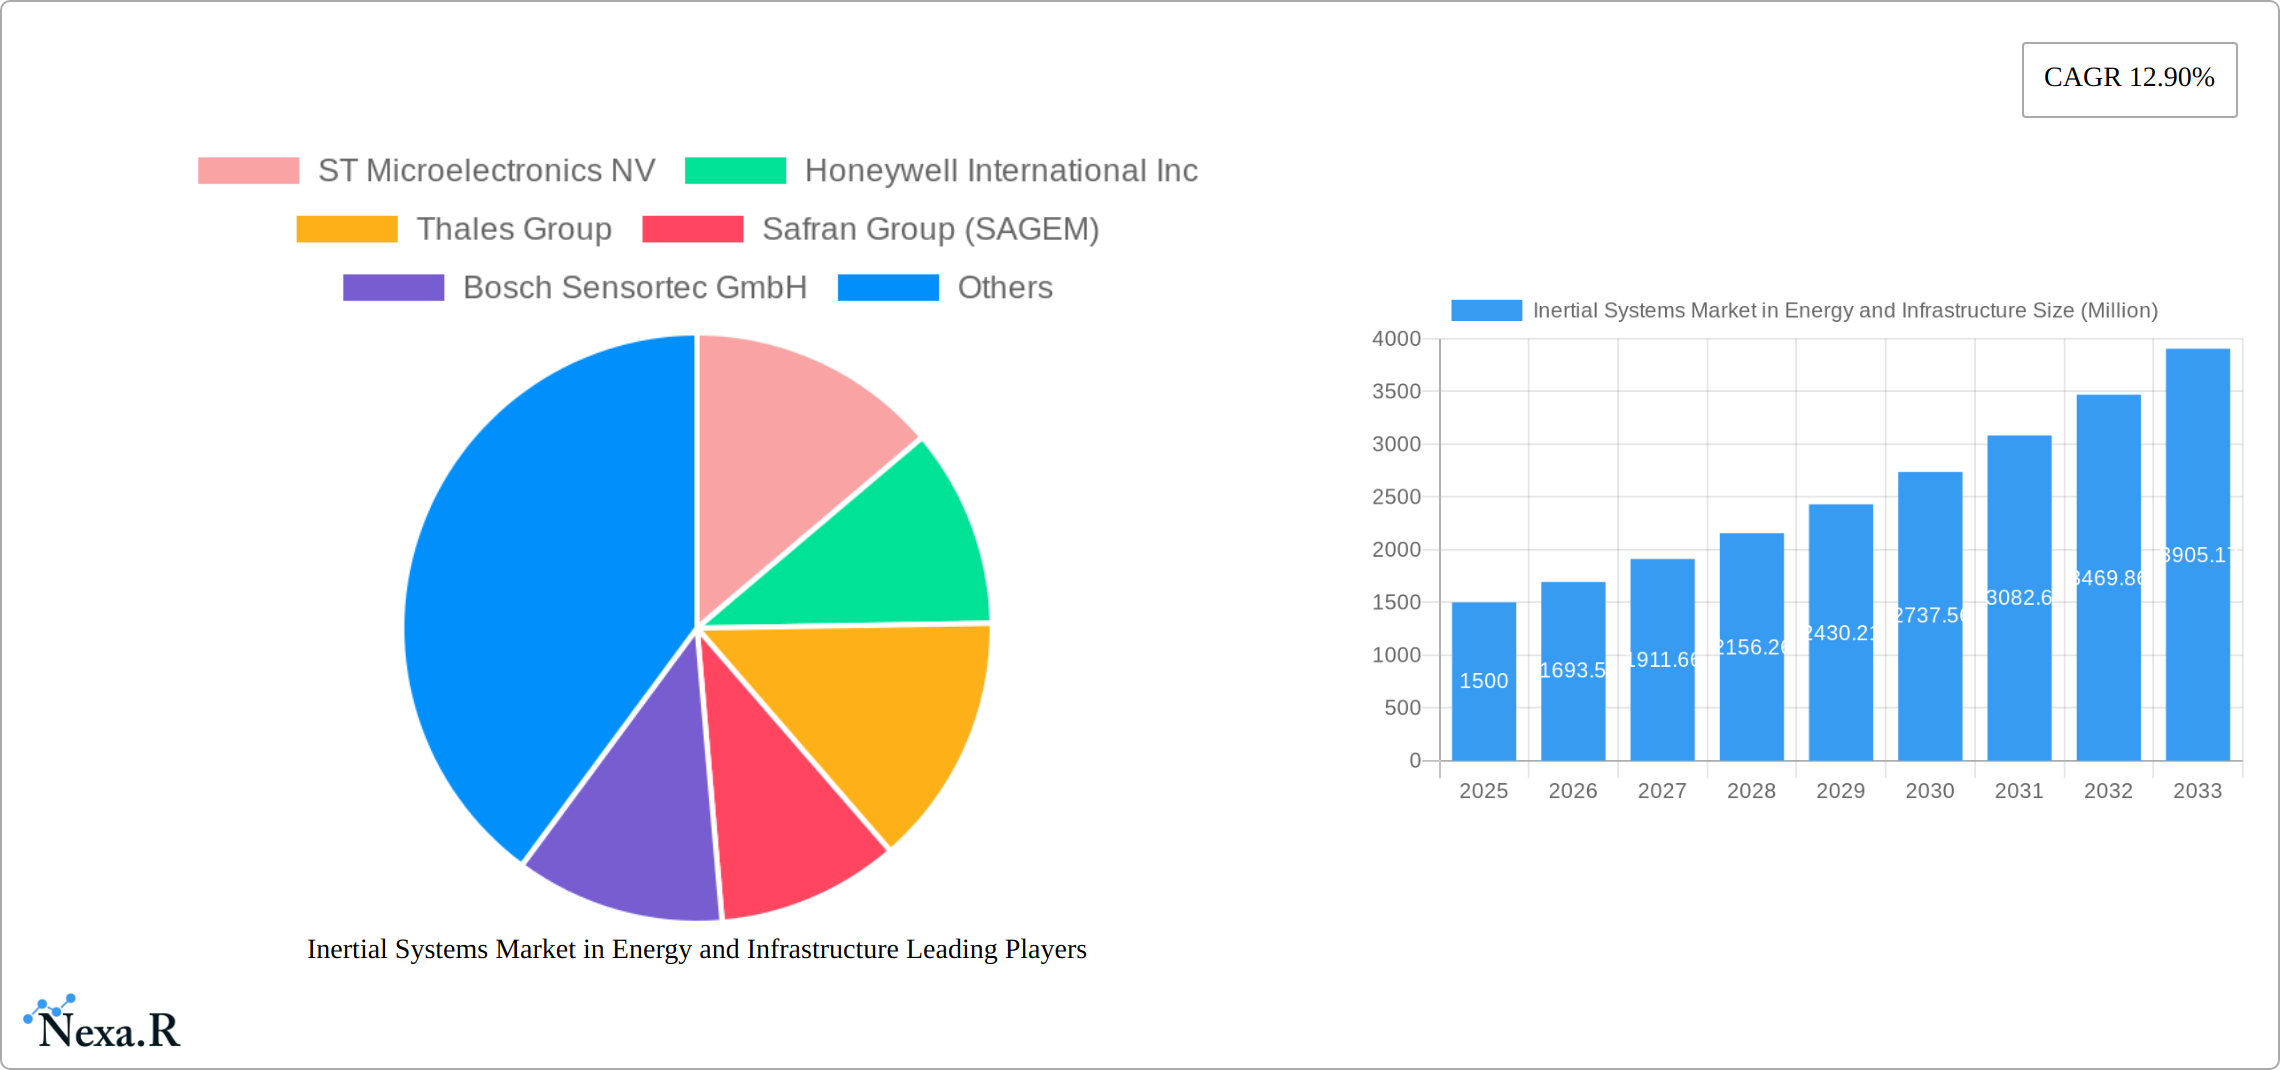
The Inertial Measurement Unit (IMU) and inertial navigation system market within the energy and infrastructure sectors is experiencing robust growth, projected at a compound annual growth rate (CAGR) of 12.90% from 2025 to 2033. This expansion is driven by several key factors. Firstly, the increasing adoption of automation and robotics in infrastructure development and energy resource extraction is fueling demand for precise positioning and navigation systems. Secondly, advancements in sensor technology, leading to smaller, more energy-efficient, and cost-effective IMUs, are making them accessible for a wider range of applications. Finally, the growing need for enhanced safety and operational efficiency in both energy and infrastructure projects contributes significantly to market growth. Standalone accelerometers and gyroscopes currently dominate the component segment, but integrated IMUs and Attitude Heading and Reference Systems (AHRS) are gaining traction due to their superior performance and integration capabilities. The North American market currently holds a significant share, driven by substantial investments in infrastructure modernization and renewable energy projects. However, Asia-Pacific is poised for rapid growth due to its expanding energy sector and large-scale infrastructure development initiatives. While challenges such as high initial investment costs and the complexity of integrating inertial systems into existing infrastructure may present some restraints, the overall market outlook remains overwhelmingly positive.
The competitive landscape is characterized by established players like STMicroelectronics, Honeywell, and Thales, alongside specialized sensor technology companies like Bosch Sensortec and Invensense. These companies are actively engaged in research and development to improve sensor accuracy, reliability, and miniaturization. Furthermore, strategic partnerships and mergers and acquisitions are expected to further shape the market landscape in the coming years. The market segmentation across various regions (North America, Europe, Asia-Pacific, etc.) reveals significant regional variations in growth rates, reflecting the varying levels of investment in infrastructure and energy projects. Companies are focusing on providing customized solutions tailored to specific industry needs, such as oil and gas exploration, smart grids, and building automation, thereby further driving market growth.
This comprehensive report provides an in-depth analysis of the Inertial Systems market within the Energy and Infrastructure sectors, offering invaluable insights for industry professionals, investors, and strategic decision-makers. The report covers the period from 2019 to 2033, with a focus on the forecast period of 2025-2033 and a base year of 2025. The market is segmented by component (Standalone Accelerometers & Gyroscopes, Integrated IMUs & AHRS), industry (Energy, Infrastructure), and region (North America, Europe, Asia-Pacific). Key players analyzed include ST Microelectronics NV, Honeywell International Inc, Thales Group, Safran Group (SAGEM), Bosch Sensortec GmbH, Vector NAV Technologies, Invensense Inc, Silicon Sensing Systems Ltd, Analog Devices Inc, and Northrop Grumman Corporation. The report's projected market value is xx Million USD.
Inertial Systems Market in Energy and Infrastructure Market Dynamics & Structure
This section analyzes the market's competitive landscape, technological advancements, and regulatory influences. The market is moderately concentrated, with the top five players holding an estimated 60% market share in 2025. Technological innovation, driven by advancements in MEMS technology and increased demand for higher accuracy and miniaturization, is a key growth driver. Stringent safety and performance standards within the energy and infrastructure sectors, however, present regulatory hurdles. The emergence of alternative technologies, such as GPS and vision systems, poses competitive pressure. Mergers and acquisitions (M&A) activity has been moderate, with an estimated xx deals completed between 2019 and 2024. The energy sector exhibits higher adoption rates compared to infrastructure due to the increasing need for precise monitoring and control in renewable energy installations and oil & gas operations.
- Market Concentration: Moderately concentrated, top 5 players holding ~60% market share in 2025.
- Technological Innovation: Advancements in MEMS, miniaturization, and accuracy are key drivers.
- Regulatory Framework: Stringent safety standards impacting adoption and market entry.
- Competitive Substitutes: GPS, vision systems present competitive pressure.
- M&A Activity: xx deals completed between 2019 and 2024.
- End-User Demographics: Higher adoption in energy sector compared to infrastructure.
Inertial Systems Market in Energy and Infrastructure Growth Trends & Insights
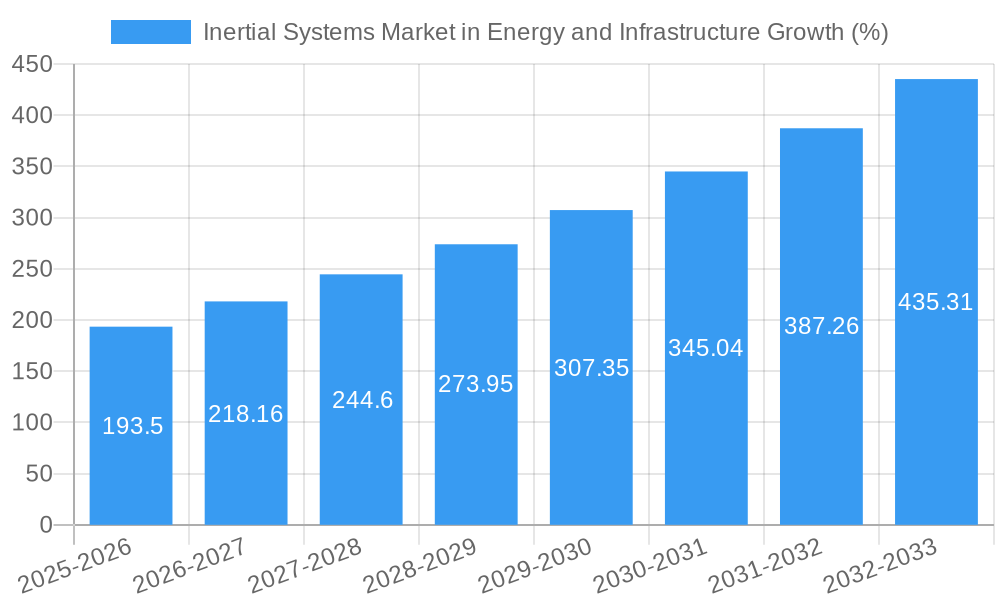
The Inertial Systems market in energy and infrastructure exhibits a strong growth trajectory, driven by the increasing adoption of smart grids, automation in oil & gas operations, and infrastructure development projects globally. The market size grew from xx Million USD in 2019 to xx Million USD in 2024, registering a CAGR of xx%. The forecast period (2025-2033) projects continued growth, reaching xx Million USD by 2033, with a projected CAGR of xx%. This growth is fueled by technological advancements, increasing demand for precise positioning and motion tracking, and government initiatives promoting smart infrastructure and renewable energy. Market penetration is expected to increase from xx% in 2025 to xx% by 2033. Consumer behavior shifts towards demand for higher reliability and lower latency are also driving market expansion. The increasing use of IoT devices in the energy and infrastructure sectors is a key trend propelling market growth. Challenges remain in terms of cost reduction and integration complexity.
Dominant Regions, Countries, or Segments in Inertial Systems Market in Energy and Infrastructure
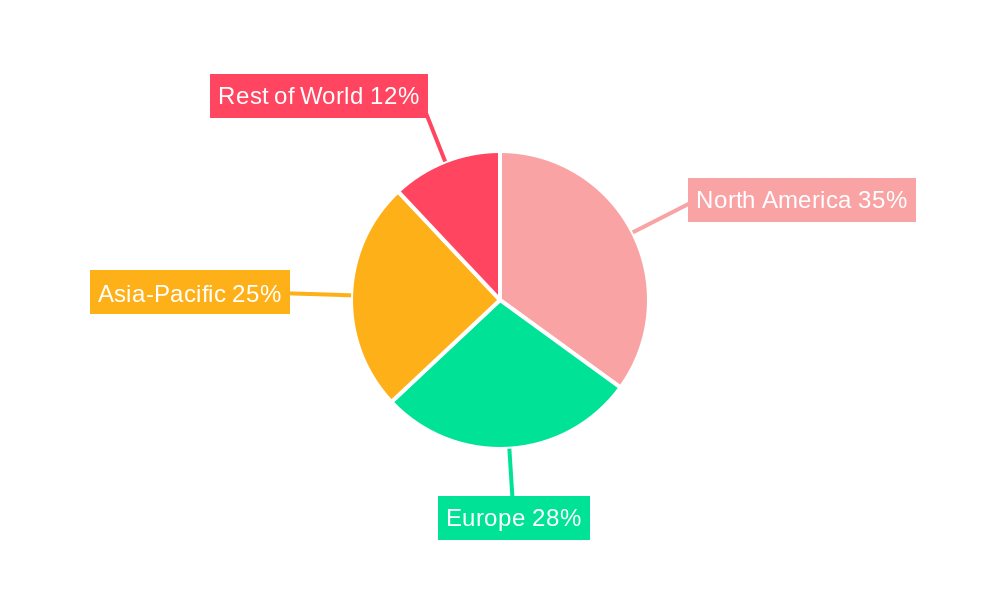
North America currently dominates the market, holding the largest market share in 2025 due to significant investments in renewable energy and advanced infrastructure projects. Europe follows closely, driven by strong government support for smart city initiatives and robust industrial automation. Asia-Pacific is projected to witness the fastest growth during the forecast period, fueled by rapid urbanization, industrialization, and increasing adoption of smart technologies across various sectors. Within components, integrated IMUs and AHRS systems are driving growth due to their superior performance and ease of integration. The energy sector currently commands a larger market share compared to infrastructure but both industries show high growth potential.
- North America: Largest market share in 2025 driven by investments in renewable energy and infrastructure.
- Europe: Strong growth driven by smart city initiatives and industrial automation.
- Asia-Pacific: Fastest growth projected due to urbanization, industrialization, and technology adoption.
- Component Segment: Integrated IMUs and AHRS systems show highest growth.
- Industry Segment: Energy sector holds larger share but both energy and infrastructure exhibit strong potential.
Inertial Systems Market in Energy and Infrastructure Product Landscape
The market offers a wide range of inertial systems, from basic standalone accelerometers and gyroscopes to sophisticated integrated IMUs and AHRS units. Recent innovations focus on improved accuracy, miniaturization, power efficiency, and enhanced integration capabilities. Key performance metrics include accuracy, bias stability, and noise characteristics. Unique selling propositions include advanced algorithms for improved performance in challenging environments and optimized power consumption for extended operational life. Technological advancements include the integration of sensors and processing units for enhanced functionality and reduced system complexity.
Key Drivers, Barriers & Challenges in Inertial Systems Market in Energy and Infrastructure
Key Drivers: The increasing demand for accurate positioning and motion tracking in various applications within the energy and infrastructure sectors is a primary growth driver. Government initiatives promoting smart infrastructure and renewable energy technologies are also contributing significantly. The growing adoption of IoT devices and automation technologies further accelerates market growth.
Key Challenges: High initial investment costs and complex integration processes pose barriers to wider adoption. Supply chain disruptions and the increasing cost of raw materials impact production costs and profitability. Stringent safety and regulatory standards increase compliance costs and limit market entry for new players. Intense competition from established players and the emergence of alternative technologies create further challenges.
Emerging Opportunities in Inertial Systems Market in Energy and Infrastructure
Untapped markets in developing economies, particularly in Asia-Pacific, present significant opportunities for growth. The rising adoption of autonomous vehicles, drones, and robotics in infrastructure monitoring and maintenance creates new application areas. Innovations in low-power, high-accuracy inertial sensors will unlock new possibilities in wearable technologies and remote sensing applications. The integration of inertial systems with other sensor technologies, like GPS and vision systems, creates enhanced positioning and navigation capabilities.
Growth Accelerators in the Inertial Systems Market in Energy and Infrastructure Industry
Technological breakthroughs in MEMS technology, leading to more compact, accurate, and power-efficient inertial systems, are key growth accelerators. Strategic partnerships and collaborations between sensor manufacturers and system integrators facilitate faster product development and market penetration. Market expansion strategies focusing on emerging economies and new application areas further accelerate market growth. Government policies promoting renewable energy and smart infrastructure create favorable market conditions.
Key Players Shaping the Inertial Systems Market in Energy and Infrastructure Market
- ST Microelectronics NV
- Honeywell International Inc
- Thales Group
- Safran Group (SAGEM)
- Bosch Sensortec GmbH
- Vector NAV Technologies
- Invensense Inc
- Silicon Sensing Systems Ltd
- Analog Devices Inc
- Northrop Grumman Corporation
Notable Milestones in Inertial Systems Market in Energy and Infrastructure Sector
- 2020: STMicroelectronics launches a new generation of high-accuracy IMUs.
- 2022: Honeywell acquires a smaller inertial sensor manufacturer, expanding its product portfolio.
- 2023: Bosch Sensortec introduces a new low-power inertial sensor for wearable applications.
- 2024: Several significant partnerships are formed between sensor manufacturers and infrastructure companies for smart city projects.
In-Depth Inertial Systems Market in Energy and Infrastructure Market Outlook
The Inertial Systems market in energy and infrastructure is poised for significant growth in the coming years, driven by ongoing technological advancements, increasing demand for accurate positioning and motion tracking, and strong government support for smart infrastructure development. Strategic opportunities lie in focusing on emerging markets, developing innovative sensor technologies, and establishing strategic partnerships with key players in the energy and infrastructure sectors. The market is expected to witness a shift towards more integrated and sophisticated systems, incorporating advanced algorithms and machine learning capabilities for enhanced performance and reliability. The potential for long-term growth is substantial, providing ample opportunities for both established players and new entrants.
Inertial Systems Market in Energy and Infrastructure Segmentation
-
1. Component
- 1.1. Standalone (Accelerometers Gyroscope)
- 1.2. Integrat
Inertial Systems Market in Energy and Infrastructure Segmentation By Geography
- 1. North America
- 2. Europe
- 3. Asia Pacific
- 4. Latin America
- 5. Middle East and Africa
Inertial Systems Market in Energy and Infrastructure REPORT HIGHLIGHTS
| Aspects | Details |
|---|---|
| Study Period | 2019-2033 |
| Base Year | 2024 |
| Estimated Year | 2025 |
| Forecast Period | 2025-2033 |
| Historical Period | 2019-2024 |
| Growth Rate | CAGR of 12.90% from 2019-2033 |
| Segmentation |
|
Table of Contents
- 1. Introduction
- 1.1. Research Scope
- 1.2. Market Segmentation
- 1.3. Research Methodology
- 1.4. Definitions and Assumptions
- 2. Executive Summary
- 2.1. Introduction
- 3. Market Dynamics
- 3.1. Introduction
- 3.2. Market Drivers
- 3.2.1. ; Emergence of MEMS Technology; Increasing Applications Based on Motion Sensing
- 3.3. Market Restrains
- 3.3.1. ; Integration Drift Error
- 3.4. Market Trends
- 3.4.1. MEMs to Hold Significant Market Growth in the Oil and Gas Sector
- 4. Market Factor Analysis
- 4.1. Porters Five Forces
- 4.2. Supply/Value Chain
- 4.3. PESTEL analysis
- 4.4. Market Entropy
- 4.5. Patent/Trademark Analysis
- 5. Global Inertial Systems Market in Energy and Infrastructure Analysis, Insights and Forecast, 2019-2031
- 5.1. Market Analysis, Insights and Forecast - by Component
- 5.1.1. Standalone (Accelerometers Gyroscope)
- 5.1.2. Integrat
- 5.2. Market Analysis, Insights and Forecast - by Region
- 5.2.1. North America
- 5.2.2. Europe
- 5.2.3. Asia Pacific
- 5.2.4. Latin America
- 5.2.5. Middle East and Africa
- 5.1. Market Analysis, Insights and Forecast - by Component
- 6. North America Inertial Systems Market in Energy and Infrastructure Analysis, Insights and Forecast, 2019-2031
- 6.1. Market Analysis, Insights and Forecast - by Component
- 6.1.1. Standalone (Accelerometers Gyroscope)
- 6.1.2. Integrat
- 6.1. Market Analysis, Insights and Forecast - by Component
- 7. Europe Inertial Systems Market in Energy and Infrastructure Analysis, Insights and Forecast, 2019-2031
- 7.1. Market Analysis, Insights and Forecast - by Component
- 7.1.1. Standalone (Accelerometers Gyroscope)
- 7.1.2. Integrat
- 7.1. Market Analysis, Insights and Forecast - by Component
- 8. Asia Pacific Inertial Systems Market in Energy and Infrastructure Analysis, Insights and Forecast, 2019-2031
- 8.1. Market Analysis, Insights and Forecast - by Component
- 8.1.1. Standalone (Accelerometers Gyroscope)
- 8.1.2. Integrat
- 8.1. Market Analysis, Insights and Forecast - by Component
- 9. Latin America Inertial Systems Market in Energy and Infrastructure Analysis, Insights and Forecast, 2019-2031
- 9.1. Market Analysis, Insights and Forecast - by Component
- 9.1.1. Standalone (Accelerometers Gyroscope)
- 9.1.2. Integrat
- 9.1. Market Analysis, Insights and Forecast - by Component
- 10. Middle East and Africa Inertial Systems Market in Energy and Infrastructure Analysis, Insights and Forecast, 2019-2031
- 10.1. Market Analysis, Insights and Forecast - by Component
- 10.1.1. Standalone (Accelerometers Gyroscope)
- 10.1.2. Integrat
- 10.1. Market Analysis, Insights and Forecast - by Component
- 11. North America Inertial Systems Market in Energy and Infrastructure Analysis, Insights and Forecast, 2019-2031
- 11.1. Market Analysis, Insights and Forecast - By Country/Sub-region
- 11.1.1 United States
- 11.1.2 Canada
- 11.1.3 Mexico
- 12. Europe Inertial Systems Market in Energy and Infrastructure Analysis, Insights and Forecast, 2019-2031
- 12.1. Market Analysis, Insights and Forecast - By Country/Sub-region
- 12.1.1 Germany
- 12.1.2 United Kingdom
- 12.1.3 France
- 12.1.4 Spain
- 12.1.5 Italy
- 12.1.6 Spain
- 12.1.7 Belgium
- 12.1.8 Netherland
- 12.1.9 Nordics
- 12.1.10 Rest of Europe
- 13. Asia Pacific Inertial Systems Market in Energy and Infrastructure Analysis, Insights and Forecast, 2019-2031
- 13.1. Market Analysis, Insights and Forecast - By Country/Sub-region
- 13.1.1 China
- 13.1.2 Japan
- 13.1.3 India
- 13.1.4 South Korea
- 13.1.5 Southeast Asia
- 13.1.6 Australia
- 13.1.7 Indonesia
- 13.1.8 Phillipes
- 13.1.9 Singapore
- 13.1.10 Thailandc
- 13.1.11 Rest of Asia Pacific
- 14. South America Inertial Systems Market in Energy and Infrastructure Analysis, Insights and Forecast, 2019-2031
- 14.1. Market Analysis, Insights and Forecast - By Country/Sub-region
- 14.1.1 Brazil
- 14.1.2 Argentina
- 14.1.3 Peru
- 14.1.4 Chile
- 14.1.5 Colombia
- 14.1.6 Ecuador
- 14.1.7 Venezuela
- 14.1.8 Rest of South America
- 15. MEA Inertial Systems Market in Energy and Infrastructure Analysis, Insights and Forecast, 2019-2031
- 15.1. Market Analysis, Insights and Forecast - By Country/Sub-region
- 15.1.1 United Arab Emirates
- 15.1.2 Saudi Arabia
- 15.1.3 South Africa
- 15.1.4 Rest of Middle East and Africa
- 16. Competitive Analysis
- 16.1. Global Market Share Analysis 2024
- 16.2. Company Profiles
- 16.2.1 ST Microelectronics NV
- 16.2.1.1. Overview
- 16.2.1.2. Products
- 16.2.1.3. SWOT Analysis
- 16.2.1.4. Recent Developments
- 16.2.1.5. Financials (Based on Availability)
- 16.2.2 Honeywell International Inc
- 16.2.2.1. Overview
- 16.2.2.2. Products
- 16.2.2.3. SWOT Analysis
- 16.2.2.4. Recent Developments
- 16.2.2.5. Financials (Based on Availability)
- 16.2.3 Thales Group
- 16.2.3.1. Overview
- 16.2.3.2. Products
- 16.2.3.3. SWOT Analysis
- 16.2.3.4. Recent Developments
- 16.2.3.5. Financials (Based on Availability)
- 16.2.4 Safran Group (SAGEM)
- 16.2.4.1. Overview
- 16.2.4.2. Products
- 16.2.4.3. SWOT Analysis
- 16.2.4.4. Recent Developments
- 16.2.4.5. Financials (Based on Availability)
- 16.2.5 Bosch Sensortec GmbH
- 16.2.5.1. Overview
- 16.2.5.2. Products
- 16.2.5.3. SWOT Analysis
- 16.2.5.4. Recent Developments
- 16.2.5.5. Financials (Based on Availability)
- 16.2.6 Vector NAV Technologies
- 16.2.6.1. Overview
- 16.2.6.2. Products
- 16.2.6.3. SWOT Analysis
- 16.2.6.4. Recent Developments
- 16.2.6.5. Financials (Based on Availability)
- 16.2.7 Invensense Inc
- 16.2.7.1. Overview
- 16.2.7.2. Products
- 16.2.7.3. SWOT Analysis
- 16.2.7.4. Recent Developments
- 16.2.7.5. Financials (Based on Availability)
- 16.2.8 Silicon Sensing Systems Ltd
- 16.2.8.1. Overview
- 16.2.8.2. Products
- 16.2.8.3. SWOT Analysis
- 16.2.8.4. Recent Developments
- 16.2.8.5. Financials (Based on Availability)
- 16.2.9 Analog Devices Inc
- 16.2.9.1. Overview
- 16.2.9.2. Products
- 16.2.9.3. SWOT Analysis
- 16.2.9.4. Recent Developments
- 16.2.9.5. Financials (Based on Availability)
- 16.2.10 Northrop Grumman Corporation
- 16.2.10.1. Overview
- 16.2.10.2. Products
- 16.2.10.3. SWOT Analysis
- 16.2.10.4. Recent Developments
- 16.2.10.5. Financials (Based on Availability)
- 16.2.1 ST Microelectronics NV
List of Figures
- Figure 1: Global Inertial Systems Market in Energy and Infrastructure Revenue Breakdown (Million, %) by Region 2024 & 2032
- Figure 2: North America Inertial Systems Market in Energy and Infrastructure Revenue (Million), by Country 2024 & 2032
- Figure 3: North America Inertial Systems Market in Energy and Infrastructure Revenue Share (%), by Country 2024 & 2032
- Figure 4: Europe Inertial Systems Market in Energy and Infrastructure Revenue (Million), by Country 2024 & 2032
- Figure 5: Europe Inertial Systems Market in Energy and Infrastructure Revenue Share (%), by Country 2024 & 2032
- Figure 6: Asia Pacific Inertial Systems Market in Energy and Infrastructure Revenue (Million), by Country 2024 & 2032
- Figure 7: Asia Pacific Inertial Systems Market in Energy and Infrastructure Revenue Share (%), by Country 2024 & 2032
- Figure 8: South America Inertial Systems Market in Energy and Infrastructure Revenue (Million), by Country 2024 & 2032
- Figure 9: South America Inertial Systems Market in Energy and Infrastructure Revenue Share (%), by Country 2024 & 2032
- Figure 10: MEA Inertial Systems Market in Energy and Infrastructure Revenue (Million), by Country 2024 & 2032
- Figure 11: MEA Inertial Systems Market in Energy and Infrastructure Revenue Share (%), by Country 2024 & 2032
- Figure 12: North America Inertial Systems Market in Energy and Infrastructure Revenue (Million), by Component 2024 & 2032
- Figure 13: North America Inertial Systems Market in Energy and Infrastructure Revenue Share (%), by Component 2024 & 2032
- Figure 14: North America Inertial Systems Market in Energy and Infrastructure Revenue (Million), by Country 2024 & 2032
- Figure 15: North America Inertial Systems Market in Energy and Infrastructure Revenue Share (%), by Country 2024 & 2032
- Figure 16: Europe Inertial Systems Market in Energy and Infrastructure Revenue (Million), by Component 2024 & 2032
- Figure 17: Europe Inertial Systems Market in Energy and Infrastructure Revenue Share (%), by Component 2024 & 2032
- Figure 18: Europe Inertial Systems Market in Energy and Infrastructure Revenue (Million), by Country 2024 & 2032
- Figure 19: Europe Inertial Systems Market in Energy and Infrastructure Revenue Share (%), by Country 2024 & 2032
- Figure 20: Asia Pacific Inertial Systems Market in Energy and Infrastructure Revenue (Million), by Component 2024 & 2032
- Figure 21: Asia Pacific Inertial Systems Market in Energy and Infrastructure Revenue Share (%), by Component 2024 & 2032
- Figure 22: Asia Pacific Inertial Systems Market in Energy and Infrastructure Revenue (Million), by Country 2024 & 2032
- Figure 23: Asia Pacific Inertial Systems Market in Energy and Infrastructure Revenue Share (%), by Country 2024 & 2032
- Figure 24: Latin America Inertial Systems Market in Energy and Infrastructure Revenue (Million), by Component 2024 & 2032
- Figure 25: Latin America Inertial Systems Market in Energy and Infrastructure Revenue Share (%), by Component 2024 & 2032
- Figure 26: Latin America Inertial Systems Market in Energy and Infrastructure Revenue (Million), by Country 2024 & 2032
- Figure 27: Latin America Inertial Systems Market in Energy and Infrastructure Revenue Share (%), by Country 2024 & 2032
- Figure 28: Middle East and Africa Inertial Systems Market in Energy and Infrastructure Revenue (Million), by Component 2024 & 2032
- Figure 29: Middle East and Africa Inertial Systems Market in Energy and Infrastructure Revenue Share (%), by Component 2024 & 2032
- Figure 30: Middle East and Africa Inertial Systems Market in Energy and Infrastructure Revenue (Million), by Country 2024 & 2032
- Figure 31: Middle East and Africa Inertial Systems Market in Energy and Infrastructure Revenue Share (%), by Country 2024 & 2032
List of Tables
- Table 1: Global Inertial Systems Market in Energy and Infrastructure Revenue Million Forecast, by Region 2019 & 2032
- Table 2: Global Inertial Systems Market in Energy and Infrastructure Revenue Million Forecast, by Component 2019 & 2032
- Table 3: Global Inertial Systems Market in Energy and Infrastructure Revenue Million Forecast, by Region 2019 & 2032
- Table 4: Global Inertial Systems Market in Energy and Infrastructure Revenue Million Forecast, by Country 2019 & 2032
- Table 5: United States Inertial Systems Market in Energy and Infrastructure Revenue (Million) Forecast, by Application 2019 & 2032
- Table 6: Canada Inertial Systems Market in Energy and Infrastructure Revenue (Million) Forecast, by Application 2019 & 2032
- Table 7: Mexico Inertial Systems Market in Energy and Infrastructure Revenue (Million) Forecast, by Application 2019 & 2032
- Table 8: Global Inertial Systems Market in Energy and Infrastructure Revenue Million Forecast, by Country 2019 & 2032
- Table 9: Germany Inertial Systems Market in Energy and Infrastructure Revenue (Million) Forecast, by Application 2019 & 2032
- Table 10: United Kingdom Inertial Systems Market in Energy and Infrastructure Revenue (Million) Forecast, by Application 2019 & 2032
- Table 11: France Inertial Systems Market in Energy and Infrastructure Revenue (Million) Forecast, by Application 2019 & 2032
- Table 12: Spain Inertial Systems Market in Energy and Infrastructure Revenue (Million) Forecast, by Application 2019 & 2032
- Table 13: Italy Inertial Systems Market in Energy and Infrastructure Revenue (Million) Forecast, by Application 2019 & 2032
- Table 14: Spain Inertial Systems Market in Energy and Infrastructure Revenue (Million) Forecast, by Application 2019 & 2032
- Table 15: Belgium Inertial Systems Market in Energy and Infrastructure Revenue (Million) Forecast, by Application 2019 & 2032
- Table 16: Netherland Inertial Systems Market in Energy and Infrastructure Revenue (Million) Forecast, by Application 2019 & 2032
- Table 17: Nordics Inertial Systems Market in Energy and Infrastructure Revenue (Million) Forecast, by Application 2019 & 2032
- Table 18: Rest of Europe Inertial Systems Market in Energy and Infrastructure Revenue (Million) Forecast, by Application 2019 & 2032
- Table 19: Global Inertial Systems Market in Energy and Infrastructure Revenue Million Forecast, by Country 2019 & 2032
- Table 20: China Inertial Systems Market in Energy and Infrastructure Revenue (Million) Forecast, by Application 2019 & 2032
- Table 21: Japan Inertial Systems Market in Energy and Infrastructure Revenue (Million) Forecast, by Application 2019 & 2032
- Table 22: India Inertial Systems Market in Energy and Infrastructure Revenue (Million) Forecast, by Application 2019 & 2032
- Table 23: South Korea Inertial Systems Market in Energy and Infrastructure Revenue (Million) Forecast, by Application 2019 & 2032
- Table 24: Southeast Asia Inertial Systems Market in Energy and Infrastructure Revenue (Million) Forecast, by Application 2019 & 2032
- Table 25: Australia Inertial Systems Market in Energy and Infrastructure Revenue (Million) Forecast, by Application 2019 & 2032
- Table 26: Indonesia Inertial Systems Market in Energy and Infrastructure Revenue (Million) Forecast, by Application 2019 & 2032
- Table 27: Phillipes Inertial Systems Market in Energy and Infrastructure Revenue (Million) Forecast, by Application 2019 & 2032
- Table 28: Singapore Inertial Systems Market in Energy and Infrastructure Revenue (Million) Forecast, by Application 2019 & 2032
- Table 29: Thailandc Inertial Systems Market in Energy and Infrastructure Revenue (Million) Forecast, by Application 2019 & 2032
- Table 30: Rest of Asia Pacific Inertial Systems Market in Energy and Infrastructure Revenue (Million) Forecast, by Application 2019 & 2032
- Table 31: Global Inertial Systems Market in Energy and Infrastructure Revenue Million Forecast, by Country 2019 & 2032
- Table 32: Brazil Inertial Systems Market in Energy and Infrastructure Revenue (Million) Forecast, by Application 2019 & 2032
- Table 33: Argentina Inertial Systems Market in Energy and Infrastructure Revenue (Million) Forecast, by Application 2019 & 2032
- Table 34: Peru Inertial Systems Market in Energy and Infrastructure Revenue (Million) Forecast, by Application 2019 & 2032
- Table 35: Chile Inertial Systems Market in Energy and Infrastructure Revenue (Million) Forecast, by Application 2019 & 2032
- Table 36: Colombia Inertial Systems Market in Energy and Infrastructure Revenue (Million) Forecast, by Application 2019 & 2032
- Table 37: Ecuador Inertial Systems Market in Energy and Infrastructure Revenue (Million) Forecast, by Application 2019 & 2032
- Table 38: Venezuela Inertial Systems Market in Energy and Infrastructure Revenue (Million) Forecast, by Application 2019 & 2032
- Table 39: Rest of South America Inertial Systems Market in Energy and Infrastructure Revenue (Million) Forecast, by Application 2019 & 2032
- Table 40: Global Inertial Systems Market in Energy and Infrastructure Revenue Million Forecast, by Country 2019 & 2032
- Table 41: United Arab Emirates Inertial Systems Market in Energy and Infrastructure Revenue (Million) Forecast, by Application 2019 & 2032
- Table 42: Saudi Arabia Inertial Systems Market in Energy and Infrastructure Revenue (Million) Forecast, by Application 2019 & 2032
- Table 43: South Africa Inertial Systems Market in Energy and Infrastructure Revenue (Million) Forecast, by Application 2019 & 2032
- Table 44: Rest of Middle East and Africa Inertial Systems Market in Energy and Infrastructure Revenue (Million) Forecast, by Application 2019 & 2032
- Table 45: Global Inertial Systems Market in Energy and Infrastructure Revenue Million Forecast, by Component 2019 & 2032
- Table 46: Global Inertial Systems Market in Energy and Infrastructure Revenue Million Forecast, by Country 2019 & 2032
- Table 47: Global Inertial Systems Market in Energy and Infrastructure Revenue Million Forecast, by Component 2019 & 2032
- Table 48: Global Inertial Systems Market in Energy and Infrastructure Revenue Million Forecast, by Country 2019 & 2032
- Table 49: Global Inertial Systems Market in Energy and Infrastructure Revenue Million Forecast, by Component 2019 & 2032
- Table 50: Global Inertial Systems Market in Energy and Infrastructure Revenue Million Forecast, by Country 2019 & 2032
- Table 51: Global Inertial Systems Market in Energy and Infrastructure Revenue Million Forecast, by Component 2019 & 2032
- Table 52: Global Inertial Systems Market in Energy and Infrastructure Revenue Million Forecast, by Country 2019 & 2032
- Table 53: Global Inertial Systems Market in Energy and Infrastructure Revenue Million Forecast, by Component 2019 & 2032
- Table 54: Global Inertial Systems Market in Energy and Infrastructure Revenue Million Forecast, by Country 2019 & 2032
Frequently Asked Questions
1. What is the projected Compound Annual Growth Rate (CAGR) of the Inertial Systems Market in Energy and Infrastructure?
The projected CAGR is approximately 12.90%.
2. Which companies are prominent players in the Inertial Systems Market in Energy and Infrastructure?
Key companies in the market include ST Microelectronics NV, Honeywell International Inc, Thales Group, Safran Group (SAGEM), Bosch Sensortec GmbH, Vector NAV Technologies, Invensense Inc, Silicon Sensing Systems Ltd, Analog Devices Inc, Northrop Grumman Corporation.
3. What are the main segments of the Inertial Systems Market in Energy and Infrastructure?
The market segments include Component.
4. Can you provide details about the market size?
The market size is estimated to be USD XX Million as of 2022.
5. What are some drivers contributing to market growth?
; Emergence of MEMS Technology; Increasing Applications Based on Motion Sensing.
6. What are the notable trends driving market growth?
MEMs to Hold Significant Market Growth in the Oil and Gas Sector.
7. Are there any restraints impacting market growth?
; Integration Drift Error.
8. Can you provide examples of recent developments in the market?
N/A
9. What pricing options are available for accessing the report?
Pricing options include single-user, multi-user, and enterprise licenses priced at USD 4750, USD 5250, and USD 8750 respectively.
10. Is the market size provided in terms of value or volume?
The market size is provided in terms of value, measured in Million.
11. Are there any specific market keywords associated with the report?
Yes, the market keyword associated with the report is "Inertial Systems Market in Energy and Infrastructure," which aids in identifying and referencing the specific market segment covered.
12. How do I determine which pricing option suits my needs best?
The pricing options vary based on user requirements and access needs. Individual users may opt for single-user licenses, while businesses requiring broader access may choose multi-user or enterprise licenses for cost-effective access to the report.
13. Are there any additional resources or data provided in the Inertial Systems Market in Energy and Infrastructure report?
While the report offers comprehensive insights, it's advisable to review the specific contents or supplementary materials provided to ascertain if additional resources or data are available.
14. How can I stay updated on further developments or reports in the Inertial Systems Market in Energy and Infrastructure?
To stay informed about further developments, trends, and reports in the Inertial Systems Market in Energy and Infrastructure, consider subscribing to industry newsletters, following relevant companies and organizations, or regularly checking reputable industry news sources and publications.
Methodology
Step 1 - Identification of Relevant Samples Size from Population Database


Step 2 - Approaches for Defining Global Market Size (Value, Volume* & Price*)

Note*: In applicable scenarios
Step 3 - Data Sources
Primary Research
- Web Analytics
- Survey Reports
- Research Institute
- Latest Research Reports
- Opinion Leaders
Secondary Research
- Annual Reports
- White Paper
- Latest Press Release
- Industry Association
- Paid Database
- Investor Presentations

Step 4 - Data Triangulation
Involves using different sources of information in order to increase the validity of a study
These sources are likely to be stakeholders in a program - participants, other researchers, program staff, other community members, and so on.
Then we put all data in single framework & apply various statistical tools to find out the dynamic on the market.
During the analysis stage, feedback from the stakeholder groups would be compared to determine areas of agreement as well as areas of divergence
