

Key Insights
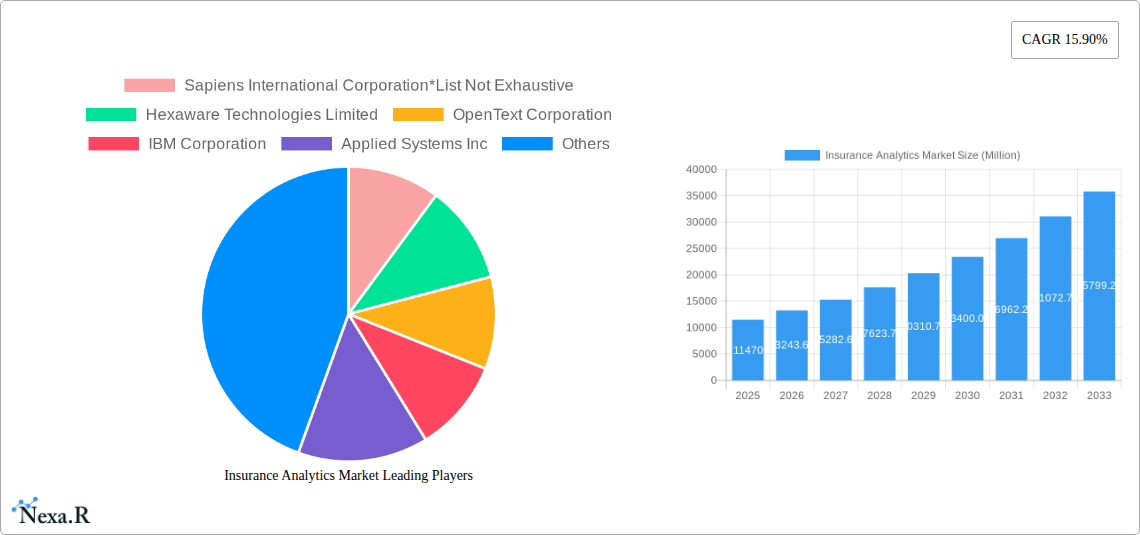
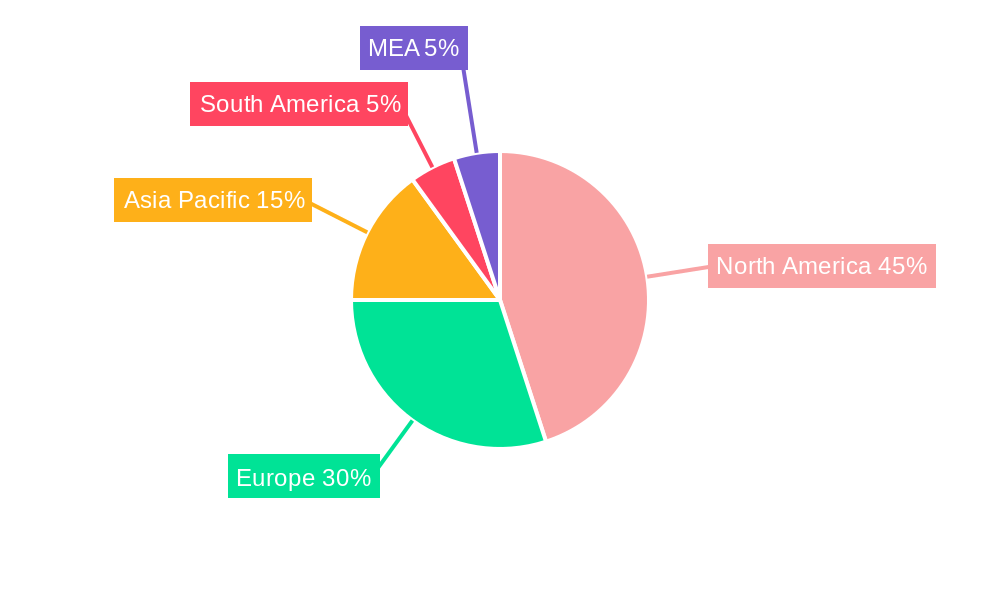
The Insurance Analytics market is experiencing robust growth, projected to reach \$11.47 billion in 2025 and exhibiting a Compound Annual Growth Rate (CAGR) of 15.90% from 2025 to 2033. This expansion is driven by several key factors. The increasing volume and complexity of insurance data necessitate sophisticated analytical tools for efficient claims management, risk assessment, and process optimization. Insurers are leveraging analytics to enhance customer experience through personalized services and targeted marketing, leading to improved customer retention and acquisition. Furthermore, regulatory compliance demands and the need for fraud detection are fueling the adoption of advanced analytics solutions. The market is segmented by component (tools and services), business application (claims management, risk management, process optimization, customer management & personalization), deployment mode (on-premise and cloud), and end-user (insurance companies, government agencies, third-party administrators, brokers, and consultancies). North America currently holds a significant market share, driven by technological advancements and high adoption rates within the insurance sector. However, the Asia-Pacific region is expected to witness substantial growth in the coming years due to increasing digitalization and rising insurance penetration.
The competitive landscape is characterized by a mix of established players and emerging technology providers. Companies like Sapiens, Hexaware, OpenText, IBM, Applied Systems, MicroStrategy, Guidewire, Microsoft, Oracle, and LexisNexis are actively shaping the market with innovative solutions. The market's future growth will depend on advancements in artificial intelligence (AI), machine learning (ML), and big data technologies, along with the increasing adoption of cloud-based analytics platforms. Furthermore, the integration of insurance analytics with other technologies, such as blockchain and the Internet of Things (IoT), will unlock further opportunities and drive market expansion. The continuous need for improved operational efficiency, enhanced risk management, and personalized customer experiences will sustain the demand for sophisticated insurance analytics solutions throughout the forecast period.
Insurance Analytics Market: A Comprehensive Report (2019-2033)
This in-depth report provides a comprehensive analysis of the Insurance Analytics Market, encompassing market dynamics, growth trends, regional segmentation, product landscape, key players, and future outlook. The study period covers 2019-2033, with 2025 as the base and estimated year. The market is segmented by component (Tool, Services), business application (Claims Management, Risk Management, Process Optimization, Customer Management & Personalization), deployment mode (On-premise, Cloud), and end-user (Insurance Companies, Government Agencies, Third-party Administrators, Brokers, and Consultancies). The report projects a market value of xx Million by 2033, exhibiting a CAGR of xx% during the forecast period (2025-2033).
Insurance Analytics Market Dynamics & Structure
The Insurance Analytics market is experiencing significant growth driven by increasing data volumes, the need for improved risk management, and regulatory pressures. Market concentration is moderate, with several large players and numerous niche providers. Technological innovation, particularly in areas like AI and machine learning, is a key driver, while regulatory frameworks, such as GDPR and CCPA, pose both challenges and opportunities. Competitive product substitutes include traditional actuarial methods, but the advantages of data-driven insights are increasingly evident. M&A activity is relatively high, with larger players consolidating their market share.
- Market Concentration: Moderately concentrated, with top 5 players holding approximately xx% market share in 2025.
- Technological Innovation: AI, machine learning, and big data analytics are transforming the landscape.
- Regulatory Framework: GDPR, CCPA, and other regulations influence data privacy and security practices.
- Competitive Substitutes: Traditional actuarial methods are being replaced by data-driven approaches.
- End-User Demographics: Insurance companies are the largest segment, followed by government agencies and third-party administrators.
- M&A Trends: Significant M&A activity observed, with xx deals recorded in the past 5 years, primarily focused on technology acquisitions.
Insurance Analytics Market Growth Trends & Insights
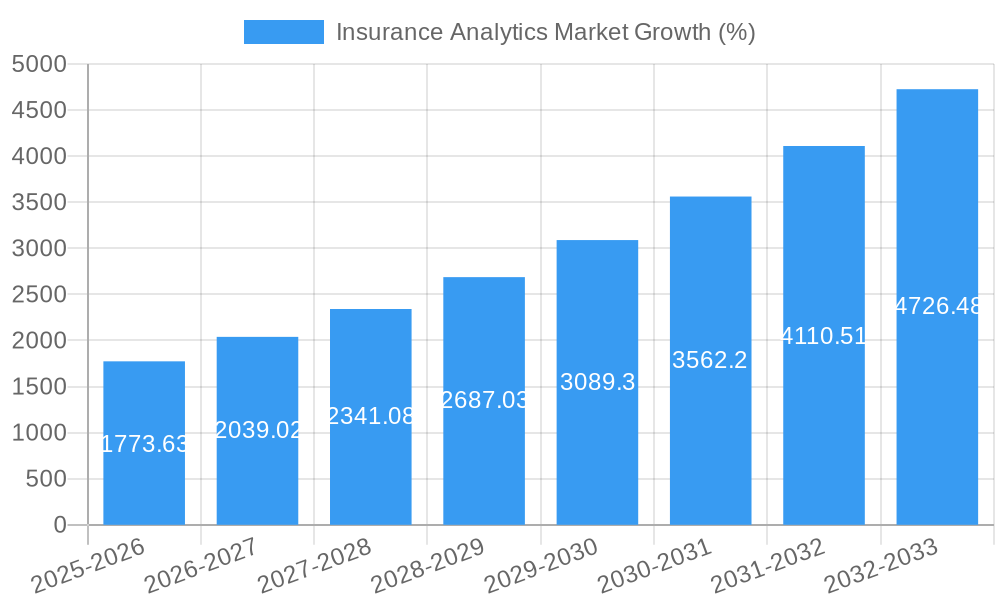
The Insurance Analytics market exhibits robust growth, driven by the increasing adoption of advanced analytics tools and services across the insurance industry. The market size expanded from xx Million in 2019 to xx Million in 2024, reflecting a significant increase in demand. This growth is further fueled by technological disruptions like cloud computing, which enables scalable and cost-effective analytics solutions. Consumer behavior shifts, including rising expectations for personalized services and faster claim processing, are also contributing factors. The market is expected to continue its upward trajectory, reaching xx Million by 2033. Key growth drivers include the growing adoption of AI and machine learning in claims processing, risk assessment, and customer service. The rising adoption of cloud-based solutions and the increasing availability of large datasets are also contributing to market growth.
Dominant Regions, Countries, or Segments in Insurance Analytics Market
North America currently holds the largest market share in the Insurance Analytics market, driven by high technological adoption, robust regulatory frameworks, and a large insurance industry. However, the Asia-Pacific region is projected to witness the fastest growth due to increasing digitalization and expanding insurance penetration. Within the segments, the "Services" component is currently dominant due to the demand for expertise in data analysis and implementation. In terms of business applications, "Claims Management" leads due to its direct impact on operational efficiency and cost savings. Cloud deployment is gaining popularity over on-premise solutions.
- North America: Dominated by a mature insurance industry and high technological adoption.
- Asia-Pacific: Fastest-growing region driven by increased digitalization and expanding insurance sector.
- Europe: Steady growth, influenced by stringent data privacy regulations.
- By Component: Services holds the largest market share, driven by consulting and implementation needs.
- By Business Application: Claims Management holds the largest share due to direct cost savings and efficiency improvements.
- By Deployment Mode: Cloud deployment is gaining traction due to scalability and cost-effectiveness.
- By End-User: Insurance companies constitute the largest end-user segment.
Insurance Analytics Market Product Landscape
The Insurance Analytics market offers a diverse range of products, including sophisticated analytical tools, specialized software solutions, and comprehensive data management systems. These tools leverage advanced algorithms and machine learning techniques to provide insurers with actionable insights into risk assessment, fraud detection, and customer behavior. Recent innovations include the integration of AI-powered chatbots for customer service and predictive modeling for more accurate risk pricing. These advancements offer enhanced efficiency, reduced costs, and improved customer experiences.
Key Drivers, Barriers & Challenges in Insurance Analytics Market
Key Drivers:
- Increasing data volumes and the need for advanced analytics.
- Growing demand for improved risk management and fraud detection.
- Regulatory pressures requiring enhanced data security and transparency.
- Adoption of cloud-based solutions for improved scalability and cost-effectiveness.
Challenges and Restraints:
- High initial investment costs for implementing advanced analytics solutions.
- Lack of skilled professionals with expertise in data science and analytics.
- Data security and privacy concerns related to sensitive customer information.
- Integration challenges with existing legacy systems within insurance companies. This contributes to xx% of projects experiencing delays.
Emerging Opportunities in Insurance Analytics Market
- Expansion into emerging markets: Untapped potential exists in developing economies with growing insurance penetration.
- IoT integration: Combining insurance data with IoT data offers new opportunities for risk assessment and personalized services.
- Advanced analytics techniques: The application of AI and machine learning continues to expand, creating new possibilities for predictive modeling and risk mitigation.
- Personalized customer experiences: Utilizing data to create tailored insurance products and services.
Growth Accelerators in the Insurance Analytics Market Industry
Strategic partnerships between insurance companies and technology providers are driving market expansion. Technological breakthroughs, particularly in AI and machine learning, are enhancing the capabilities of analytical tools. Expanding into new markets, particularly in developing economies, presents significant opportunities. Moreover, the increasing adoption of cloud-based solutions provides scalability and cost-efficiency, further accelerating market growth.
Key Players Shaping the Insurance Analytics Market Market
- Sapiens International Corporation
- Hexaware Technologies Limited
- OpenText Corporation
- IBM Corporation
- Applied Systems Inc
- MicroStrategy Incorporated
- Guidewire Software Inc
- Microsoft Corporation
- Oracle Corporation
- LexisNexis Risk Solutions
Notable Milestones in Insurance Analytics Market Sector
- April 2023: Guidewire launched Garmisch, a self-service tool on the Guidewire Cloud Console, enabling faster digital claims experiences.
- February 2023: MS Amlin Insurance S.E. adopted Sapiens IDITSuite, an end-to-end insurance platform, enhancing risk selection and lowering claim expense ratios.
In-Depth Insurance Analytics Market Market Outlook
The Insurance Analytics market is poised for continued strong growth, driven by technological advancements, increasing data volumes, and the growing demand for improved risk management and customer experiences. Strategic partnerships, expansion into new markets, and the adoption of innovative analytical techniques will further propel market expansion. The market is expected to witness a significant increase in the adoption of cloud-based solutions, creating new opportunities for growth and innovation.
Insurance Analytics Market Segmentation
-
1. Component
- 1.1. Tool
- 1.2. Services
-
2. Business Application (Qualitative Analysis)
- 2.1. Claims Management
- 2.2. Risk Management
- 2.3. Process Optimization
- 2.4. Customer Management and Personalization
-
3. Deployment Mode
- 3.1. On-premise
- 3.2. Cloud
-
4. End-User
- 4.1. Insurance Companies
- 4.2. Government Agencies
- 4.3. Third-pa
Insurance Analytics Market Segmentation By Geography
- 1. North America
- 2. Europe
- 3. Asia Pacific
- 4. Rest of the World
Insurance Analytics Market REPORT HIGHLIGHTS
| Aspects | Details |
|---|---|
| Study Period | 2019-2033 |
| Base Year | 2024 |
| Estimated Year | 2025 |
| Forecast Period | 2025-2033 |
| Historical Period | 2019-2024 |
| Growth Rate | CAGR of 15.90% from 2019-2033 |
| Segmentation |
|
Table of Contents
- 1. Introduction
- 1.1. Research Scope
- 1.2. Market Segmentation
- 1.3. Research Methodology
- 1.4. Definitions and Assumptions
- 2. Executive Summary
- 2.1. Introduction
- 3. Market Dynamics
- 3.1. Introduction
- 3.2. Market Drivers
- 3.2.1. Increased Adoption of Advanced Technologies; Rise in Competition among the Insurance Sector
- 3.3. Market Restrains
- 3.3.1. Stringent Government Regulations; Privacy and Security Concern
- 3.4. Market Trends
- 3.4.1. Increasing Risks And Fraudulent Activities Are Boosting the Adoption Of Insurance Analytics.
- 4. Market Factor Analysis
- 4.1. Porters Five Forces
- 4.2. Supply/Value Chain
- 4.3. PESTEL analysis
- 4.4. Market Entropy
- 4.5. Patent/Trademark Analysis
- 5. Global Insurance Analytics Market Analysis, Insights and Forecast, 2019-2031
- 5.1. Market Analysis, Insights and Forecast - by Component
- 5.1.1. Tool
- 5.1.2. Services
- 5.2. Market Analysis, Insights and Forecast - by Business Application (Qualitative Analysis)
- 5.2.1. Claims Management
- 5.2.2. Risk Management
- 5.2.3. Process Optimization
- 5.2.4. Customer Management and Personalization
- 5.3. Market Analysis, Insights and Forecast - by Deployment Mode
- 5.3.1. On-premise
- 5.3.2. Cloud
- 5.4. Market Analysis, Insights and Forecast - by End-User
- 5.4.1. Insurance Companies
- 5.4.2. Government Agencies
- 5.4.3. Third-pa
- 5.5. Market Analysis, Insights and Forecast - by Region
- 5.5.1. North America
- 5.5.2. Europe
- 5.5.3. Asia Pacific
- 5.5.4. Rest of the World
- 5.1. Market Analysis, Insights and Forecast - by Component
- 6. North America Insurance Analytics Market Analysis, Insights and Forecast, 2019-2031
- 6.1. Market Analysis, Insights and Forecast - by Component
- 6.1.1. Tool
- 6.1.2. Services
- 6.2. Market Analysis, Insights and Forecast - by Business Application (Qualitative Analysis)
- 6.2.1. Claims Management
- 6.2.2. Risk Management
- 6.2.3. Process Optimization
- 6.2.4. Customer Management and Personalization
- 6.3. Market Analysis, Insights and Forecast - by Deployment Mode
- 6.3.1. On-premise
- 6.3.2. Cloud
- 6.4. Market Analysis, Insights and Forecast - by End-User
- 6.4.1. Insurance Companies
- 6.4.2. Government Agencies
- 6.4.3. Third-pa
- 6.1. Market Analysis, Insights and Forecast - by Component
- 7. Europe Insurance Analytics Market Analysis, Insights and Forecast, 2019-2031
- 7.1. Market Analysis, Insights and Forecast - by Component
- 7.1.1. Tool
- 7.1.2. Services
- 7.2. Market Analysis, Insights and Forecast - by Business Application (Qualitative Analysis)
- 7.2.1. Claims Management
- 7.2.2. Risk Management
- 7.2.3. Process Optimization
- 7.2.4. Customer Management and Personalization
- 7.3. Market Analysis, Insights and Forecast - by Deployment Mode
- 7.3.1. On-premise
- 7.3.2. Cloud
- 7.4. Market Analysis, Insights and Forecast - by End-User
- 7.4.1. Insurance Companies
- 7.4.2. Government Agencies
- 7.4.3. Third-pa
- 7.1. Market Analysis, Insights and Forecast - by Component
- 8. Asia Pacific Insurance Analytics Market Analysis, Insights and Forecast, 2019-2031
- 8.1. Market Analysis, Insights and Forecast - by Component
- 8.1.1. Tool
- 8.1.2. Services
- 8.2. Market Analysis, Insights and Forecast - by Business Application (Qualitative Analysis)
- 8.2.1. Claims Management
- 8.2.2. Risk Management
- 8.2.3. Process Optimization
- 8.2.4. Customer Management and Personalization
- 8.3. Market Analysis, Insights and Forecast - by Deployment Mode
- 8.3.1. On-premise
- 8.3.2. Cloud
- 8.4. Market Analysis, Insights and Forecast - by End-User
- 8.4.1. Insurance Companies
- 8.4.2. Government Agencies
- 8.4.3. Third-pa
- 8.1. Market Analysis, Insights and Forecast - by Component
- 9. Rest of the World Insurance Analytics Market Analysis, Insights and Forecast, 2019-2031
- 9.1. Market Analysis, Insights and Forecast - by Component
- 9.1.1. Tool
- 9.1.2. Services
- 9.2. Market Analysis, Insights and Forecast - by Business Application (Qualitative Analysis)
- 9.2.1. Claims Management
- 9.2.2. Risk Management
- 9.2.3. Process Optimization
- 9.2.4. Customer Management and Personalization
- 9.3. Market Analysis, Insights and Forecast - by Deployment Mode
- 9.3.1. On-premise
- 9.3.2. Cloud
- 9.4. Market Analysis, Insights and Forecast - by End-User
- 9.4.1. Insurance Companies
- 9.4.2. Government Agencies
- 9.4.3. Third-pa
- 9.1. Market Analysis, Insights and Forecast - by Component
- 10. North America Insurance Analytics Market Analysis, Insights and Forecast, 2019-2031
- 10.1. Market Analysis, Insights and Forecast - By Country/Sub-region
- 10.1.1 United States
- 10.1.2 Canada
- 10.1.3 Mexico
- 11. Europe Insurance Analytics Market Analysis, Insights and Forecast, 2019-2031
- 11.1. Market Analysis, Insights and Forecast - By Country/Sub-region
- 11.1.1 Germany
- 11.1.2 United Kingdom
- 11.1.3 France
- 11.1.4 Spain
- 11.1.5 Italy
- 11.1.6 Spain
- 11.1.7 Belgium
- 11.1.8 Netherland
- 11.1.9 Nordics
- 11.1.10 Rest of Europe
- 12. Asia Pacific Insurance Analytics Market Analysis, Insights and Forecast, 2019-2031
- 12.1. Market Analysis, Insights and Forecast - By Country/Sub-region
- 12.1.1 China
- 12.1.2 Japan
- 12.1.3 India
- 12.1.4 South Korea
- 12.1.5 Southeast Asia
- 12.1.6 Australia
- 12.1.7 Indonesia
- 12.1.8 Phillipes
- 12.1.9 Singapore
- 12.1.10 Thailandc
- 12.1.11 Rest of Asia Pacific
- 13. South America Insurance Analytics Market Analysis, Insights and Forecast, 2019-2031
- 13.1. Market Analysis, Insights and Forecast - By Country/Sub-region
- 13.1.1 Brazil
- 13.1.2 Argentina
- 13.1.3 Peru
- 13.1.4 Chile
- 13.1.5 Colombia
- 13.1.6 Ecuador
- 13.1.7 Venezuela
- 13.1.8 Rest of South America
- 14. North America Insurance Analytics Market Analysis, Insights and Forecast, 2019-2031
- 14.1. Market Analysis, Insights and Forecast - By Country/Sub-region
- 14.1.1 United States
- 14.1.2 Canada
- 14.1.3 Mexico
- 15. MEA Insurance Analytics Market Analysis, Insights and Forecast, 2019-2031
- 15.1. Market Analysis, Insights and Forecast - By Country/Sub-region
- 15.1.1 United Arab Emirates
- 15.1.2 Saudi Arabia
- 15.1.3 South Africa
- 15.1.4 Rest of Middle East and Africa
- 16. Competitive Analysis
- 16.1. Global Market Share Analysis 2024
- 16.2. Company Profiles
- 16.2.1 Sapiens International Corporation*List Not Exhaustive
- 16.2.1.1. Overview
- 16.2.1.2. Products
- 16.2.1.3. SWOT Analysis
- 16.2.1.4. Recent Developments
- 16.2.1.5. Financials (Based on Availability)
- 16.2.2 Hexaware Technologies Limited
- 16.2.2.1. Overview
- 16.2.2.2. Products
- 16.2.2.3. SWOT Analysis
- 16.2.2.4. Recent Developments
- 16.2.2.5. Financials (Based on Availability)
- 16.2.3 OpenText Corporation
- 16.2.3.1. Overview
- 16.2.3.2. Products
- 16.2.3.3. SWOT Analysis
- 16.2.3.4. Recent Developments
- 16.2.3.5. Financials (Based on Availability)
- 16.2.4 IBM Corporation
- 16.2.4.1. Overview
- 16.2.4.2. Products
- 16.2.4.3. SWOT Analysis
- 16.2.4.4. Recent Developments
- 16.2.4.5. Financials (Based on Availability)
- 16.2.5 Applied Systems Inc
- 16.2.5.1. Overview
- 16.2.5.2. Products
- 16.2.5.3. SWOT Analysis
- 16.2.5.4. Recent Developments
- 16.2.5.5. Financials (Based on Availability)
- 16.2.6 MicroStrategy Incorporated
- 16.2.6.1. Overview
- 16.2.6.2. Products
- 16.2.6.3. SWOT Analysis
- 16.2.6.4. Recent Developments
- 16.2.6.5. Financials (Based on Availability)
- 16.2.7 Guidewire Software Inc
- 16.2.7.1. Overview
- 16.2.7.2. Products
- 16.2.7.3. SWOT Analysis
- 16.2.7.4. Recent Developments
- 16.2.7.5. Financials (Based on Availability)
- 16.2.8 Microsoft Corporation
- 16.2.8.1. Overview
- 16.2.8.2. Products
- 16.2.8.3. SWOT Analysis
- 16.2.8.4. Recent Developments
- 16.2.8.5. Financials (Based on Availability)
- 16.2.9 Oracle Corporation
- 16.2.9.1. Overview
- 16.2.9.2. Products
- 16.2.9.3. SWOT Analysis
- 16.2.9.4. Recent Developments
- 16.2.9.5. Financials (Based on Availability)
- 16.2.10 LexisNexis Risk Solutions
- 16.2.10.1. Overview
- 16.2.10.2. Products
- 16.2.10.3. SWOT Analysis
- 16.2.10.4. Recent Developments
- 16.2.10.5. Financials (Based on Availability)
- 16.2.1 Sapiens International Corporation*List Not Exhaustive
List of Figures
- Figure 1: Global Insurance Analytics Market Revenue Breakdown (Million, %) by Region 2024 & 2032
- Figure 2: North America Insurance Analytics Market Revenue (Million), by Country 2024 & 2032
- Figure 3: North America Insurance Analytics Market Revenue Share (%), by Country 2024 & 2032
- Figure 4: Europe Insurance Analytics Market Revenue (Million), by Country 2024 & 2032
- Figure 5: Europe Insurance Analytics Market Revenue Share (%), by Country 2024 & 2032
- Figure 6: Asia Pacific Insurance Analytics Market Revenue (Million), by Country 2024 & 2032
- Figure 7: Asia Pacific Insurance Analytics Market Revenue Share (%), by Country 2024 & 2032
- Figure 8: South America Insurance Analytics Market Revenue (Million), by Country 2024 & 2032
- Figure 9: South America Insurance Analytics Market Revenue Share (%), by Country 2024 & 2032
- Figure 10: North America Insurance Analytics Market Revenue (Million), by Country 2024 & 2032
- Figure 11: North America Insurance Analytics Market Revenue Share (%), by Country 2024 & 2032
- Figure 12: MEA Insurance Analytics Market Revenue (Million), by Country 2024 & 2032
- Figure 13: MEA Insurance Analytics Market Revenue Share (%), by Country 2024 & 2032
- Figure 14: North America Insurance Analytics Market Revenue (Million), by Component 2024 & 2032
- Figure 15: North America Insurance Analytics Market Revenue Share (%), by Component 2024 & 2032
- Figure 16: North America Insurance Analytics Market Revenue (Million), by Business Application (Qualitative Analysis) 2024 & 2032
- Figure 17: North America Insurance Analytics Market Revenue Share (%), by Business Application (Qualitative Analysis) 2024 & 2032
- Figure 18: North America Insurance Analytics Market Revenue (Million), by Deployment Mode 2024 & 2032
- Figure 19: North America Insurance Analytics Market Revenue Share (%), by Deployment Mode 2024 & 2032
- Figure 20: North America Insurance Analytics Market Revenue (Million), by End-User 2024 & 2032
- Figure 21: North America Insurance Analytics Market Revenue Share (%), by End-User 2024 & 2032
- Figure 22: North America Insurance Analytics Market Revenue (Million), by Country 2024 & 2032
- Figure 23: North America Insurance Analytics Market Revenue Share (%), by Country 2024 & 2032
- Figure 24: Europe Insurance Analytics Market Revenue (Million), by Component 2024 & 2032
- Figure 25: Europe Insurance Analytics Market Revenue Share (%), by Component 2024 & 2032
- Figure 26: Europe Insurance Analytics Market Revenue (Million), by Business Application (Qualitative Analysis) 2024 & 2032
- Figure 27: Europe Insurance Analytics Market Revenue Share (%), by Business Application (Qualitative Analysis) 2024 & 2032
- Figure 28: Europe Insurance Analytics Market Revenue (Million), by Deployment Mode 2024 & 2032
- Figure 29: Europe Insurance Analytics Market Revenue Share (%), by Deployment Mode 2024 & 2032
- Figure 30: Europe Insurance Analytics Market Revenue (Million), by End-User 2024 & 2032
- Figure 31: Europe Insurance Analytics Market Revenue Share (%), by End-User 2024 & 2032
- Figure 32: Europe Insurance Analytics Market Revenue (Million), by Country 2024 & 2032
- Figure 33: Europe Insurance Analytics Market Revenue Share (%), by Country 2024 & 2032
- Figure 34: Asia Pacific Insurance Analytics Market Revenue (Million), by Component 2024 & 2032
- Figure 35: Asia Pacific Insurance Analytics Market Revenue Share (%), by Component 2024 & 2032
- Figure 36: Asia Pacific Insurance Analytics Market Revenue (Million), by Business Application (Qualitative Analysis) 2024 & 2032
- Figure 37: Asia Pacific Insurance Analytics Market Revenue Share (%), by Business Application (Qualitative Analysis) 2024 & 2032
- Figure 38: Asia Pacific Insurance Analytics Market Revenue (Million), by Deployment Mode 2024 & 2032
- Figure 39: Asia Pacific Insurance Analytics Market Revenue Share (%), by Deployment Mode 2024 & 2032
- Figure 40: Asia Pacific Insurance Analytics Market Revenue (Million), by End-User 2024 & 2032
- Figure 41: Asia Pacific Insurance Analytics Market Revenue Share (%), by End-User 2024 & 2032
- Figure 42: Asia Pacific Insurance Analytics Market Revenue (Million), by Country 2024 & 2032
- Figure 43: Asia Pacific Insurance Analytics Market Revenue Share (%), by Country 2024 & 2032
- Figure 44: Rest of the World Insurance Analytics Market Revenue (Million), by Component 2024 & 2032
- Figure 45: Rest of the World Insurance Analytics Market Revenue Share (%), by Component 2024 & 2032
- Figure 46: Rest of the World Insurance Analytics Market Revenue (Million), by Business Application (Qualitative Analysis) 2024 & 2032
- Figure 47: Rest of the World Insurance Analytics Market Revenue Share (%), by Business Application (Qualitative Analysis) 2024 & 2032
- Figure 48: Rest of the World Insurance Analytics Market Revenue (Million), by Deployment Mode 2024 & 2032
- Figure 49: Rest of the World Insurance Analytics Market Revenue Share (%), by Deployment Mode 2024 & 2032
- Figure 50: Rest of the World Insurance Analytics Market Revenue (Million), by End-User 2024 & 2032
- Figure 51: Rest of the World Insurance Analytics Market Revenue Share (%), by End-User 2024 & 2032
- Figure 52: Rest of the World Insurance Analytics Market Revenue (Million), by Country 2024 & 2032
- Figure 53: Rest of the World Insurance Analytics Market Revenue Share (%), by Country 2024 & 2032
List of Tables
- Table 1: Global Insurance Analytics Market Revenue Million Forecast, by Region 2019 & 2032
- Table 2: Global Insurance Analytics Market Revenue Million Forecast, by Component 2019 & 2032
- Table 3: Global Insurance Analytics Market Revenue Million Forecast, by Business Application (Qualitative Analysis) 2019 & 2032
- Table 4: Global Insurance Analytics Market Revenue Million Forecast, by Deployment Mode 2019 & 2032
- Table 5: Global Insurance Analytics Market Revenue Million Forecast, by End-User 2019 & 2032
- Table 6: Global Insurance Analytics Market Revenue Million Forecast, by Region 2019 & 2032
- Table 7: Global Insurance Analytics Market Revenue Million Forecast, by Country 2019 & 2032
- Table 8: United States Insurance Analytics Market Revenue (Million) Forecast, by Application 2019 & 2032
- Table 9: Canada Insurance Analytics Market Revenue (Million) Forecast, by Application 2019 & 2032
- Table 10: Mexico Insurance Analytics Market Revenue (Million) Forecast, by Application 2019 & 2032
- Table 11: Global Insurance Analytics Market Revenue Million Forecast, by Country 2019 & 2032
- Table 12: Germany Insurance Analytics Market Revenue (Million) Forecast, by Application 2019 & 2032
- Table 13: United Kingdom Insurance Analytics Market Revenue (Million) Forecast, by Application 2019 & 2032
- Table 14: France Insurance Analytics Market Revenue (Million) Forecast, by Application 2019 & 2032
- Table 15: Spain Insurance Analytics Market Revenue (Million) Forecast, by Application 2019 & 2032
- Table 16: Italy Insurance Analytics Market Revenue (Million) Forecast, by Application 2019 & 2032
- Table 17: Spain Insurance Analytics Market Revenue (Million) Forecast, by Application 2019 & 2032
- Table 18: Belgium Insurance Analytics Market Revenue (Million) Forecast, by Application 2019 & 2032
- Table 19: Netherland Insurance Analytics Market Revenue (Million) Forecast, by Application 2019 & 2032
- Table 20: Nordics Insurance Analytics Market Revenue (Million) Forecast, by Application 2019 & 2032
- Table 21: Rest of Europe Insurance Analytics Market Revenue (Million) Forecast, by Application 2019 & 2032
- Table 22: Global Insurance Analytics Market Revenue Million Forecast, by Country 2019 & 2032
- Table 23: China Insurance Analytics Market Revenue (Million) Forecast, by Application 2019 & 2032
- Table 24: Japan Insurance Analytics Market Revenue (Million) Forecast, by Application 2019 & 2032
- Table 25: India Insurance Analytics Market Revenue (Million) Forecast, by Application 2019 & 2032
- Table 26: South Korea Insurance Analytics Market Revenue (Million) Forecast, by Application 2019 & 2032
- Table 27: Southeast Asia Insurance Analytics Market Revenue (Million) Forecast, by Application 2019 & 2032
- Table 28: Australia Insurance Analytics Market Revenue (Million) Forecast, by Application 2019 & 2032
- Table 29: Indonesia Insurance Analytics Market Revenue (Million) Forecast, by Application 2019 & 2032
- Table 30: Phillipes Insurance Analytics Market Revenue (Million) Forecast, by Application 2019 & 2032
- Table 31: Singapore Insurance Analytics Market Revenue (Million) Forecast, by Application 2019 & 2032
- Table 32: Thailandc Insurance Analytics Market Revenue (Million) Forecast, by Application 2019 & 2032
- Table 33: Rest of Asia Pacific Insurance Analytics Market Revenue (Million) Forecast, by Application 2019 & 2032
- Table 34: Global Insurance Analytics Market Revenue Million Forecast, by Country 2019 & 2032
- Table 35: Brazil Insurance Analytics Market Revenue (Million) Forecast, by Application 2019 & 2032
- Table 36: Argentina Insurance Analytics Market Revenue (Million) Forecast, by Application 2019 & 2032
- Table 37: Peru Insurance Analytics Market Revenue (Million) Forecast, by Application 2019 & 2032
- Table 38: Chile Insurance Analytics Market Revenue (Million) Forecast, by Application 2019 & 2032
- Table 39: Colombia Insurance Analytics Market Revenue (Million) Forecast, by Application 2019 & 2032
- Table 40: Ecuador Insurance Analytics Market Revenue (Million) Forecast, by Application 2019 & 2032
- Table 41: Venezuela Insurance Analytics Market Revenue (Million) Forecast, by Application 2019 & 2032
- Table 42: Rest of South America Insurance Analytics Market Revenue (Million) Forecast, by Application 2019 & 2032
- Table 43: Global Insurance Analytics Market Revenue Million Forecast, by Country 2019 & 2032
- Table 44: United States Insurance Analytics Market Revenue (Million) Forecast, by Application 2019 & 2032
- Table 45: Canada Insurance Analytics Market Revenue (Million) Forecast, by Application 2019 & 2032
- Table 46: Mexico Insurance Analytics Market Revenue (Million) Forecast, by Application 2019 & 2032
- Table 47: Global Insurance Analytics Market Revenue Million Forecast, by Country 2019 & 2032
- Table 48: United Arab Emirates Insurance Analytics Market Revenue (Million) Forecast, by Application 2019 & 2032
- Table 49: Saudi Arabia Insurance Analytics Market Revenue (Million) Forecast, by Application 2019 & 2032
- Table 50: South Africa Insurance Analytics Market Revenue (Million) Forecast, by Application 2019 & 2032
- Table 51: Rest of Middle East and Africa Insurance Analytics Market Revenue (Million) Forecast, by Application 2019 & 2032
- Table 52: Global Insurance Analytics Market Revenue Million Forecast, by Component 2019 & 2032
- Table 53: Global Insurance Analytics Market Revenue Million Forecast, by Business Application (Qualitative Analysis) 2019 & 2032
- Table 54: Global Insurance Analytics Market Revenue Million Forecast, by Deployment Mode 2019 & 2032
- Table 55: Global Insurance Analytics Market Revenue Million Forecast, by End-User 2019 & 2032
- Table 56: Global Insurance Analytics Market Revenue Million Forecast, by Country 2019 & 2032
- Table 57: Global Insurance Analytics Market Revenue Million Forecast, by Component 2019 & 2032
- Table 58: Global Insurance Analytics Market Revenue Million Forecast, by Business Application (Qualitative Analysis) 2019 & 2032
- Table 59: Global Insurance Analytics Market Revenue Million Forecast, by Deployment Mode 2019 & 2032
- Table 60: Global Insurance Analytics Market Revenue Million Forecast, by End-User 2019 & 2032
- Table 61: Global Insurance Analytics Market Revenue Million Forecast, by Country 2019 & 2032
- Table 62: Global Insurance Analytics Market Revenue Million Forecast, by Component 2019 & 2032
- Table 63: Global Insurance Analytics Market Revenue Million Forecast, by Business Application (Qualitative Analysis) 2019 & 2032
- Table 64: Global Insurance Analytics Market Revenue Million Forecast, by Deployment Mode 2019 & 2032
- Table 65: Global Insurance Analytics Market Revenue Million Forecast, by End-User 2019 & 2032
- Table 66: Global Insurance Analytics Market Revenue Million Forecast, by Country 2019 & 2032
- Table 67: Global Insurance Analytics Market Revenue Million Forecast, by Component 2019 & 2032
- Table 68: Global Insurance Analytics Market Revenue Million Forecast, by Business Application (Qualitative Analysis) 2019 & 2032
- Table 69: Global Insurance Analytics Market Revenue Million Forecast, by Deployment Mode 2019 & 2032
- Table 70: Global Insurance Analytics Market Revenue Million Forecast, by End-User 2019 & 2032
- Table 71: Global Insurance Analytics Market Revenue Million Forecast, by Country 2019 & 2032
Frequently Asked Questions
1. What is the projected Compound Annual Growth Rate (CAGR) of the Insurance Analytics Market?
The projected CAGR is approximately 15.90%.
2. Which companies are prominent players in the Insurance Analytics Market?
Key companies in the market include Sapiens International Corporation*List Not Exhaustive, Hexaware Technologies Limited, OpenText Corporation, IBM Corporation, Applied Systems Inc, MicroStrategy Incorporated, Guidewire Software Inc, Microsoft Corporation, Oracle Corporation, LexisNexis Risk Solutions.
3. What are the main segments of the Insurance Analytics Market?
The market segments include Component, Business Application (Qualitative Analysis), Deployment Mode, End-User.
4. Can you provide details about the market size?
The market size is estimated to be USD 11.47 Million as of 2022.
5. What are some drivers contributing to market growth?
Increased Adoption of Advanced Technologies; Rise in Competition among the Insurance Sector.
6. What are the notable trends driving market growth?
Increasing Risks And Fraudulent Activities Are Boosting the Adoption Of Insurance Analytics..
7. Are there any restraints impacting market growth?
Stringent Government Regulations; Privacy and Security Concern.
8. Can you provide examples of recent developments in the market?
April 2023 - Guidewire launched the Garmisch solution to provide developers with more self-service tools on the Guidewire Cloud Console. Insurance companies can easily create and implement seamless, digital claims experiences using this solution. With ready-to-use bulk data connectors from top global data platforms, Garmisch reduces the time it takes for an organization to gain insight.
9. What pricing options are available for accessing the report?
Pricing options include single-user, multi-user, and enterprise licenses priced at USD 4750, USD 5250, and USD 8750 respectively.
10. Is the market size provided in terms of value or volume?
The market size is provided in terms of value, measured in Million.
11. Are there any specific market keywords associated with the report?
Yes, the market keyword associated with the report is "Insurance Analytics Market," which aids in identifying and referencing the specific market segment covered.
12. How do I determine which pricing option suits my needs best?
The pricing options vary based on user requirements and access needs. Individual users may opt for single-user licenses, while businesses requiring broader access may choose multi-user or enterprise licenses for cost-effective access to the report.
13. Are there any additional resources or data provided in the Insurance Analytics Market report?
While the report offers comprehensive insights, it's advisable to review the specific contents or supplementary materials provided to ascertain if additional resources or data are available.
14. How can I stay updated on further developments or reports in the Insurance Analytics Market?
To stay informed about further developments, trends, and reports in the Insurance Analytics Market, consider subscribing to industry newsletters, following relevant companies and organizations, or regularly checking reputable industry news sources and publications.
Methodology
Step 1 - Identification of Relevant Samples Size from Population Database


Step 2 - Approaches for Defining Global Market Size (Value, Volume* & Price*)

Note*: In applicable scenarios
Step 3 - Data Sources
Primary Research
- Web Analytics
- Survey Reports
- Research Institute
- Latest Research Reports
- Opinion Leaders
Secondary Research
- Annual Reports
- White Paper
- Latest Press Release
- Industry Association
- Paid Database
- Investor Presentations

Step 4 - Data Triangulation
Involves using different sources of information in order to increase the validity of a study
These sources are likely to be stakeholders in a program - participants, other researchers, program staff, other community members, and so on.
Then we put all data in single framework & apply various statistical tools to find out the dynamic on the market.
During the analysis stage, feedback from the stakeholder groups would be compared to determine areas of agreement as well as areas of divergence
