

Key Insights
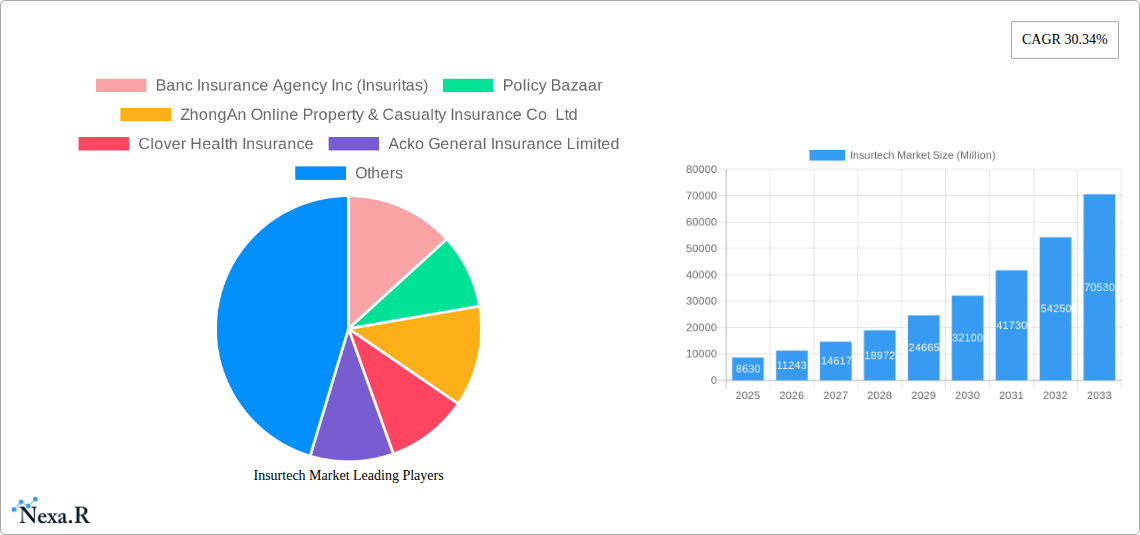
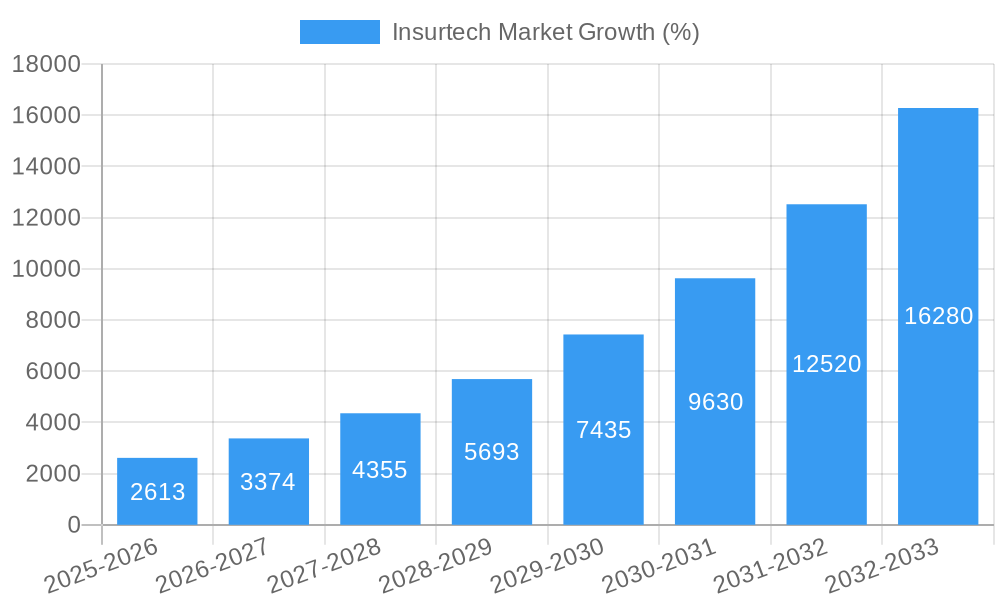
The Insurtech market, valued at $8.63 billion in 2025, is experiencing explosive growth, projected to expand significantly by 2033. A compound annual growth rate (CAGR) of 30.34% signifies a dynamic and rapidly evolving landscape driven by several key factors. Increased consumer adoption of digital platforms, coupled with the demand for personalized and more efficient insurance solutions, fuels this expansion. Technological advancements, such as artificial intelligence (AI) for risk assessment and blockchain for secure transaction processing, are streamlining operations and enhancing customer experience. Furthermore, the integration of telematics data is enabling insurers to offer usage-based insurance, leading to more accurate risk profiling and competitive pricing. This trend towards data-driven decision-making is reshaping the insurance industry, compelling traditional players to adopt innovative technologies to remain competitive. The emergence of Insurtech startups, such as Lemonade, Policy Bazaar, and ZhongAn, is further disrupting the market, introducing innovative business models and challenging established norms. Regulatory changes promoting digitalization and open banking also contribute positively to market expansion.
However, despite the promising outlook, the Insurtech market faces certain challenges. Data security concerns and the need to comply with stringent data privacy regulations pose significant hurdles. The high initial investment required for technology development and integration can be a barrier for smaller players. Furthermore, the successful integration of new technologies into existing insurance infrastructure requires significant changes in established business processes, demanding adaptability from both insurers and customers. Despite these restraints, the long-term outlook for the Insurtech market remains exceptionally positive, fueled by continuous technological advancements and the ever-growing demand for customized and efficient insurance solutions. The competitive landscape, featuring both established players and innovative startups, guarantees a dynamic and rapidly evolving market.
Insurtech Market Report: 2019-2033
This comprehensive report provides a detailed analysis of the Insurtech market, encompassing market dynamics, growth trends, regional dominance, product landscapes, key players, and future outlook. The study period covers 2019-2033, with a base year of 2025 and a forecast period of 2025-2033. The report delves into parent markets (Insurance Technology) and child markets (e.g., Insurtech platforms, Embedded Insurance) to offer a granular understanding of this rapidly evolving sector. Market values are presented in millions of units.
Insurtech Market Dynamics & Structure
This section analyzes the Insurtech market's competitive landscape, technological advancements, regulatory environment, and market consolidation trends from 2019-2024. The analysis incorporates quantitative data, such as market share percentages and M&A deal volumes, along with qualitative factors influencing market evolution.
- Market Concentration: The Insurtech market exhibits a moderately fragmented structure, with a few large players and numerous smaller, specialized companies. The top 5 players account for approximately xx% of the market share in 2024, indicating opportunities for both consolidation and niche market specialization.
- Technological Innovation: The market is driven by innovations in AI, machine learning, blockchain, and big data analytics, enhancing efficiency and personalization in insurance services. Investment in these technologies is expected to reach xx million in 2025.
- Regulatory Framework: Varying regulatory landscapes across different geographies pose both challenges and opportunities. Stringent regulations in some regions can hinder market entry but also foster trust and stability.
- Competitive Substitutes: Traditional insurance models pose a significant competitive threat, although Insurtech companies are increasingly differentiating themselves through innovative offerings.
- End-User Demographics: The younger demographic is driving adoption of Insurtech solutions due to increased digital literacy and preference for convenient, personalized services. The millennial segment is projected to account for xx% of the market by 2033.
- M&A Trends: The Insurtech space has witnessed a surge in mergers and acquisitions (M&A) activity in recent years. The number of M&A deals increased from xx in 2019 to xx in 2024, indicating a trend toward consolidation.
Insurtech Market Growth Trends & Insights
This section provides an in-depth analysis of the Insurtech market's growth trajectory, incorporating insights into market size, adoption rates, technological disruptions, and consumer behavior shifts. The analysis leverages extensive market research and data to forecast future growth.
[Insert 600-word analysis focusing on market size evolution (in millions), adoption rates (percentage of the insurance market), technological disruptions (impact of AI, blockchain, etc.), and consumer behavior shifts (e.g., preference for digital channels, personalized insurance). Include specific metrics like CAGR and market penetration rates. Use paragraphs for a flowing narrative.]
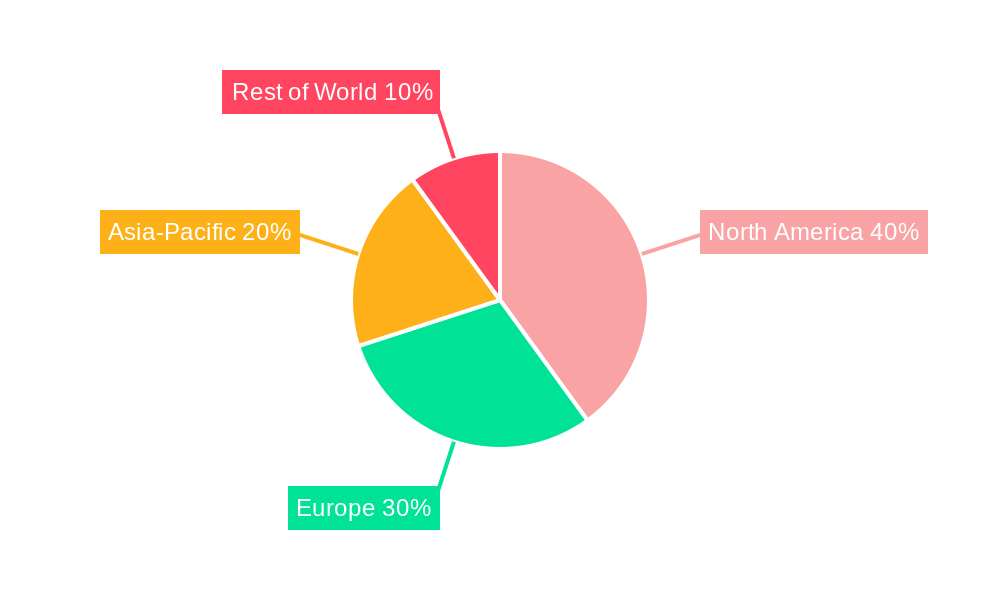
Dominant Regions, Countries, or Segments in Insurtech Market
This section identifies the leading regions, countries, or segments driving Insurtech market growth. The analysis highlights key growth drivers and analyzes factors contributing to regional dominance.
[Insert 600-word analysis identifying the leading region/country/segment. Use bullet points to highlight key drivers (economic policies, infrastructure, digital literacy) and paragraphs to analyze dominance factors (market share, growth potential, regulatory environment). Consider factors such as North America's early adoption, Asia's rapid growth, and the influence of specific government policies.]
Insurtech Market Product Landscape
The Insurtech market offers a diverse range of products, from digital insurance platforms and embedded insurance solutions to AI-powered risk assessment tools. Key innovations include personalized insurance offerings, automated claims processing, and the use of blockchain for improved transparency and security. These advancements are improving efficiency, customer experience, and ultimately, the profitability of insurance operations.
Key Drivers, Barriers & Challenges in Insurtech Market
Key Drivers:
- Technological advancements (AI, ML, blockchain) driving efficiency and personalization.
- Increasing demand for digital-first insurance solutions from younger demographics.
- Favorable regulatory environments in some regions promoting innovation.
Key Challenges:
- Stringent regulatory hurdles and compliance requirements in certain markets.
- Cybersecurity risks associated with handling sensitive customer data.
- Competition from established players with deep market penetration. This competition has reduced projected market growth from xx million to xx million in 2033.
Emerging Opportunities in Insurtech Market
- Expansion into underserved markets, particularly in developing economies.
- Development of innovative insurance products tailored to specific customer needs (e.g., micro-insurance, parametric insurance).
- Leveraging IoT and telematics data to personalize risk assessment and pricing.
Growth Accelerators in the Insurtech Market Industry
Several factors are poised to accelerate Insurtech market growth in the coming years. These include strategic partnerships between Insurtech firms and traditional insurance companies, significant investments in research and development driving innovation and technological breakthroughs, and the expansion of Insurtech services into new and emerging markets. The increasing adoption of cloud-based solutions and APIs further supports seamless integration of Insurtech platforms with existing systems, facilitating faster market penetration.
Key Players Shaping the Insurtech Market Market
- Banc Insurance Agency Inc (Insuritas)
- Policy Bazaar
- ZhongAn Online Property & Casualty Insurance Co Ltd
- Clover Health Insurance
- Acko General Insurance Limited
- Moonshot-Internet
- Sureify
- Lemonade
- Oscar Health
- Anorak
- BDEO
- Earnix
- Planck
- ThingCo
- Tractable
- Bima
- Metromile
- Collective Health
- [List Not Exhaustive]
Notable Milestones in Insurtech Market Sector
- March 2024: CNB Bank & Trust (CIBC) and Insuritas partnered to launch an embedded full-service insurance agency, leveraging Insuritas' BUNDLE platform. This highlights the growing trend of embedded insurance within financial ecosystems.
- June 2023: Clover Health Investments Corp. settled seven derivative lawsuits, potentially improving its financial stability and future growth prospects.
In-Depth Insurtech Market Market Outlook
The Insurtech market is projected to experience robust growth in the forecast period (2025-2033), driven by continued technological innovation, increasing consumer demand for digital insurance solutions, and strategic partnerships between established and emerging players. Opportunities lie in expanding into untapped markets, developing innovative product offerings leveraging advanced technologies like AI and blockchain, and fostering collaborations to enhance market penetration and service delivery. The market is projected to reach xx million by 2033.
Insurtech Market Segmentation
-
1. Insurance Line
- 1.1. Health
- 1.2. Life
- 1.3. Automotive
- 1.4. Home And Property
- 1.5. Travel Insurance
- 1.6. Other Insurance Lines
Insurtech Market Segmentation By Geography
-
1. North America
- 1.1. United States
- 1.2. Canada
- 1.3. Rest of North America
-
2. Europe
- 2.1. Germany
- 2.2. France
- 2.3. Spain
- 2.4. United Kingdom
- 2.5. Rest of Europe
-
3. South America
- 3.1. Brazil
- 3.2. Argentina
- 3.3. Rest of South America
-
4. Asia Pacific
- 4.1. India
- 4.2. China
- 4.3. Australia
- 4.4. Singapore
- 4.5. Hong Kong
- 4.6. Japan
- 4.7. Rest of Asia Pacific
- 5. Middle East
-
6. United Arab Emirates
- 6.1. Saudi Arabia
- 6.2. South Africa
- 6.3. Rest of Middle East
Insurtech Market REPORT HIGHLIGHTS
| Aspects | Details |
|---|---|
| Study Period | 2019-2033 |
| Base Year | 2024 |
| Estimated Year | 2025 |
| Forecast Period | 2025-2033 |
| Historical Period | 2019-2024 |
| Growth Rate | CAGR of 30.34% from 2019-2033 |
| Segmentation |
|
Table of Contents
- 1. Introduction
- 1.1. Research Scope
- 1.2. Market Segmentation
- 1.3. Research Methodology
- 1.4. Definitions and Assumptions
- 2. Executive Summary
- 2.1. Introduction
- 3. Market Dynamics
- 3.1. Introduction
- 3.2. Market Drivers
- 3.2.1. Rise in Investments in Digital Technologies to Reduce Operational Costs and Improve Efficiency & Customer Experience; Growth in the Use of Blockchain-Based Technology Among Health and Life Insurance Companies is Also Expected to Drive the Growth
- 3.3. Market Restrains
- 3.3.1. Rise in Investments in Digital Technologies to Reduce Operational Costs and Improve Efficiency & Customer Experience; Growth in the Use of Blockchain-Based Technology Among Health and Life Insurance Companies is Also Expected to Drive the Growth
- 3.4. Market Trends
- 3.4.1. Automotive Segment is Driving the Insurtech Market
- 4. Market Factor Analysis
- 4.1. Porters Five Forces
- 4.2. Supply/Value Chain
- 4.3. PESTEL analysis
- 4.4. Market Entropy
- 4.5. Patent/Trademark Analysis
- 5. Global Insurtech Market Analysis, Insights and Forecast, 2019-2031
- 5.1. Market Analysis, Insights and Forecast - by Insurance Line
- 5.1.1. Health
- 5.1.2. Life
- 5.1.3. Automotive
- 5.1.4. Home And Property
- 5.1.5. Travel Insurance
- 5.1.6. Other Insurance Lines
- 5.2. Market Analysis, Insights and Forecast - by Region
- 5.2.1. North America
- 5.2.2. Europe
- 5.2.3. South America
- 5.2.4. Asia Pacific
- 5.2.5. Middle East
- 5.2.6. United Arab Emirates
- 5.1. Market Analysis, Insights and Forecast - by Insurance Line
- 6. North America Insurtech Market Analysis, Insights and Forecast, 2019-2031
- 6.1. Market Analysis, Insights and Forecast - by Insurance Line
- 6.1.1. Health
- 6.1.2. Life
- 6.1.3. Automotive
- 6.1.4. Home And Property
- 6.1.5. Travel Insurance
- 6.1.6. Other Insurance Lines
- 6.1. Market Analysis, Insights and Forecast - by Insurance Line
- 7. Europe Insurtech Market Analysis, Insights and Forecast, 2019-2031
- 7.1. Market Analysis, Insights and Forecast - by Insurance Line
- 7.1.1. Health
- 7.1.2. Life
- 7.1.3. Automotive
- 7.1.4. Home And Property
- 7.1.5. Travel Insurance
- 7.1.6. Other Insurance Lines
- 7.1. Market Analysis, Insights and Forecast - by Insurance Line
- 8. South America Insurtech Market Analysis, Insights and Forecast, 2019-2031
- 8.1. Market Analysis, Insights and Forecast - by Insurance Line
- 8.1.1. Health
- 8.1.2. Life
- 8.1.3. Automotive
- 8.1.4. Home And Property
- 8.1.5. Travel Insurance
- 8.1.6. Other Insurance Lines
- 8.1. Market Analysis, Insights and Forecast - by Insurance Line
- 9. Asia Pacific Insurtech Market Analysis, Insights and Forecast, 2019-2031
- 9.1. Market Analysis, Insights and Forecast - by Insurance Line
- 9.1.1. Health
- 9.1.2. Life
- 9.1.3. Automotive
- 9.1.4. Home And Property
- 9.1.5. Travel Insurance
- 9.1.6. Other Insurance Lines
- 9.1. Market Analysis, Insights and Forecast - by Insurance Line
- 10. Middle East Insurtech Market Analysis, Insights and Forecast, 2019-2031
- 10.1. Market Analysis, Insights and Forecast - by Insurance Line
- 10.1.1. Health
- 10.1.2. Life
- 10.1.3. Automotive
- 10.1.4. Home And Property
- 10.1.5. Travel Insurance
- 10.1.6. Other Insurance Lines
- 10.1. Market Analysis, Insights and Forecast - by Insurance Line
- 11. United Arab Emirates Insurtech Market Analysis, Insights and Forecast, 2019-2031
- 11.1. Market Analysis, Insights and Forecast - by Insurance Line
- 11.1.1. Health
- 11.1.2. Life
- 11.1.3. Automotive
- 11.1.4. Home And Property
- 11.1.5. Travel Insurance
- 11.1.6. Other Insurance Lines
- 11.1. Market Analysis, Insights and Forecast - by Insurance Line
- 12. Competitive Analysis
- 12.1. Global Market Share Analysis 2024
- 12.2. Company Profiles
- 12.2.1 Banc Insurance Agency Inc (Insuritas)
- 12.2.1.1. Overview
- 12.2.1.2. Products
- 12.2.1.3. SWOT Analysis
- 12.2.1.4. Recent Developments
- 12.2.1.5. Financials (Based on Availability)
- 12.2.2 Policy Bazaar
- 12.2.2.1. Overview
- 12.2.2.2. Products
- 12.2.2.3. SWOT Analysis
- 12.2.2.4. Recent Developments
- 12.2.2.5. Financials (Based on Availability)
- 12.2.3 ZhongAn Online Property & Casualty Insurance Co Ltd
- 12.2.3.1. Overview
- 12.2.3.2. Products
- 12.2.3.3. SWOT Analysis
- 12.2.3.4. Recent Developments
- 12.2.3.5. Financials (Based on Availability)
- 12.2.4 Clover Health Insurance
- 12.2.4.1. Overview
- 12.2.4.2. Products
- 12.2.4.3. SWOT Analysis
- 12.2.4.4. Recent Developments
- 12.2.4.5. Financials (Based on Availability)
- 12.2.5 Acko General Insurance Limited
- 12.2.5.1. Overview
- 12.2.5.2. Products
- 12.2.5.3. SWOT Analysis
- 12.2.5.4. Recent Developments
- 12.2.5.5. Financials (Based on Availability)
- 12.2.6 Moonshot-Internet
- 12.2.6.1. Overview
- 12.2.6.2. Products
- 12.2.6.3. SWOT Analysis
- 12.2.6.4. Recent Developments
- 12.2.6.5. Financials (Based on Availability)
- 12.2.7 Sureify
- 12.2.7.1. Overview
- 12.2.7.2. Products
- 12.2.7.3. SWOT Analysis
- 12.2.7.4. Recent Developments
- 12.2.7.5. Financials (Based on Availability)
- 12.2.8 Lemonade
- 12.2.8.1. Overview
- 12.2.8.2. Products
- 12.2.8.3. SWOT Analysis
- 12.2.8.4. Recent Developments
- 12.2.8.5. Financials (Based on Availability)
- 12.2.9 Oscar Health
- 12.2.9.1. Overview
- 12.2.9.2. Products
- 12.2.9.3. SWOT Analysis
- 12.2.9.4. Recent Developments
- 12.2.9.5. Financials (Based on Availability)
- 12.2.10 Anorak
- 12.2.10.1. Overview
- 12.2.10.2. Products
- 12.2.10.3. SWOT Analysis
- 12.2.10.4. Recent Developments
- 12.2.10.5. Financials (Based on Availability)
- 12.2.11 BDEO
- 12.2.11.1. Overview
- 12.2.11.2. Products
- 12.2.11.3. SWOT Analysis
- 12.2.11.4. Recent Developments
- 12.2.11.5. Financials (Based on Availability)
- 12.2.12 Earnix
- 12.2.12.1. Overview
- 12.2.12.2. Products
- 12.2.12.3. SWOT Analysis
- 12.2.12.4. Recent Developments
- 12.2.12.5. Financials (Based on Availability)
- 12.2.13 Planck
- 12.2.13.1. Overview
- 12.2.13.2. Products
- 12.2.13.3. SWOT Analysis
- 12.2.13.4. Recent Developments
- 12.2.13.5. Financials (Based on Availability)
- 12.2.14 ThingCo
- 12.2.14.1. Overview
- 12.2.14.2. Products
- 12.2.14.3. SWOT Analysis
- 12.2.14.4. Recent Developments
- 12.2.14.5. Financials (Based on Availability)
- 12.2.15 Tractable
- 12.2.15.1. Overview
- 12.2.15.2. Products
- 12.2.15.3. SWOT Analysis
- 12.2.15.4. Recent Developments
- 12.2.15.5. Financials (Based on Availability)
- 12.2.16 Bima
- 12.2.16.1. Overview
- 12.2.16.2. Products
- 12.2.16.3. SWOT Analysis
- 12.2.16.4. Recent Developments
- 12.2.16.5. Financials (Based on Availability)
- 12.2.17 Metromile
- 12.2.17.1. Overview
- 12.2.17.2. Products
- 12.2.17.3. SWOT Analysis
- 12.2.17.4. Recent Developments
- 12.2.17.5. Financials (Based on Availability)
- 12.2.18 Collective Health**List Not Exhaustive
- 12.2.18.1. Overview
- 12.2.18.2. Products
- 12.2.18.3. SWOT Analysis
- 12.2.18.4. Recent Developments
- 12.2.18.5. Financials (Based on Availability)
- 12.2.1 Banc Insurance Agency Inc (Insuritas)
List of Figures
- Figure 1: Global Insurtech Market Revenue Breakdown (Million, %) by Region 2024 & 2032
- Figure 2: Global Insurtech Market Volume Breakdown (Billion, %) by Region 2024 & 2032
- Figure 3: North America Insurtech Market Revenue (Million), by Insurance Line 2024 & 2032
- Figure 4: North America Insurtech Market Volume (Billion), by Insurance Line 2024 & 2032
- Figure 5: North America Insurtech Market Revenue Share (%), by Insurance Line 2024 & 2032
- Figure 6: North America Insurtech Market Volume Share (%), by Insurance Line 2024 & 2032
- Figure 7: North America Insurtech Market Revenue (Million), by Country 2024 & 2032
- Figure 8: North America Insurtech Market Volume (Billion), by Country 2024 & 2032
- Figure 9: North America Insurtech Market Revenue Share (%), by Country 2024 & 2032
- Figure 10: North America Insurtech Market Volume Share (%), by Country 2024 & 2032
- Figure 11: Europe Insurtech Market Revenue (Million), by Insurance Line 2024 & 2032
- Figure 12: Europe Insurtech Market Volume (Billion), by Insurance Line 2024 & 2032
- Figure 13: Europe Insurtech Market Revenue Share (%), by Insurance Line 2024 & 2032
- Figure 14: Europe Insurtech Market Volume Share (%), by Insurance Line 2024 & 2032
- Figure 15: Europe Insurtech Market Revenue (Million), by Country 2024 & 2032
- Figure 16: Europe Insurtech Market Volume (Billion), by Country 2024 & 2032
- Figure 17: Europe Insurtech Market Revenue Share (%), by Country 2024 & 2032
- Figure 18: Europe Insurtech Market Volume Share (%), by Country 2024 & 2032
- Figure 19: South America Insurtech Market Revenue (Million), by Insurance Line 2024 & 2032
- Figure 20: South America Insurtech Market Volume (Billion), by Insurance Line 2024 & 2032
- Figure 21: South America Insurtech Market Revenue Share (%), by Insurance Line 2024 & 2032
- Figure 22: South America Insurtech Market Volume Share (%), by Insurance Line 2024 & 2032
- Figure 23: South America Insurtech Market Revenue (Million), by Country 2024 & 2032
- Figure 24: South America Insurtech Market Volume (Billion), by Country 2024 & 2032
- Figure 25: South America Insurtech Market Revenue Share (%), by Country 2024 & 2032
- Figure 26: South America Insurtech Market Volume Share (%), by Country 2024 & 2032
- Figure 27: Asia Pacific Insurtech Market Revenue (Million), by Insurance Line 2024 & 2032
- Figure 28: Asia Pacific Insurtech Market Volume (Billion), by Insurance Line 2024 & 2032
- Figure 29: Asia Pacific Insurtech Market Revenue Share (%), by Insurance Line 2024 & 2032
- Figure 30: Asia Pacific Insurtech Market Volume Share (%), by Insurance Line 2024 & 2032
- Figure 31: Asia Pacific Insurtech Market Revenue (Million), by Country 2024 & 2032
- Figure 32: Asia Pacific Insurtech Market Volume (Billion), by Country 2024 & 2032
- Figure 33: Asia Pacific Insurtech Market Revenue Share (%), by Country 2024 & 2032
- Figure 34: Asia Pacific Insurtech Market Volume Share (%), by Country 2024 & 2032
- Figure 35: Middle East Insurtech Market Revenue (Million), by Insurance Line 2024 & 2032
- Figure 36: Middle East Insurtech Market Volume (Billion), by Insurance Line 2024 & 2032
- Figure 37: Middle East Insurtech Market Revenue Share (%), by Insurance Line 2024 & 2032
- Figure 38: Middle East Insurtech Market Volume Share (%), by Insurance Line 2024 & 2032
- Figure 39: Middle East Insurtech Market Revenue (Million), by Country 2024 & 2032
- Figure 40: Middle East Insurtech Market Volume (Billion), by Country 2024 & 2032
- Figure 41: Middle East Insurtech Market Revenue Share (%), by Country 2024 & 2032
- Figure 42: Middle East Insurtech Market Volume Share (%), by Country 2024 & 2032
- Figure 43: United Arab Emirates Insurtech Market Revenue (Million), by Insurance Line 2024 & 2032
- Figure 44: United Arab Emirates Insurtech Market Volume (Billion), by Insurance Line 2024 & 2032
- Figure 45: United Arab Emirates Insurtech Market Revenue Share (%), by Insurance Line 2024 & 2032
- Figure 46: United Arab Emirates Insurtech Market Volume Share (%), by Insurance Line 2024 & 2032
- Figure 47: United Arab Emirates Insurtech Market Revenue (Million), by Country 2024 & 2032
- Figure 48: United Arab Emirates Insurtech Market Volume (Billion), by Country 2024 & 2032
- Figure 49: United Arab Emirates Insurtech Market Revenue Share (%), by Country 2024 & 2032
- Figure 50: United Arab Emirates Insurtech Market Volume Share (%), by Country 2024 & 2032
List of Tables
- Table 1: Global Insurtech Market Revenue Million Forecast, by Region 2019 & 2032
- Table 2: Global Insurtech Market Volume Billion Forecast, by Region 2019 & 2032
- Table 3: Global Insurtech Market Revenue Million Forecast, by Insurance Line 2019 & 2032
- Table 4: Global Insurtech Market Volume Billion Forecast, by Insurance Line 2019 & 2032
- Table 5: Global Insurtech Market Revenue Million Forecast, by Region 2019 & 2032
- Table 6: Global Insurtech Market Volume Billion Forecast, by Region 2019 & 2032
- Table 7: Global Insurtech Market Revenue Million Forecast, by Insurance Line 2019 & 2032
- Table 8: Global Insurtech Market Volume Billion Forecast, by Insurance Line 2019 & 2032
- Table 9: Global Insurtech Market Revenue Million Forecast, by Country 2019 & 2032
- Table 10: Global Insurtech Market Volume Billion Forecast, by Country 2019 & 2032
- Table 11: United States Insurtech Market Revenue (Million) Forecast, by Application 2019 & 2032
- Table 12: United States Insurtech Market Volume (Billion) Forecast, by Application 2019 & 2032
- Table 13: Canada Insurtech Market Revenue (Million) Forecast, by Application 2019 & 2032
- Table 14: Canada Insurtech Market Volume (Billion) Forecast, by Application 2019 & 2032
- Table 15: Rest of North America Insurtech Market Revenue (Million) Forecast, by Application 2019 & 2032
- Table 16: Rest of North America Insurtech Market Volume (Billion) Forecast, by Application 2019 & 2032
- Table 17: Global Insurtech Market Revenue Million Forecast, by Insurance Line 2019 & 2032
- Table 18: Global Insurtech Market Volume Billion Forecast, by Insurance Line 2019 & 2032
- Table 19: Global Insurtech Market Revenue Million Forecast, by Country 2019 & 2032
- Table 20: Global Insurtech Market Volume Billion Forecast, by Country 2019 & 2032
- Table 21: Germany Insurtech Market Revenue (Million) Forecast, by Application 2019 & 2032
- Table 22: Germany Insurtech Market Volume (Billion) Forecast, by Application 2019 & 2032
- Table 23: France Insurtech Market Revenue (Million) Forecast, by Application 2019 & 2032
- Table 24: France Insurtech Market Volume (Billion) Forecast, by Application 2019 & 2032
- Table 25: Spain Insurtech Market Revenue (Million) Forecast, by Application 2019 & 2032
- Table 26: Spain Insurtech Market Volume (Billion) Forecast, by Application 2019 & 2032
- Table 27: United Kingdom Insurtech Market Revenue (Million) Forecast, by Application 2019 & 2032
- Table 28: United Kingdom Insurtech Market Volume (Billion) Forecast, by Application 2019 & 2032
- Table 29: Rest of Europe Insurtech Market Revenue (Million) Forecast, by Application 2019 & 2032
- Table 30: Rest of Europe Insurtech Market Volume (Billion) Forecast, by Application 2019 & 2032
- Table 31: Global Insurtech Market Revenue Million Forecast, by Insurance Line 2019 & 2032
- Table 32: Global Insurtech Market Volume Billion Forecast, by Insurance Line 2019 & 2032
- Table 33: Global Insurtech Market Revenue Million Forecast, by Country 2019 & 2032
- Table 34: Global Insurtech Market Volume Billion Forecast, by Country 2019 & 2032
- Table 35: Brazil Insurtech Market Revenue (Million) Forecast, by Application 2019 & 2032
- Table 36: Brazil Insurtech Market Volume (Billion) Forecast, by Application 2019 & 2032
- Table 37: Argentina Insurtech Market Revenue (Million) Forecast, by Application 2019 & 2032
- Table 38: Argentina Insurtech Market Volume (Billion) Forecast, by Application 2019 & 2032
- Table 39: Rest of South America Insurtech Market Revenue (Million) Forecast, by Application 2019 & 2032
- Table 40: Rest of South America Insurtech Market Volume (Billion) Forecast, by Application 2019 & 2032
- Table 41: Global Insurtech Market Revenue Million Forecast, by Insurance Line 2019 & 2032
- Table 42: Global Insurtech Market Volume Billion Forecast, by Insurance Line 2019 & 2032
- Table 43: Global Insurtech Market Revenue Million Forecast, by Country 2019 & 2032
- Table 44: Global Insurtech Market Volume Billion Forecast, by Country 2019 & 2032
- Table 45: India Insurtech Market Revenue (Million) Forecast, by Application 2019 & 2032
- Table 46: India Insurtech Market Volume (Billion) Forecast, by Application 2019 & 2032
- Table 47: China Insurtech Market Revenue (Million) Forecast, by Application 2019 & 2032
- Table 48: China Insurtech Market Volume (Billion) Forecast, by Application 2019 & 2032
- Table 49: Australia Insurtech Market Revenue (Million) Forecast, by Application 2019 & 2032
- Table 50: Australia Insurtech Market Volume (Billion) Forecast, by Application 2019 & 2032
- Table 51: Singapore Insurtech Market Revenue (Million) Forecast, by Application 2019 & 2032
- Table 52: Singapore Insurtech Market Volume (Billion) Forecast, by Application 2019 & 2032
- Table 53: Hong Kong Insurtech Market Revenue (Million) Forecast, by Application 2019 & 2032
- Table 54: Hong Kong Insurtech Market Volume (Billion) Forecast, by Application 2019 & 2032
- Table 55: Japan Insurtech Market Revenue (Million) Forecast, by Application 2019 & 2032
- Table 56: Japan Insurtech Market Volume (Billion) Forecast, by Application 2019 & 2032
- Table 57: Rest of Asia Pacific Insurtech Market Revenue (Million) Forecast, by Application 2019 & 2032
- Table 58: Rest of Asia Pacific Insurtech Market Volume (Billion) Forecast, by Application 2019 & 2032
- Table 59: Global Insurtech Market Revenue Million Forecast, by Insurance Line 2019 & 2032
- Table 60: Global Insurtech Market Volume Billion Forecast, by Insurance Line 2019 & 2032
- Table 61: Global Insurtech Market Revenue Million Forecast, by Country 2019 & 2032
- Table 62: Global Insurtech Market Volume Billion Forecast, by Country 2019 & 2032
- Table 63: Global Insurtech Market Revenue Million Forecast, by Insurance Line 2019 & 2032
- Table 64: Global Insurtech Market Volume Billion Forecast, by Insurance Line 2019 & 2032
- Table 65: Global Insurtech Market Revenue Million Forecast, by Country 2019 & 2032
- Table 66: Global Insurtech Market Volume Billion Forecast, by Country 2019 & 2032
- Table 67: Saudi Arabia Insurtech Market Revenue (Million) Forecast, by Application 2019 & 2032
- Table 68: Saudi Arabia Insurtech Market Volume (Billion) Forecast, by Application 2019 & 2032
- Table 69: South Africa Insurtech Market Revenue (Million) Forecast, by Application 2019 & 2032
- Table 70: South Africa Insurtech Market Volume (Billion) Forecast, by Application 2019 & 2032
- Table 71: Rest of Middle East Insurtech Market Revenue (Million) Forecast, by Application 2019 & 2032
- Table 72: Rest of Middle East Insurtech Market Volume (Billion) Forecast, by Application 2019 & 2032
Frequently Asked Questions
1. What is the projected Compound Annual Growth Rate (CAGR) of the Insurtech Market?
The projected CAGR is approximately 30.34%.
2. Which companies are prominent players in the Insurtech Market?
Key companies in the market include Banc Insurance Agency Inc (Insuritas), Policy Bazaar, ZhongAn Online Property & Casualty Insurance Co Ltd, Clover Health Insurance, Acko General Insurance Limited, Moonshot-Internet, Sureify, Lemonade, Oscar Health, Anorak, BDEO, Earnix, Planck, ThingCo, Tractable, Bima, Metromile, Collective Health**List Not Exhaustive.
3. What are the main segments of the Insurtech Market?
The market segments include Insurance Line.
4. Can you provide details about the market size?
The market size is estimated to be USD 8.63 Million as of 2022.
5. What are some drivers contributing to market growth?
Rise in Investments in Digital Technologies to Reduce Operational Costs and Improve Efficiency & Customer Experience; Growth in the Use of Blockchain-Based Technology Among Health and Life Insurance Companies is Also Expected to Drive the Growth.
6. What are the notable trends driving market growth?
Automotive Segment is Driving the Insurtech Market.
7. Are there any restraints impacting market growth?
Rise in Investments in Digital Technologies to Reduce Operational Costs and Improve Efficiency & Customer Experience; Growth in the Use of Blockchain-Based Technology Among Health and Life Insurance Companies is Also Expected to Drive the Growth.
8. Can you provide examples of recent developments in the market?
March 2024: CNB Bank & Trust (CIBC) and Insuritas partnered to launch an embedded full-service insurance agency. Insuritas is proud to announce that it has been chosen by CIBC to install its award-winning, fully-functioning digital insurance agency solution. BUNDLE is Insuritas' award-winning, full-functioning insurance agency platform embedded in CIBC's ecosystem and engineered to provide a complete solution for CIBC's retail and commercial clients.June 2023: Clover Health Investments Corp., a leading provider of physician enablement services with a mission to improve Medicare access to quality healthcare, announced that it had reached a partnership agreement in principle to settle seven derivative lawsuits that are pending in the courts of Delaware and New York, as well as in the courts of Tennessee.
9. What pricing options are available for accessing the report?
Pricing options include single-user, multi-user, and enterprise licenses priced at USD 4750, USD 5250, and USD 8750 respectively.
10. Is the market size provided in terms of value or volume?
The market size is provided in terms of value, measured in Million and volume, measured in Billion.
11. Are there any specific market keywords associated with the report?
Yes, the market keyword associated with the report is "Insurtech Market," which aids in identifying and referencing the specific market segment covered.
12. How do I determine which pricing option suits my needs best?
The pricing options vary based on user requirements and access needs. Individual users may opt for single-user licenses, while businesses requiring broader access may choose multi-user or enterprise licenses for cost-effective access to the report.
13. Are there any additional resources or data provided in the Insurtech Market report?
While the report offers comprehensive insights, it's advisable to review the specific contents or supplementary materials provided to ascertain if additional resources or data are available.
14. How can I stay updated on further developments or reports in the Insurtech Market?
To stay informed about further developments, trends, and reports in the Insurtech Market, consider subscribing to industry newsletters, following relevant companies and organizations, or regularly checking reputable industry news sources and publications.
Methodology
Step 1 - Identification of Relevant Samples Size from Population Database


Step 2 - Approaches for Defining Global Market Size (Value, Volume* & Price*)

Note*: In applicable scenarios
Step 3 - Data Sources
Primary Research
- Web Analytics
- Survey Reports
- Research Institute
- Latest Research Reports
- Opinion Leaders
Secondary Research
- Annual Reports
- White Paper
- Latest Press Release
- Industry Association
- Paid Database
- Investor Presentations

Step 4 - Data Triangulation
Involves using different sources of information in order to increase the validity of a study
These sources are likely to be stakeholders in a program - participants, other researchers, program staff, other community members, and so on.
Then we put all data in single framework & apply various statistical tools to find out the dynamic on the market.
During the analysis stage, feedback from the stakeholder groups would be compared to determine areas of agreement as well as areas of divergence
