

Key Insights
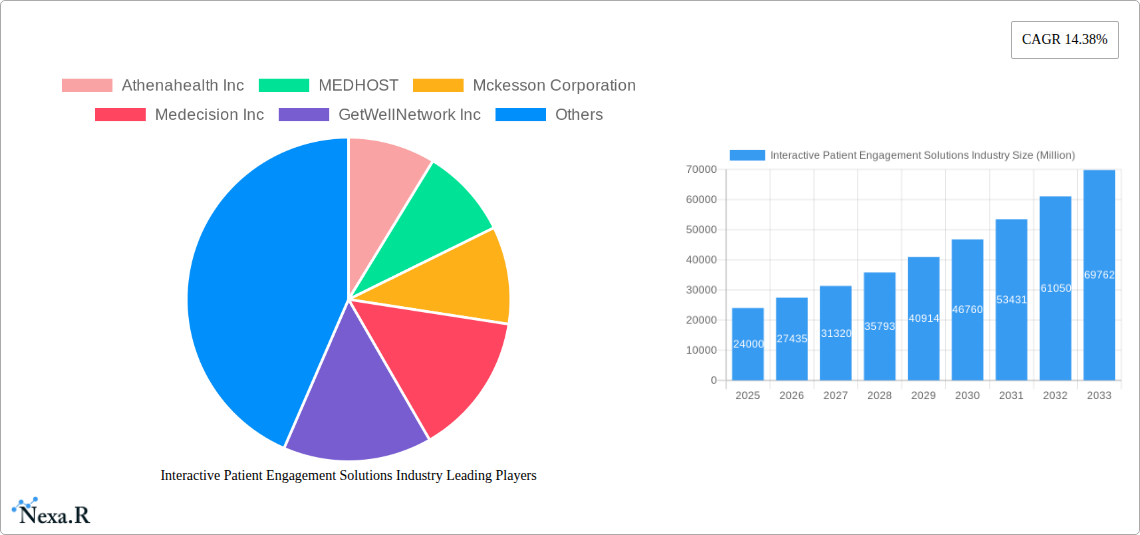
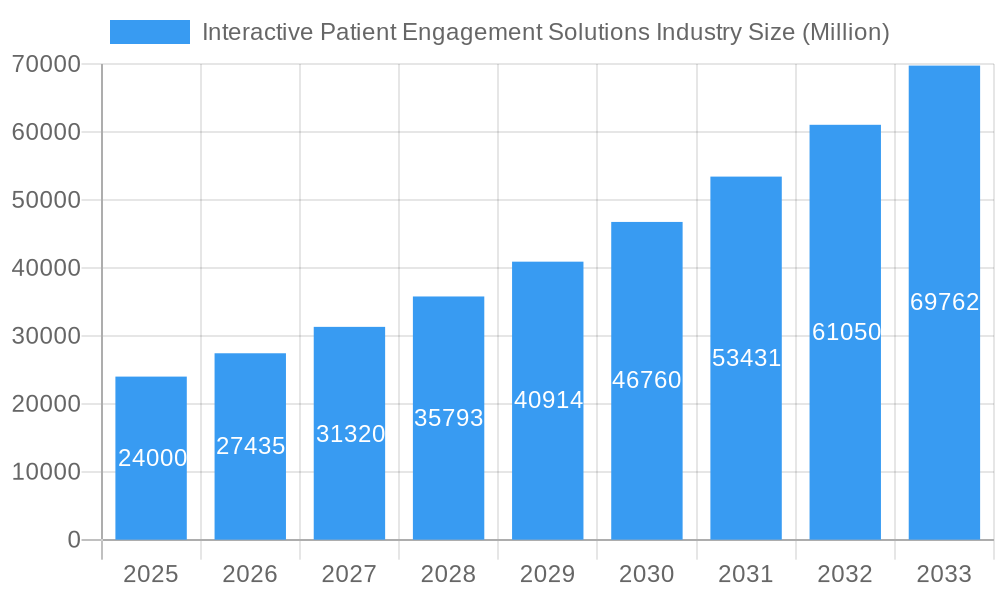
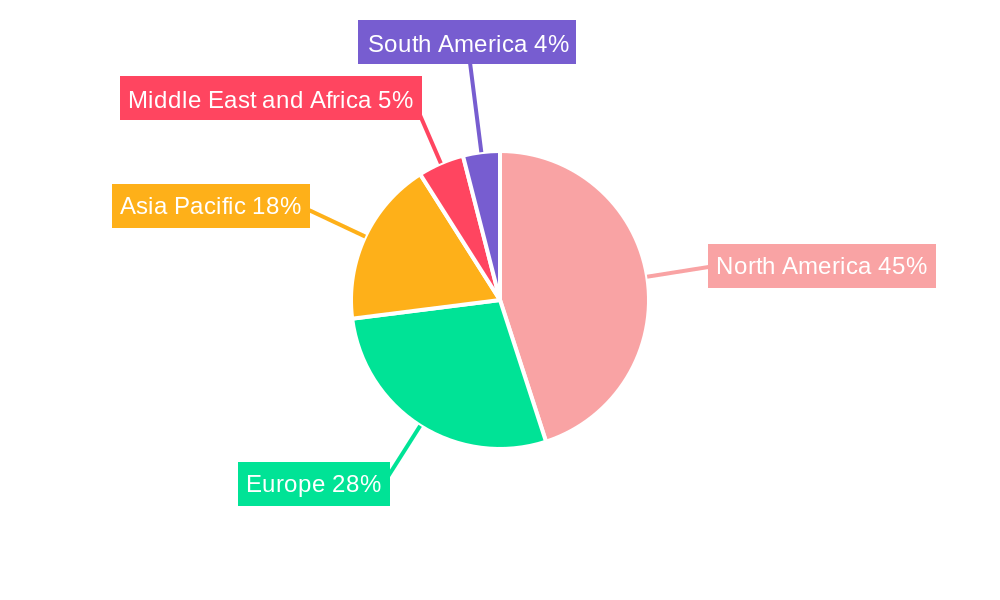
The Interactive Patient Engagement Solutions (IPES) market is experiencing robust growth, projected to reach $24 billion in 2025 and exhibiting a Compound Annual Growth Rate (CAGR) of 14.38% from 2025 to 2033. This expansion is driven by several key factors. The increasing adoption of telehealth and remote patient monitoring, fueled by the COVID-19 pandemic and advancements in digital health technologies, is a major catalyst. Patients are increasingly demanding greater control and convenience in managing their healthcare, leading to higher demand for user-friendly portals and mobile applications for appointment scheduling, medication reminders, and access to medical records. Furthermore, the growing focus on value-based care models incentivizes providers and payers to adopt IPES to improve patient outcomes and reduce healthcare costs. The market is segmented by component (hardware, software, services), delivery mode (web-based, cloud-based, on-premise), and application (social management, fitness and health management, home healthcare management, financial management). North America currently holds a significant market share due to high technological adoption and advanced healthcare infrastructure, but the Asia-Pacific region is expected to witness the fastest growth driven by increasing smartphone penetration and expanding healthcare infrastructure. The competitive landscape includes established players like Athenahealth, McKesson, and Cerner, alongside emerging innovative companies.
Interactive Patient Engagement Solutions Industry Market Size (In Billion)
The market's growth trajectory is projected to continue for the foreseeable future, driven by continued technological innovation. Future growth will hinge on several key factors including the seamless integration of IPES with Electronic Health Records (EHR) systems, the development of personalized and proactive patient engagement strategies leveraging AI and machine learning, and the address of concerns regarding data privacy and security. The expansion of 5G networks and the increasing affordability of smart devices will further accelerate the adoption of IPES across diverse demographics. The focus will shift toward improved patient experience and outcomes through personalized interventions, enhanced communication tools, and data-driven insights. Addressing regulatory hurdles and ensuring interoperability across different healthcare systems will also play a crucial role in shaping the future of this dynamic market.
Interactive Patient Engagement Solutions Industry Company Market Share
Interactive Patient Engagement Solutions Market Report: 2019-2033
This comprehensive report provides a detailed analysis of the Interactive Patient Engagement Solutions industry, encompassing market dynamics, growth trends, regional dominance, product landscape, key players, and future outlook. The study period covers 2019-2033, with a base year of 2025 and a forecast period of 2025-2033. The report segments the market by component (Hardware, Software, Service), delivery mode (Web-based & Cloud-based, On-Premise), application (Social Management, Fitness & Health Management, Home Healthcare Management, Financial Management), and end-user (Provider, Payer, Patient, Other). Key players analyzed include Athenahealth Inc, MEDHOST, McKesson Corporation, Medecision Inc, GetWellNetwork Inc, Orion Health Ltd, Cerner Corporation, Welvu, Lincor Solutions, Yourcareuniverse Inc, Allscripts Healthcare Solutions Inc, and IBM. The total market value in 2025 is estimated at xx Million.
Interactive Patient Engagement Solutions Industry Market Dynamics & Structure
The Interactive Patient Engagement Solutions market is characterized by moderate concentration, with a few large players holding significant market share, while numerous smaller companies compete in niche segments. Technological innovation, particularly in AI and telehealth integration, is a key driver, alongside evolving regulatory frameworks focused on data privacy and interoperability (e.g., HIPAA compliance). Competition from established players and emerging startups is intense, fueled by increasing demand for improved patient experiences and cost-effective healthcare delivery. Market consolidation through mergers and acquisitions (M&A) is expected to continue, leading to further industry consolidation.
- Market Concentration: Moderately concentrated, with top 5 players holding approximately xx% market share in 2025.
- Technological Innovation: AI-powered tools, telehealth integration, and personalized patient portals are driving growth.
- Regulatory Landscape: HIPAA compliance and data security regulations significantly impact market dynamics.
- Competitive Substitutes: Traditional methods of patient communication and engagement face increasing competition.
- M&A Activity: xx M&A deals were recorded between 2019 and 2024, indicating a consolidating market.
- Innovation Barriers: High development costs, integration complexities, and data security concerns present challenges.
Interactive Patient Engagement Solutions Industry Growth Trends & Insights
The Interactive Patient Engagement Solutions market exhibits robust growth, driven by rising healthcare costs, increasing patient expectations, and the widespread adoption of digital health technologies. The market size is projected to reach xx Million by 2033, exhibiting a CAGR of xx% during the forecast period (2025-2033). This growth is fueled by factors like the increasing penetration of smartphones and internet access, the rise of value-based care models, and the growing emphasis on proactive patient management. Technological disruptions, such as the emergence of AI-powered chatbots and virtual assistants for patient support, are significantly impacting consumer behavior, leading to increased adoption rates across all segments.
Dominant Regions, Countries, or Segments in Interactive Patient Engagement Solutions Industry
North America currently dominates the Interactive Patient Engagement Solutions market, driven by robust healthcare infrastructure, high technological adoption rates, and supportive regulatory frameworks. Within North America, the US holds the largest market share, followed by Canada. The software segment holds the largest market share among components, followed by services. Web-based and cloud-based delivery models are experiencing rapid growth due to their scalability and cost-effectiveness. Among applications, Fitness & Health Management and Home Healthcare Management are the fastest-growing segments.
- Key Regional Drivers: North America's advanced healthcare infrastructure and high technological adoption. Europe's increasing investments in digital health initiatives. Asia-Pacific's burgeoning healthcare sector and rising smartphone penetration.
- Dominant Segments: Software (xx% market share in 2025), Web-based/Cloud-based delivery (xx% market share in 2025), Fitness & Health Management applications.
- Growth Potential: Asia-Pacific and Latin America present significant untapped potential due to increasing healthcare spending and technological advancements.
Interactive Patient Engagement Solutions Industry Product Landscape
The Interactive Patient Engagement Solutions market showcases a diverse range of products, from basic patient portals to sophisticated AI-powered platforms. Key features include personalized health recommendations, secure messaging, telehealth capabilities, appointment scheduling, and remote patient monitoring. Product innovations focus on enhancing user experience, improving data security, and integrating with Electronic Health Records (EHR) systems. The competitive landscape is shaped by unique selling propositions such as advanced analytics, seamless integration, and specialized features catering to specific healthcare needs.
Key Drivers, Barriers & Challenges in Interactive Patient Engagement Solutions Industry
Key Drivers:
- Increasing demand for improved patient experiences.
- Rising adoption of telehealth and remote patient monitoring.
- Growing focus on value-based care and cost reduction.
- Technological advancements in AI, machine learning, and data analytics.
Challenges & Restraints:
- High implementation costs and integration complexities for healthcare providers.
- Concerns around data security and patient privacy.
- Interoperability challenges between different systems and platforms.
- Regulatory hurdles and evolving compliance requirements.
- Potential for vendor lock-in with specific platforms.
Emerging Opportunities in Interactive Patient Engagement Solutions Industry
- Expansion into underserved markets with limited access to healthcare.
- Development of AI-powered solutions for personalized healthcare interventions.
- Integration with wearable technology for continuous patient monitoring.
- Growing demand for chronic disease management applications.
- Focus on patient education and engagement tools for improved health outcomes.
Growth Accelerators in the Interactive Patient Engagement Solutions Industry Industry
The long-term growth of the Interactive Patient Engagement Solutions market will be fueled by ongoing technological innovation, strategic partnerships between technology companies and healthcare providers, and the increasing adoption of value-based care models. Furthermore, government initiatives promoting digital health adoption and investments in healthcare infrastructure will further accelerate market growth.
Key Players Shaping the Interactive Patient Engagement Solutions Market
- Athenahealth Inc
- MEDHOST
- Mckesson Corporation
- Medecision Inc
- GetWellNetwork Inc
- Orion Health Ltd
- Cerner Corporation
- Welvu
- Lincor Solutions
- Yourcareuniverse Inc
- Allscripts Healthcare Solutions Inc
- IBM
Notable Milestones in Interactive Patient Engagement Solutions Industry Sector
- March 2022: DeliverHealth launched its partner program, supporting ecosystem growth and improving healthcare efficiency.
- March 2022: Epic launched "Cheers," a CRM technology enhancing patient connection, particularly valuable post-COVID-19.
In-Depth Interactive Patient Engagement Solutions Industry Market Outlook
The future of the Interactive Patient Engagement Solutions market is promising, with continued growth driven by technological advancements, increasing patient expectations, and a shift towards value-based care. Strategic partnerships, expansion into new markets, and the development of innovative solutions will shape the industry landscape. The market's potential lies in its ability to improve patient outcomes, reduce healthcare costs, and enhance the overall healthcare experience.
Interactive Patient Engagement Solutions Industry Segmentation
-
1. Component
- 1.1. Hardware
- 1.2. Software
- 1.3. Service
-
2. Delivery Mode
- 2.1. Web-based and Cloud-based
- 2.2. On-Premise
-
3. Application
- 3.1. Social Management
- 3.2. Fitness and Health Management
- 3.3. Home Healthcare Management
- 3.4. Financial Management
-
4. End User
- 4.1. Provider
- 4.2. Payer
- 4.3. Patient
- 4.4. Other End Users
Interactive Patient Engagement Solutions Industry Segmentation By Geography
-
1. North America
- 1.1. United States
- 1.2. Canada
- 1.3. Mexico
-
2. Europe
- 2.1. Germany
- 2.2. United Kingdom
- 2.3. France
- 2.4. Italy
- 2.5. Spain
- 2.6. Rest of Europe
-
3. Asia Pacific
- 3.1. China
- 3.2. Japan
- 3.3. India
- 3.4. Australia
- 3.5. South Korea
- 3.6. Rest of Asia Pacific
-
4. Middle East and Africa
- 4.1. GCC
- 4.2. South Africa
- 4.3. Rest of Middle East and Africa
-
5. South America
- 5.1. Brazil
- 5.2. Argentina
- 5.3. Rest of South America
Interactive Patient Engagement Solutions Industry Regional Market Share
Geographic Coverage of Interactive Patient Engagement Solutions Industry
Interactive Patient Engagement Solutions Industry REPORT HIGHLIGHTS
| Aspects | Details |
|---|---|
| Study Period | 2020-2034 |
| Base Year | 2025 |
| Estimated Year | 2026 |
| Forecast Period | 2026-2034 |
| Historical Period | 2020-2025 |
| Growth Rate | CAGR of 14.38% from 2020-2034 |
| Segmentation |
|
Table of Contents
- 1. Introduction
- 1.1. Research Scope
- 1.2. Market Segmentation
- 1.3. Research Objective
- 1.4. Definitions and Assumptions
- 2. Executive Summary
- 2.1. Market Snapshot
- 3. Market Dynamics
- 3.1. Market Drivers
- 3.2. Market Restrains
- 3.3. Market Trends
- 3.4. Market Opportunities
- 4. Market Factor Analysis
- 4.1. Porters Five Forces
- 4.1.1. Bargaining Power of Suppliers
- 4.1.2. Bargaining Power of Buyers
- 4.1.3. Threat of New Entrants
- 4.1.4. Threat of Substitutes
- 4.1.5. Competitive Rivalry
- 4.2. PESTEL analysis
- 4.3. BCG Analysis
- 4.3.1. Stars (High Growth, High Market Share)
- 4.3.2. Cash Cows (Low Growth, High Market Share)
- 4.3.3. Question Mark (High Growth, Low Market Share)
- 4.3.4. Dogs (Low Growth, Low Market Share)
- 4.4. Ansoff Matrix Analysis
- 4.5. Supply Chain Analysis
- 4.6. Regulatory Landscape
- 4.7. Current Market Potential and Opportunity Assessment (TAM–SAM–SOM Framework)
- 4.8. NRP Analyst Note
- 4.1. Porters Five Forces
- 5. Market Analysis, Insights and Forecast 2021-2033
- 5.1. Market Analysis, Insights and Forecast - by Component
- 5.1.1. Hardware
- 5.1.2. Software
- 5.1.3. Service
- 5.2. Market Analysis, Insights and Forecast - by Delivery Mode
- 5.2.1. Web-based and Cloud-based
- 5.2.2. On-Premise
- 5.3. Market Analysis, Insights and Forecast - by Application
- 5.3.1. Social Management
- 5.3.2. Fitness and Health Management
- 5.3.3. Home Healthcare Management
- 5.3.4. Financial Management
- 5.4. Market Analysis, Insights and Forecast - by End User
- 5.4.1. Provider
- 5.4.2. Payer
- 5.4.3. Patient
- 5.4.4. Other End Users
- 5.5. Market Analysis, Insights and Forecast - by Region
- 5.5.1. North America
- 5.5.2. Europe
- 5.5.3. Asia Pacific
- 5.5.4. Middle East and Africa
- 5.5.5. South America
- 5.1. Market Analysis, Insights and Forecast - by Component
- 6. Global Interactive Patient Engagement Solutions Industry Analysis, Insights and Forecast, 2021-2033
- 6.1. Market Analysis, Insights and Forecast - by Component
- 6.1.1. Hardware
- 6.1.2. Software
- 6.1.3. Service
- 6.2. Market Analysis, Insights and Forecast - by Delivery Mode
- 6.2.1. Web-based and Cloud-based
- 6.2.2. On-Premise
- 6.3. Market Analysis, Insights and Forecast - by Application
- 6.3.1. Social Management
- 6.3.2. Fitness and Health Management
- 6.3.3. Home Healthcare Management
- 6.3.4. Financial Management
- 6.4. Market Analysis, Insights and Forecast - by End User
- 6.4.1. Provider
- 6.4.2. Payer
- 6.4.3. Patient
- 6.4.4. Other End Users
- 6.1. Market Analysis, Insights and Forecast - by Component
- 7. North America Interactive Patient Engagement Solutions Industry Analysis, Insights and Forecast, 2020-2032
- 7.1. Market Analysis, Insights and Forecast - by Component
- 7.1.1. Hardware
- 7.1.2. Software
- 7.1.3. Service
- 7.2. Market Analysis, Insights and Forecast - by Delivery Mode
- 7.2.1. Web-based and Cloud-based
- 7.2.2. On-Premise
- 7.3. Market Analysis, Insights and Forecast - by Application
- 7.3.1. Social Management
- 7.3.2. Fitness and Health Management
- 7.3.3. Home Healthcare Management
- 7.3.4. Financial Management
- 7.4. Market Analysis, Insights and Forecast - by End User
- 7.4.1. Provider
- 7.4.2. Payer
- 7.4.3. Patient
- 7.4.4. Other End Users
- 7.1. Market Analysis, Insights and Forecast - by Component
- 8. Europe Interactive Patient Engagement Solutions Industry Analysis, Insights and Forecast, 2020-2032
- 8.1. Market Analysis, Insights and Forecast - by Component
- 8.1.1. Hardware
- 8.1.2. Software
- 8.1.3. Service
- 8.2. Market Analysis, Insights and Forecast - by Delivery Mode
- 8.2.1. Web-based and Cloud-based
- 8.2.2. On-Premise
- 8.3. Market Analysis, Insights and Forecast - by Application
- 8.3.1. Social Management
- 8.3.2. Fitness and Health Management
- 8.3.3. Home Healthcare Management
- 8.3.4. Financial Management
- 8.4. Market Analysis, Insights and Forecast - by End User
- 8.4.1. Provider
- 8.4.2. Payer
- 8.4.3. Patient
- 8.4.4. Other End Users
- 8.1. Market Analysis, Insights and Forecast - by Component
- 9. Asia Pacific Interactive Patient Engagement Solutions Industry Analysis, Insights and Forecast, 2020-2032
- 9.1. Market Analysis, Insights and Forecast - by Component
- 9.1.1. Hardware
- 9.1.2. Software
- 9.1.3. Service
- 9.2. Market Analysis, Insights and Forecast - by Delivery Mode
- 9.2.1. Web-based and Cloud-based
- 9.2.2. On-Premise
- 9.3. Market Analysis, Insights and Forecast - by Application
- 9.3.1. Social Management
- 9.3.2. Fitness and Health Management
- 9.3.3. Home Healthcare Management
- 9.3.4. Financial Management
- 9.4. Market Analysis, Insights and Forecast - by End User
- 9.4.1. Provider
- 9.4.2. Payer
- 9.4.3. Patient
- 9.4.4. Other End Users
- 9.1. Market Analysis, Insights and Forecast - by Component
- 10. Middle East and Africa Interactive Patient Engagement Solutions Industry Analysis, Insights and Forecast, 2020-2032
- 10.1. Market Analysis, Insights and Forecast - by Component
- 10.1.1. Hardware
- 10.1.2. Software
- 10.1.3. Service
- 10.2. Market Analysis, Insights and Forecast - by Delivery Mode
- 10.2.1. Web-based and Cloud-based
- 10.2.2. On-Premise
- 10.3. Market Analysis, Insights and Forecast - by Application
- 10.3.1. Social Management
- 10.3.2. Fitness and Health Management
- 10.3.3. Home Healthcare Management
- 10.3.4. Financial Management
- 10.4. Market Analysis, Insights and Forecast - by End User
- 10.4.1. Provider
- 10.4.2. Payer
- 10.4.3. Patient
- 10.4.4. Other End Users
- 10.1. Market Analysis, Insights and Forecast - by Component
- 11. South America Interactive Patient Engagement Solutions Industry Analysis, Insights and Forecast, 2020-2032
- 11.1. Market Analysis, Insights and Forecast - by Component
- 11.1.1. Hardware
- 11.1.2. Software
- 11.1.3. Service
- 11.2. Market Analysis, Insights and Forecast - by Delivery Mode
- 11.2.1. Web-based and Cloud-based
- 11.2.2. On-Premise
- 11.3. Market Analysis, Insights and Forecast - by Application
- 11.3.1. Social Management
- 11.3.2. Fitness and Health Management
- 11.3.3. Home Healthcare Management
- 11.3.4. Financial Management
- 11.4. Market Analysis, Insights and Forecast - by End User
- 11.4.1. Provider
- 11.4.2. Payer
- 11.4.3. Patient
- 11.4.4. Other End Users
- 11.1. Market Analysis, Insights and Forecast - by Component
- 12. Competitive Analysis
- 12.1. Company Profiles
- 12.1.1 Athenahealth Inc
- 12.1.1.1. Company Overview
- 12.1.1.2. Products
- 12.1.1.3. Company Financials
- 12.1.1.4. SWOT Analysis
- 12.1.2 MEDHOST
- 12.1.2.1. Company Overview
- 12.1.2.2. Products
- 12.1.2.3. Company Financials
- 12.1.2.4. SWOT Analysis
- 12.1.3 Mckesson Corporation
- 12.1.3.1. Company Overview
- 12.1.3.2. Products
- 12.1.3.3. Company Financials
- 12.1.3.4. SWOT Analysis
- 12.1.4 Medecision Inc
- 12.1.4.1. Company Overview
- 12.1.4.2. Products
- 12.1.4.3. Company Financials
- 12.1.4.4. SWOT Analysis
- 12.1.5 GetWellNetwork Inc
- 12.1.5.1. Company Overview
- 12.1.5.2. Products
- 12.1.5.3. Company Financials
- 12.1.5.4. SWOT Analysis
- 12.1.6 Orion Health Ltd
- 12.1.6.1. Company Overview
- 12.1.6.2. Products
- 12.1.6.3. Company Financials
- 12.1.6.4. SWOT Analysis
- 12.1.7 Cerner Corporation
- 12.1.7.1. Company Overview
- 12.1.7.2. Products
- 12.1.7.3. Company Financials
- 12.1.7.4. SWOT Analysis
- 12.1.8 Welvu
- 12.1.8.1. Company Overview
- 12.1.8.2. Products
- 12.1.8.3. Company Financials
- 12.1.8.4. SWOT Analysis
- 12.1.9 Lincor Solutions
- 12.1.9.1. Company Overview
- 12.1.9.2. Products
- 12.1.9.3. Company Financials
- 12.1.9.4. SWOT Analysis
- 12.1.10 Yourcareuniverse Inc
- 12.1.10.1. Company Overview
- 12.1.10.2. Products
- 12.1.10.3. Company Financials
- 12.1.10.4. SWOT Analysis
- 12.1.11 Allscripts Healthcare Solutions Inc
- 12.1.11.1. Company Overview
- 12.1.11.2. Products
- 12.1.11.3. Company Financials
- 12.1.11.4. SWOT Analysis
- 12.1.12 IBM
- 12.1.12.1. Company Overview
- 12.1.12.2. Products
- 12.1.12.3. Company Financials
- 12.1.12.4. SWOT Analysis
- 12.1.1 Athenahealth Inc
- 12.2. Market Entropy
- 12.2.1 Company's Key Areas Served
- 12.2.2 Recent Developments
- 12.3. Company Market Share Analysis 2025
- 12.3.1 Top 5 Companies Market Share Analysis
- 12.3.2 Top 3 Companies Market Share Analysis
- 12.4. List of Potential Customers
- 13. Research Methodology
List of Figures
- Figure 1: Global Interactive Patient Engagement Solutions Industry Revenue Breakdown (Million, %) by Region 2025 & 2033
- Figure 2: Global Interactive Patient Engagement Solutions Industry Volume Breakdown (K Unit, %) by Region 2025 & 2033
- Figure 3: North America Interactive Patient Engagement Solutions Industry Revenue (Million), by Component 2025 & 2033
- Figure 4: North America Interactive Patient Engagement Solutions Industry Volume (K Unit), by Component 2025 & 2033
- Figure 5: North America Interactive Patient Engagement Solutions Industry Revenue Share (%), by Component 2025 & 2033
- Figure 6: North America Interactive Patient Engagement Solutions Industry Volume Share (%), by Component 2025 & 2033
- Figure 7: North America Interactive Patient Engagement Solutions Industry Revenue (Million), by Delivery Mode 2025 & 2033
- Figure 8: North America Interactive Patient Engagement Solutions Industry Volume (K Unit), by Delivery Mode 2025 & 2033
- Figure 9: North America Interactive Patient Engagement Solutions Industry Revenue Share (%), by Delivery Mode 2025 & 2033
- Figure 10: North America Interactive Patient Engagement Solutions Industry Volume Share (%), by Delivery Mode 2025 & 2033
- Figure 11: North America Interactive Patient Engagement Solutions Industry Revenue (Million), by Application 2025 & 2033
- Figure 12: North America Interactive Patient Engagement Solutions Industry Volume (K Unit), by Application 2025 & 2033
- Figure 13: North America Interactive Patient Engagement Solutions Industry Revenue Share (%), by Application 2025 & 2033
- Figure 14: North America Interactive Patient Engagement Solutions Industry Volume Share (%), by Application 2025 & 2033
- Figure 15: North America Interactive Patient Engagement Solutions Industry Revenue (Million), by End User 2025 & 2033
- Figure 16: North America Interactive Patient Engagement Solutions Industry Volume (K Unit), by End User 2025 & 2033
- Figure 17: North America Interactive Patient Engagement Solutions Industry Revenue Share (%), by End User 2025 & 2033
- Figure 18: North America Interactive Patient Engagement Solutions Industry Volume Share (%), by End User 2025 & 2033
- Figure 19: North America Interactive Patient Engagement Solutions Industry Revenue (Million), by Country 2025 & 2033
- Figure 20: North America Interactive Patient Engagement Solutions Industry Volume (K Unit), by Country 2025 & 2033
- Figure 21: North America Interactive Patient Engagement Solutions Industry Revenue Share (%), by Country 2025 & 2033
- Figure 22: North America Interactive Patient Engagement Solutions Industry Volume Share (%), by Country 2025 & 2033
- Figure 23: Europe Interactive Patient Engagement Solutions Industry Revenue (Million), by Component 2025 & 2033
- Figure 24: Europe Interactive Patient Engagement Solutions Industry Volume (K Unit), by Component 2025 & 2033
- Figure 25: Europe Interactive Patient Engagement Solutions Industry Revenue Share (%), by Component 2025 & 2033
- Figure 26: Europe Interactive Patient Engagement Solutions Industry Volume Share (%), by Component 2025 & 2033
- Figure 27: Europe Interactive Patient Engagement Solutions Industry Revenue (Million), by Delivery Mode 2025 & 2033
- Figure 28: Europe Interactive Patient Engagement Solutions Industry Volume (K Unit), by Delivery Mode 2025 & 2033
- Figure 29: Europe Interactive Patient Engagement Solutions Industry Revenue Share (%), by Delivery Mode 2025 & 2033
- Figure 30: Europe Interactive Patient Engagement Solutions Industry Volume Share (%), by Delivery Mode 2025 & 2033
- Figure 31: Europe Interactive Patient Engagement Solutions Industry Revenue (Million), by Application 2025 & 2033
- Figure 32: Europe Interactive Patient Engagement Solutions Industry Volume (K Unit), by Application 2025 & 2033
- Figure 33: Europe Interactive Patient Engagement Solutions Industry Revenue Share (%), by Application 2025 & 2033
- Figure 34: Europe Interactive Patient Engagement Solutions Industry Volume Share (%), by Application 2025 & 2033
- Figure 35: Europe Interactive Patient Engagement Solutions Industry Revenue (Million), by End User 2025 & 2033
- Figure 36: Europe Interactive Patient Engagement Solutions Industry Volume (K Unit), by End User 2025 & 2033
- Figure 37: Europe Interactive Patient Engagement Solutions Industry Revenue Share (%), by End User 2025 & 2033
- Figure 38: Europe Interactive Patient Engagement Solutions Industry Volume Share (%), by End User 2025 & 2033
- Figure 39: Europe Interactive Patient Engagement Solutions Industry Revenue (Million), by Country 2025 & 2033
- Figure 40: Europe Interactive Patient Engagement Solutions Industry Volume (K Unit), by Country 2025 & 2033
- Figure 41: Europe Interactive Patient Engagement Solutions Industry Revenue Share (%), by Country 2025 & 2033
- Figure 42: Europe Interactive Patient Engagement Solutions Industry Volume Share (%), by Country 2025 & 2033
- Figure 43: Asia Pacific Interactive Patient Engagement Solutions Industry Revenue (Million), by Component 2025 & 2033
- Figure 44: Asia Pacific Interactive Patient Engagement Solutions Industry Volume (K Unit), by Component 2025 & 2033
- Figure 45: Asia Pacific Interactive Patient Engagement Solutions Industry Revenue Share (%), by Component 2025 & 2033
- Figure 46: Asia Pacific Interactive Patient Engagement Solutions Industry Volume Share (%), by Component 2025 & 2033
- Figure 47: Asia Pacific Interactive Patient Engagement Solutions Industry Revenue (Million), by Delivery Mode 2025 & 2033
- Figure 48: Asia Pacific Interactive Patient Engagement Solutions Industry Volume (K Unit), by Delivery Mode 2025 & 2033
- Figure 49: Asia Pacific Interactive Patient Engagement Solutions Industry Revenue Share (%), by Delivery Mode 2025 & 2033
- Figure 50: Asia Pacific Interactive Patient Engagement Solutions Industry Volume Share (%), by Delivery Mode 2025 & 2033
- Figure 51: Asia Pacific Interactive Patient Engagement Solutions Industry Revenue (Million), by Application 2025 & 2033
- Figure 52: Asia Pacific Interactive Patient Engagement Solutions Industry Volume (K Unit), by Application 2025 & 2033
- Figure 53: Asia Pacific Interactive Patient Engagement Solutions Industry Revenue Share (%), by Application 2025 & 2033
- Figure 54: Asia Pacific Interactive Patient Engagement Solutions Industry Volume Share (%), by Application 2025 & 2033
- Figure 55: Asia Pacific Interactive Patient Engagement Solutions Industry Revenue (Million), by End User 2025 & 2033
- Figure 56: Asia Pacific Interactive Patient Engagement Solutions Industry Volume (K Unit), by End User 2025 & 2033
- Figure 57: Asia Pacific Interactive Patient Engagement Solutions Industry Revenue Share (%), by End User 2025 & 2033
- Figure 58: Asia Pacific Interactive Patient Engagement Solutions Industry Volume Share (%), by End User 2025 & 2033
- Figure 59: Asia Pacific Interactive Patient Engagement Solutions Industry Revenue (Million), by Country 2025 & 2033
- Figure 60: Asia Pacific Interactive Patient Engagement Solutions Industry Volume (K Unit), by Country 2025 & 2033
- Figure 61: Asia Pacific Interactive Patient Engagement Solutions Industry Revenue Share (%), by Country 2025 & 2033
- Figure 62: Asia Pacific Interactive Patient Engagement Solutions Industry Volume Share (%), by Country 2025 & 2033
- Figure 63: Middle East and Africa Interactive Patient Engagement Solutions Industry Revenue (Million), by Component 2025 & 2033
- Figure 64: Middle East and Africa Interactive Patient Engagement Solutions Industry Volume (K Unit), by Component 2025 & 2033
- Figure 65: Middle East and Africa Interactive Patient Engagement Solutions Industry Revenue Share (%), by Component 2025 & 2033
- Figure 66: Middle East and Africa Interactive Patient Engagement Solutions Industry Volume Share (%), by Component 2025 & 2033
- Figure 67: Middle East and Africa Interactive Patient Engagement Solutions Industry Revenue (Million), by Delivery Mode 2025 & 2033
- Figure 68: Middle East and Africa Interactive Patient Engagement Solutions Industry Volume (K Unit), by Delivery Mode 2025 & 2033
- Figure 69: Middle East and Africa Interactive Patient Engagement Solutions Industry Revenue Share (%), by Delivery Mode 2025 & 2033
- Figure 70: Middle East and Africa Interactive Patient Engagement Solutions Industry Volume Share (%), by Delivery Mode 2025 & 2033
- Figure 71: Middle East and Africa Interactive Patient Engagement Solutions Industry Revenue (Million), by Application 2025 & 2033
- Figure 72: Middle East and Africa Interactive Patient Engagement Solutions Industry Volume (K Unit), by Application 2025 & 2033
- Figure 73: Middle East and Africa Interactive Patient Engagement Solutions Industry Revenue Share (%), by Application 2025 & 2033
- Figure 74: Middle East and Africa Interactive Patient Engagement Solutions Industry Volume Share (%), by Application 2025 & 2033
- Figure 75: Middle East and Africa Interactive Patient Engagement Solutions Industry Revenue (Million), by End User 2025 & 2033
- Figure 76: Middle East and Africa Interactive Patient Engagement Solutions Industry Volume (K Unit), by End User 2025 & 2033
- Figure 77: Middle East and Africa Interactive Patient Engagement Solutions Industry Revenue Share (%), by End User 2025 & 2033
- Figure 78: Middle East and Africa Interactive Patient Engagement Solutions Industry Volume Share (%), by End User 2025 & 2033
- Figure 79: Middle East and Africa Interactive Patient Engagement Solutions Industry Revenue (Million), by Country 2025 & 2033
- Figure 80: Middle East and Africa Interactive Patient Engagement Solutions Industry Volume (K Unit), by Country 2025 & 2033
- Figure 81: Middle East and Africa Interactive Patient Engagement Solutions Industry Revenue Share (%), by Country 2025 & 2033
- Figure 82: Middle East and Africa Interactive Patient Engagement Solutions Industry Volume Share (%), by Country 2025 & 2033
- Figure 83: South America Interactive Patient Engagement Solutions Industry Revenue (Million), by Component 2025 & 2033
- Figure 84: South America Interactive Patient Engagement Solutions Industry Volume (K Unit), by Component 2025 & 2033
- Figure 85: South America Interactive Patient Engagement Solutions Industry Revenue Share (%), by Component 2025 & 2033
- Figure 86: South America Interactive Patient Engagement Solutions Industry Volume Share (%), by Component 2025 & 2033
- Figure 87: South America Interactive Patient Engagement Solutions Industry Revenue (Million), by Delivery Mode 2025 & 2033
- Figure 88: South America Interactive Patient Engagement Solutions Industry Volume (K Unit), by Delivery Mode 2025 & 2033
- Figure 89: South America Interactive Patient Engagement Solutions Industry Revenue Share (%), by Delivery Mode 2025 & 2033
- Figure 90: South America Interactive Patient Engagement Solutions Industry Volume Share (%), by Delivery Mode 2025 & 2033
- Figure 91: South America Interactive Patient Engagement Solutions Industry Revenue (Million), by Application 2025 & 2033
- Figure 92: South America Interactive Patient Engagement Solutions Industry Volume (K Unit), by Application 2025 & 2033
- Figure 93: South America Interactive Patient Engagement Solutions Industry Revenue Share (%), by Application 2025 & 2033
- Figure 94: South America Interactive Patient Engagement Solutions Industry Volume Share (%), by Application 2025 & 2033
- Figure 95: South America Interactive Patient Engagement Solutions Industry Revenue (Million), by End User 2025 & 2033
- Figure 96: South America Interactive Patient Engagement Solutions Industry Volume (K Unit), by End User 2025 & 2033
- Figure 97: South America Interactive Patient Engagement Solutions Industry Revenue Share (%), by End User 2025 & 2033
- Figure 98: South America Interactive Patient Engagement Solutions Industry Volume Share (%), by End User 2025 & 2033
- Figure 99: South America Interactive Patient Engagement Solutions Industry Revenue (Million), by Country 2025 & 2033
- Figure 100: South America Interactive Patient Engagement Solutions Industry Volume (K Unit), by Country 2025 & 2033
- Figure 101: South America Interactive Patient Engagement Solutions Industry Revenue Share (%), by Country 2025 & 2033
- Figure 102: South America Interactive Patient Engagement Solutions Industry Volume Share (%), by Country 2025 & 2033
List of Tables
- Table 1: Global Interactive Patient Engagement Solutions Industry Revenue Million Forecast, by Component 2020 & 2033
- Table 2: Global Interactive Patient Engagement Solutions Industry Volume K Unit Forecast, by Component 2020 & 2033
- Table 3: Global Interactive Patient Engagement Solutions Industry Revenue Million Forecast, by Delivery Mode 2020 & 2033
- Table 4: Global Interactive Patient Engagement Solutions Industry Volume K Unit Forecast, by Delivery Mode 2020 & 2033
- Table 5: Global Interactive Patient Engagement Solutions Industry Revenue Million Forecast, by Application 2020 & 2033
- Table 6: Global Interactive Patient Engagement Solutions Industry Volume K Unit Forecast, by Application 2020 & 2033
- Table 7: Global Interactive Patient Engagement Solutions Industry Revenue Million Forecast, by End User 2020 & 2033
- Table 8: Global Interactive Patient Engagement Solutions Industry Volume K Unit Forecast, by End User 2020 & 2033
- Table 9: Global Interactive Patient Engagement Solutions Industry Revenue Million Forecast, by Region 2020 & 2033
- Table 10: Global Interactive Patient Engagement Solutions Industry Volume K Unit Forecast, by Region 2020 & 2033
- Table 11: Global Interactive Patient Engagement Solutions Industry Revenue Million Forecast, by Component 2020 & 2033
- Table 12: Global Interactive Patient Engagement Solutions Industry Volume K Unit Forecast, by Component 2020 & 2033
- Table 13: Global Interactive Patient Engagement Solutions Industry Revenue Million Forecast, by Delivery Mode 2020 & 2033
- Table 14: Global Interactive Patient Engagement Solutions Industry Volume K Unit Forecast, by Delivery Mode 2020 & 2033
- Table 15: Global Interactive Patient Engagement Solutions Industry Revenue Million Forecast, by Application 2020 & 2033
- Table 16: Global Interactive Patient Engagement Solutions Industry Volume K Unit Forecast, by Application 2020 & 2033
- Table 17: Global Interactive Patient Engagement Solutions Industry Revenue Million Forecast, by End User 2020 & 2033
- Table 18: Global Interactive Patient Engagement Solutions Industry Volume K Unit Forecast, by End User 2020 & 2033
- Table 19: Global Interactive Patient Engagement Solutions Industry Revenue Million Forecast, by Country 2020 & 2033
- Table 20: Global Interactive Patient Engagement Solutions Industry Volume K Unit Forecast, by Country 2020 & 2033
- Table 21: United States Interactive Patient Engagement Solutions Industry Revenue (Million) Forecast, by Application 2020 & 2033
- Table 22: United States Interactive Patient Engagement Solutions Industry Volume (K Unit) Forecast, by Application 2020 & 2033
- Table 23: Canada Interactive Patient Engagement Solutions Industry Revenue (Million) Forecast, by Application 2020 & 2033
- Table 24: Canada Interactive Patient Engagement Solutions Industry Volume (K Unit) Forecast, by Application 2020 & 2033
- Table 25: Mexico Interactive Patient Engagement Solutions Industry Revenue (Million) Forecast, by Application 2020 & 2033
- Table 26: Mexico Interactive Patient Engagement Solutions Industry Volume (K Unit) Forecast, by Application 2020 & 2033
- Table 27: Global Interactive Patient Engagement Solutions Industry Revenue Million Forecast, by Component 2020 & 2033
- Table 28: Global Interactive Patient Engagement Solutions Industry Volume K Unit Forecast, by Component 2020 & 2033
- Table 29: Global Interactive Patient Engagement Solutions Industry Revenue Million Forecast, by Delivery Mode 2020 & 2033
- Table 30: Global Interactive Patient Engagement Solutions Industry Volume K Unit Forecast, by Delivery Mode 2020 & 2033
- Table 31: Global Interactive Patient Engagement Solutions Industry Revenue Million Forecast, by Application 2020 & 2033
- Table 32: Global Interactive Patient Engagement Solutions Industry Volume K Unit Forecast, by Application 2020 & 2033
- Table 33: Global Interactive Patient Engagement Solutions Industry Revenue Million Forecast, by End User 2020 & 2033
- Table 34: Global Interactive Patient Engagement Solutions Industry Volume K Unit Forecast, by End User 2020 & 2033
- Table 35: Global Interactive Patient Engagement Solutions Industry Revenue Million Forecast, by Country 2020 & 2033
- Table 36: Global Interactive Patient Engagement Solutions Industry Volume K Unit Forecast, by Country 2020 & 2033
- Table 37: Germany Interactive Patient Engagement Solutions Industry Revenue (Million) Forecast, by Application 2020 & 2033
- Table 38: Germany Interactive Patient Engagement Solutions Industry Volume (K Unit) Forecast, by Application 2020 & 2033
- Table 39: United Kingdom Interactive Patient Engagement Solutions Industry Revenue (Million) Forecast, by Application 2020 & 2033
- Table 40: United Kingdom Interactive Patient Engagement Solutions Industry Volume (K Unit) Forecast, by Application 2020 & 2033
- Table 41: France Interactive Patient Engagement Solutions Industry Revenue (Million) Forecast, by Application 2020 & 2033
- Table 42: France Interactive Patient Engagement Solutions Industry Volume (K Unit) Forecast, by Application 2020 & 2033
- Table 43: Italy Interactive Patient Engagement Solutions Industry Revenue (Million) Forecast, by Application 2020 & 2033
- Table 44: Italy Interactive Patient Engagement Solutions Industry Volume (K Unit) Forecast, by Application 2020 & 2033
- Table 45: Spain Interactive Patient Engagement Solutions Industry Revenue (Million) Forecast, by Application 2020 & 2033
- Table 46: Spain Interactive Patient Engagement Solutions Industry Volume (K Unit) Forecast, by Application 2020 & 2033
- Table 47: Rest of Europe Interactive Patient Engagement Solutions Industry Revenue (Million) Forecast, by Application 2020 & 2033
- Table 48: Rest of Europe Interactive Patient Engagement Solutions Industry Volume (K Unit) Forecast, by Application 2020 & 2033
- Table 49: Global Interactive Patient Engagement Solutions Industry Revenue Million Forecast, by Component 2020 & 2033
- Table 50: Global Interactive Patient Engagement Solutions Industry Volume K Unit Forecast, by Component 2020 & 2033
- Table 51: Global Interactive Patient Engagement Solutions Industry Revenue Million Forecast, by Delivery Mode 2020 & 2033
- Table 52: Global Interactive Patient Engagement Solutions Industry Volume K Unit Forecast, by Delivery Mode 2020 & 2033
- Table 53: Global Interactive Patient Engagement Solutions Industry Revenue Million Forecast, by Application 2020 & 2033
- Table 54: Global Interactive Patient Engagement Solutions Industry Volume K Unit Forecast, by Application 2020 & 2033
- Table 55: Global Interactive Patient Engagement Solutions Industry Revenue Million Forecast, by End User 2020 & 2033
- Table 56: Global Interactive Patient Engagement Solutions Industry Volume K Unit Forecast, by End User 2020 & 2033
- Table 57: Global Interactive Patient Engagement Solutions Industry Revenue Million Forecast, by Country 2020 & 2033
- Table 58: Global Interactive Patient Engagement Solutions Industry Volume K Unit Forecast, by Country 2020 & 2033
- Table 59: China Interactive Patient Engagement Solutions Industry Revenue (Million) Forecast, by Application 2020 & 2033
- Table 60: China Interactive Patient Engagement Solutions Industry Volume (K Unit) Forecast, by Application 2020 & 2033
- Table 61: Japan Interactive Patient Engagement Solutions Industry Revenue (Million) Forecast, by Application 2020 & 2033
- Table 62: Japan Interactive Patient Engagement Solutions Industry Volume (K Unit) Forecast, by Application 2020 & 2033
- Table 63: India Interactive Patient Engagement Solutions Industry Revenue (Million) Forecast, by Application 2020 & 2033
- Table 64: India Interactive Patient Engagement Solutions Industry Volume (K Unit) Forecast, by Application 2020 & 2033
- Table 65: Australia Interactive Patient Engagement Solutions Industry Revenue (Million) Forecast, by Application 2020 & 2033
- Table 66: Australia Interactive Patient Engagement Solutions Industry Volume (K Unit) Forecast, by Application 2020 & 2033
- Table 67: South Korea Interactive Patient Engagement Solutions Industry Revenue (Million) Forecast, by Application 2020 & 2033
- Table 68: South Korea Interactive Patient Engagement Solutions Industry Volume (K Unit) Forecast, by Application 2020 & 2033
- Table 69: Rest of Asia Pacific Interactive Patient Engagement Solutions Industry Revenue (Million) Forecast, by Application 2020 & 2033
- Table 70: Rest of Asia Pacific Interactive Patient Engagement Solutions Industry Volume (K Unit) Forecast, by Application 2020 & 2033
- Table 71: Global Interactive Patient Engagement Solutions Industry Revenue Million Forecast, by Component 2020 & 2033
- Table 72: Global Interactive Patient Engagement Solutions Industry Volume K Unit Forecast, by Component 2020 & 2033
- Table 73: Global Interactive Patient Engagement Solutions Industry Revenue Million Forecast, by Delivery Mode 2020 & 2033
- Table 74: Global Interactive Patient Engagement Solutions Industry Volume K Unit Forecast, by Delivery Mode 2020 & 2033
- Table 75: Global Interactive Patient Engagement Solutions Industry Revenue Million Forecast, by Application 2020 & 2033
- Table 76: Global Interactive Patient Engagement Solutions Industry Volume K Unit Forecast, by Application 2020 & 2033
- Table 77: Global Interactive Patient Engagement Solutions Industry Revenue Million Forecast, by End User 2020 & 2033
- Table 78: Global Interactive Patient Engagement Solutions Industry Volume K Unit Forecast, by End User 2020 & 2033
- Table 79: Global Interactive Patient Engagement Solutions Industry Revenue Million Forecast, by Country 2020 & 2033
- Table 80: Global Interactive Patient Engagement Solutions Industry Volume K Unit Forecast, by Country 2020 & 2033
- Table 81: GCC Interactive Patient Engagement Solutions Industry Revenue (Million) Forecast, by Application 2020 & 2033
- Table 82: GCC Interactive Patient Engagement Solutions Industry Volume (K Unit) Forecast, by Application 2020 & 2033
- Table 83: South Africa Interactive Patient Engagement Solutions Industry Revenue (Million) Forecast, by Application 2020 & 2033
- Table 84: South Africa Interactive Patient Engagement Solutions Industry Volume (K Unit) Forecast, by Application 2020 & 2033
- Table 85: Rest of Middle East and Africa Interactive Patient Engagement Solutions Industry Revenue (Million) Forecast, by Application 2020 & 2033
- Table 86: Rest of Middle East and Africa Interactive Patient Engagement Solutions Industry Volume (K Unit) Forecast, by Application 2020 & 2033
- Table 87: Global Interactive Patient Engagement Solutions Industry Revenue Million Forecast, by Component 2020 & 2033
- Table 88: Global Interactive Patient Engagement Solutions Industry Volume K Unit Forecast, by Component 2020 & 2033
- Table 89: Global Interactive Patient Engagement Solutions Industry Revenue Million Forecast, by Delivery Mode 2020 & 2033
- Table 90: Global Interactive Patient Engagement Solutions Industry Volume K Unit Forecast, by Delivery Mode 2020 & 2033
- Table 91: Global Interactive Patient Engagement Solutions Industry Revenue Million Forecast, by Application 2020 & 2033
- Table 92: Global Interactive Patient Engagement Solutions Industry Volume K Unit Forecast, by Application 2020 & 2033
- Table 93: Global Interactive Patient Engagement Solutions Industry Revenue Million Forecast, by End User 2020 & 2033
- Table 94: Global Interactive Patient Engagement Solutions Industry Volume K Unit Forecast, by End User 2020 & 2033
- Table 95: Global Interactive Patient Engagement Solutions Industry Revenue Million Forecast, by Country 2020 & 2033
- Table 96: Global Interactive Patient Engagement Solutions Industry Volume K Unit Forecast, by Country 2020 & 2033
- Table 97: Brazil Interactive Patient Engagement Solutions Industry Revenue (Million) Forecast, by Application 2020 & 2033
- Table 98: Brazil Interactive Patient Engagement Solutions Industry Volume (K Unit) Forecast, by Application 2020 & 2033
- Table 99: Argentina Interactive Patient Engagement Solutions Industry Revenue (Million) Forecast, by Application 2020 & 2033
- Table 100: Argentina Interactive Patient Engagement Solutions Industry Volume (K Unit) Forecast, by Application 2020 & 2033
- Table 101: Rest of South America Interactive Patient Engagement Solutions Industry Revenue (Million) Forecast, by Application 2020 & 2033
- Table 102: Rest of South America Interactive Patient Engagement Solutions Industry Volume (K Unit) Forecast, by Application 2020 & 2033
Frequently Asked Questions
1. What is the projected Compound Annual Growth Rate (CAGR) of the Interactive Patient Engagement Solutions Industry?
The projected CAGR is approximately 14.38%.
2. Which companies are prominent players in the Interactive Patient Engagement Solutions Industry?
Key companies in the market include Athenahealth Inc, MEDHOST, Mckesson Corporation, Medecision Inc, GetWellNetwork Inc, Orion Health Ltd, Cerner Corporation, Welvu, Lincor Solutions, Yourcareuniverse Inc , Allscripts Healthcare Solutions Inc, IBM.
3. What are the main segments of the Interactive Patient Engagement Solutions Industry?
The market segments include Component, Delivery Mode, Application, End User.
4. Can you provide details about the market size?
The market size is estimated to be USD 24.00 Million as of 2022.
5. What are some drivers contributing to market growth?
Rising Trend of Mobile Health Applications; Growing Popularity of Patient Engagement Solutions Among the Aging Population; Rising Investments and Technological advancements.
6. What are the notable trends driving market growth?
Web-based and Cloud-based Services Segment is Expected to Witness Growth Over the Forecast Period.
7. Are there any restraints impacting market growth?
Protection of Patient Information; Lack of Skilled IT Professionals in the Healthcare Industry.
8. Can you provide examples of recent developments in the market?
In March 2022, DeliverHealth launched its partner program. DeliverHealth program supports strategic partners within the eco-system, growing sales domestically and internationally while enabling healthcare organizations to simplify the daily complexities of healthcare, improve patient outcomes and reduce overall costs.
9. What pricing options are available for accessing the report?
Pricing options include single-user, multi-user, and enterprise licenses priced at USD 4750, USD 5250, and USD 8750 respectively.
10. Is the market size provided in terms of value or volume?
The market size is provided in terms of value, measured in Million and volume, measured in K Unit.
11. Are there any specific market keywords associated with the report?
Yes, the market keyword associated with the report is "Interactive Patient Engagement Solutions Industry," which aids in identifying and referencing the specific market segment covered.
12. How do I determine which pricing option suits my needs best?
The pricing options vary based on user requirements and access needs. Individual users may opt for single-user licenses, while businesses requiring broader access may choose multi-user or enterprise licenses for cost-effective access to the report.
13. Are there any additional resources or data provided in the Interactive Patient Engagement Solutions Industry report?
While the report offers comprehensive insights, it's advisable to review the specific contents or supplementary materials provided to ascertain if additional resources or data are available.
14. How can I stay updated on further developments or reports in the Interactive Patient Engagement Solutions Industry?
To stay informed about further developments, trends, and reports in the Interactive Patient Engagement Solutions Industry, consider subscribing to industry newsletters, following relevant companies and organizations, or regularly checking reputable industry news sources and publications.
Methodology
Step 1 - Identification of Relevant Samples Size from Population Database


Step 2 - Approaches for Defining Global Market Size (Value, Volume* & Price*)

Note*: In applicable scenarios
Step 3 - Data Sources
Primary Research
- Web Analytics
- Survey Reports
- Research Institute
- Latest Research Reports
- Opinion Leaders
Secondary Research
- Annual Reports
- White Paper
- Latest Press Release
- Industry Association
- Paid Database
- Investor Presentations

Step 4 - Data Triangulation
Involves using different sources of information in order to increase the validity of a study
These sources are likely to be stakeholders in a program - participants, other researchers, program staff, other community members, and so on.
Then we put all data in single framework & apply various statistical tools to find out the dynamic on the market.
During the analysis stage, feedback from the stakeholder groups would be compared to determine areas of agreement as well as areas of divergence