

Key Insights
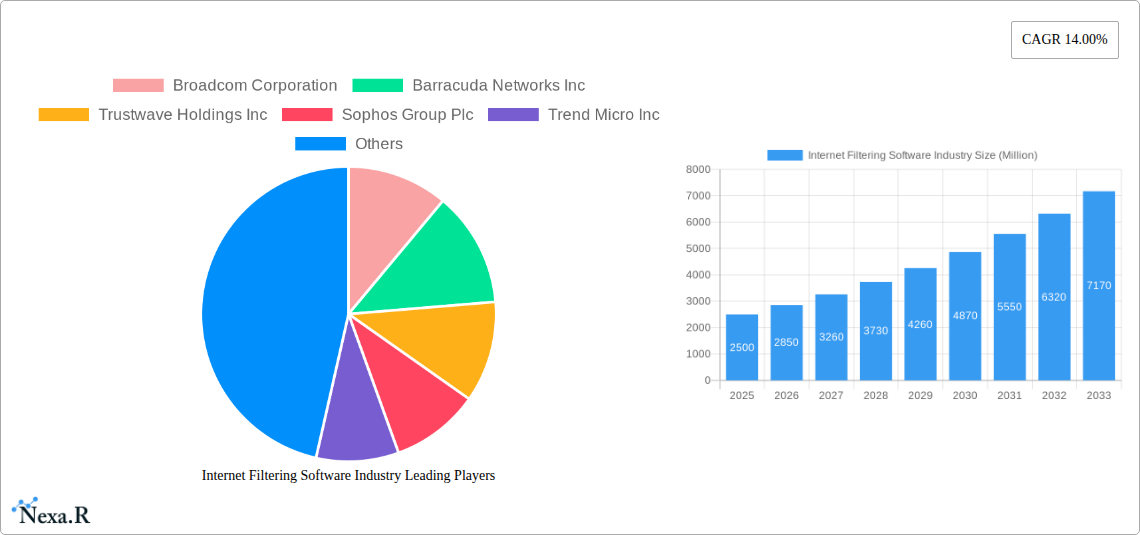
The internet filtering software market is experiencing robust growth, projected to reach a substantial size by 2033, driven by increasing cyber threats and stringent data privacy regulations across various sectors. The market's Compound Annual Growth Rate (CAGR) of 14% reflects a consistent demand for robust security solutions. Key drivers include the escalating sophistication of cyberattacks targeting businesses and institutions, the rising adoption of cloud-based solutions offering scalability and cost-effectiveness, and growing concerns about employee productivity and data breaches. The BFSI, IT & Telecom, and Government sectors are significant contributors to market growth, with a high reliance on sensitive data and stringent regulatory compliance requirements. Trends such as the increasing integration of AI and machine learning for advanced threat detection and the expanding adoption of multi-layered security strategies are further fueling market expansion. However, factors like high initial investment costs for deploying comprehensive filtering solutions and the potential for false positives impacting user experience act as restraints.
Market segmentation highlights the strong demand for cloud-based deployment, offering flexibility and accessibility. Solution-based offerings currently dominate the market, although the services segment is expected to show significant growth due to the increasing need for expert management and maintenance of complex security systems. Different filtering types, such as DNS filtering, keyword filtering, and URL filtering, cater to varied security needs, while the "Other Filtering Types" category likely encompasses emerging techniques addressing newer threats. Geographically, North America and Europe are currently leading the market, but the Asia-Pacific region is poised for significant growth, fueled by increasing internet penetration and digital transformation initiatives across diverse industries. The competitive landscape is characterized by a mix of established players and emerging innovative companies, indicating a dynamic market with continuous innovation. Future growth will likely be influenced by developments in threat intelligence, evolving regulatory frameworks, and the integration of internet filtering with broader cybersecurity strategies.
Internet Filtering Software Industry Market Report: 2019-2033
This comprehensive report provides an in-depth analysis of the Internet Filtering Software market, encompassing market dynamics, growth trends, regional insights, competitive landscape, and future outlook. The study covers the period from 2019 to 2033, with a focus on the 2025-2033 forecast period. The report segments the market by industry vertical, component, deployment mode, and filtering type, offering granular insights for strategic decision-making. The parent market is Cybersecurity Software, and the child market is Internet Filtering Software. Market size values are presented in Million units.
Internet Filtering Software Industry Market Dynamics & Structure
The Internet Filtering Software market is characterized by moderate concentration, with key players holding significant market share. Technological innovation, driven by increasing sophistication of cyber threats and evolving regulatory frameworks like GDPR and CCPA, are major drivers. The market witnesses continuous M&A activity, with larger players strategically acquiring smaller firms to expand their product portfolios and enhance their market reach. Competitive substitutes include other security solutions like firewalls and VPNs. End-user demographics are expanding beyond traditional enterprise users to encompass individuals and smaller businesses, fueled by the growing awareness of online security risks.
- Market Concentration: Moderately concentrated, with top 5 players holding approximately xx% market share in 2025.
- Technological Innovation: Focus on AI-powered threat detection, advanced URL filtering, and cloud-based deployment models.
- Regulatory Frameworks: Compliance requirements are driving adoption, particularly in regulated sectors like BFSI and Government.
- Competitive Substitutes: Firewalls, VPNs, and other security software pose competition.
- M&A Activity: An average of xx M&A deals per year observed during 2019-2024.
- End-User Demographics: Growing adoption among SMEs and individual users.
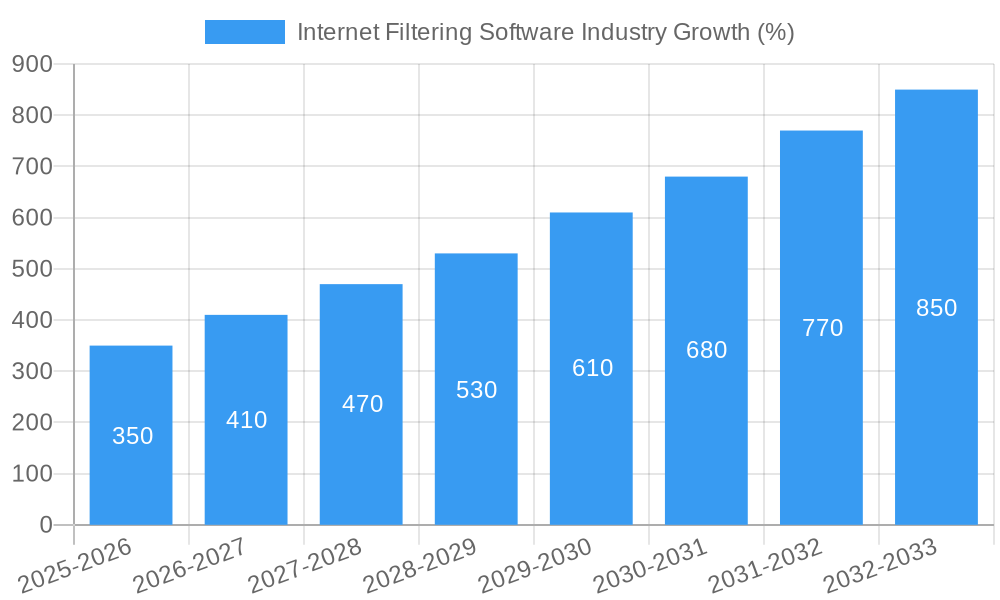
Internet Filtering Software Industry Growth Trends & Insights
The Internet Filtering Software market experienced robust growth during the historical period (2019-2024), primarily driven by rising cyber threats, increasing internet penetration, and the growing adoption of cloud computing. The market size was valued at xx million units in 2024 and is projected to reach xx million units by 2025, exhibiting a CAGR of xx% during the forecast period (2025-2033). Technological disruptions like the rise of AI and machine learning are further accelerating market growth. Consumer behavior is shifting towards more proactive and comprehensive security solutions, fueling demand for advanced filtering capabilities. Market penetration is expected to increase from xx% in 2025 to xx% by 2033.
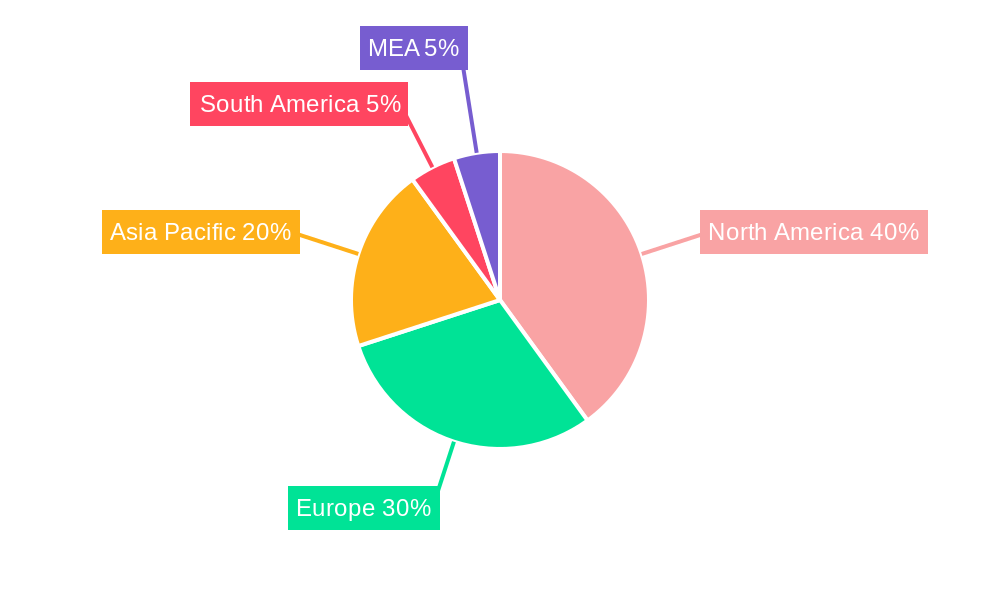
Dominant Regions, Countries, or Segments in Internet Filtering Software Industry
North America and Europe currently dominate the Internet Filtering Software market, driven by high internet penetration, stringent data privacy regulations, and a robust technological infrastructure. Within industry verticals, BFSI and Government sectors exhibit high adoption rates due to sensitive data handling requirements. The cloud deployment mode is witnessing significant growth due to its scalability and cost-effectiveness. URL filtering remains the most prevalent filtering type, although DNS filtering is gaining traction due to its efficiency.
- Leading Regions: North America and Europe.
- High-Growth Segments: Cloud deployment, BFSI, and Government verticals.
- Key Drivers: Stringent data privacy regulations, increasing cyber threats, and the shift towards cloud computing.
- Market Share: North America holds approximately xx% of the market share in 2025.
- Growth Potential: Asia Pacific region projected to witness highest growth during the forecast period.
Internet Filtering Software Industry Product Landscape
The market offers a diverse range of products, from basic URL filtering solutions to advanced AI-powered platforms offering comprehensive threat protection. Product innovations include enhanced threat intelligence feeds, improved user experience, and seamless integration with existing security infrastructure. Key performance indicators include detection rates, false positive rates, and overall system performance. Unique selling propositions often center on specific filtering capabilities, ease of management, and integration with other security tools.
Key Drivers, Barriers & Challenges in Internet Filtering Software Industry
Key Drivers:
- Increasing cyber threats and data breaches.
- Growing adoption of cloud computing and BYOD policies.
- Stringent data privacy regulations and compliance requirements.
Challenges and Restraints:
- High initial investment costs for advanced solutions.
- Complexity of implementation and management for large organizations.
- Potential for false positives and performance issues.
- Competition from established cybersecurity vendors and emerging players. This results in a xx% decrease in average profit margin for established companies.
Emerging Opportunities in Internet Filtering Software Industry
- Growing demand for AI-powered threat detection and response capabilities.
- Expansion into untapped markets like IoT security and industrial control systems.
- Development of integrated security solutions combining internet filtering with other security functionalities.
- Focus on user experience and ease of use to broaden adoption.
Growth Accelerators in the Internet Filtering Software Industry
Technological advancements in AI, machine learning, and cloud computing are driving long-term growth. Strategic partnerships between internet filtering vendors and other cybersecurity companies will lead to more comprehensive solutions. Market expansion into emerging economies with increasing internet penetration will also accelerate growth.
Key Players Shaping the Internet Filtering Software Industry Market
- Broadcom Corporation
- Barracuda Networks Inc
- Trustwave Holdings Inc
- Sophos Group Plc
- Trend Micro Inc
- Zscaler Inc
- Fortinet Inc
- McAfee Inc
- Cisco Systems Inc
- Webroot Inc
- AO Kaspersky Lab
- Forcepoint Inc
- Palo Alto Networks Inc
Notable Milestones in Internet Filtering Software Industry Sector
- 2020-03: Zscaler launches its Zscaler Internet Access platform with advanced threat protection capabilities.
- 2021-11: Fortinet announces its FortiGuard Security Services platform updates including improved URL filtering.
- 2022-05: McAfee acquires a smaller company specializing in cloud security solutions.
- 2023-02: Cisco integrates its internet filtering solution with its other security products. (Further specifics would need to be added based on actual events.)
In-Depth Internet Filtering Software Industry Market Outlook
The Internet Filtering Software market is poised for continued growth, driven by evolving technological capabilities, increasing cyber threats, and the growing need for robust online security. Strategic opportunities exist for companies focusing on AI-powered solutions, cloud-based deployments, and integration with other security products. The market’s long-term potential is significant, presenting attractive investment prospects for both established players and new entrants.
Internet Filtering Software Industry Segmentation
-
1. Component
- 1.1. Solution
- 1.2. Services
-
2. Deployment Mode
- 2.1. Cloud
- 2.2. On-premises
-
3. Filtering Type (Qualitative Study)
- 3.1. DNS Filtering
- 3.2. Keyword Filtering
- 3.3. URL Filtering
- 3.4. Other Filtering Types
-
4. Industry Vertical
- 4.1. BFSI
- 4.2. IT & Telecom
- 4.3. Government
- 4.4. Education
- 4.5. Other
Internet Filtering Software Industry Segmentation By Geography
- 1. North America
- 2. Europe
- 3. Asia Pacific
- 4. Latin America
- 5. Middle East and Africa
Internet Filtering Software Industry REPORT HIGHLIGHTS
| Aspects | Details |
|---|---|
| Study Period | 2019-2033 |
| Base Year | 2024 |
| Estimated Year | 2025 |
| Forecast Period | 2025-2033 |
| Historical Period | 2019-2024 |
| Growth Rate | CAGR of 14.00% from 2019-2033 |
| Segmentation |
|
Table of Contents
- 1. Introduction
- 1.1. Research Scope
- 1.2. Market Segmentation
- 1.3. Research Methodology
- 1.4. Definitions and Assumptions
- 2. Executive Summary
- 2.1. Introduction
- 3. Market Dynamics
- 3.1. Introduction
- 3.2. Market Drivers
- 3.2.1. ; Strict Government Regulations and the Need for Compliance; Growing BYOD Trend; Growing Online Malware and the Increasing Refinement Levels of Web Attacks
- 3.3. Market Restrains
- 3.3.1. ; Absence of Technical Capabilities and Skills in Handling Complex and Changing Environments
- 3.4. Market Trends
- 3.4.1. BFSI to Drive the Market Growth
- 4. Market Factor Analysis
- 4.1. Porters Five Forces
- 4.2. Supply/Value Chain
- 4.3. PESTEL analysis
- 4.4. Market Entropy
- 4.5. Patent/Trademark Analysis
- 5. Global Internet Filtering Software Industry Analysis, Insights and Forecast, 2019-2031
- 5.1. Market Analysis, Insights and Forecast - by Component
- 5.1.1. Solution
- 5.1.2. Services
- 5.2. Market Analysis, Insights and Forecast - by Deployment Mode
- 5.2.1. Cloud
- 5.2.2. On-premises
- 5.3. Market Analysis, Insights and Forecast - by Filtering Type (Qualitative Study)
- 5.3.1. DNS Filtering
- 5.3.2. Keyword Filtering
- 5.3.3. URL Filtering
- 5.3.4. Other Filtering Types
- 5.4. Market Analysis, Insights and Forecast - by Industry Vertical
- 5.4.1. BFSI
- 5.4.2. IT & Telecom
- 5.4.3. Government
- 5.4.4. Education
- 5.4.5. Other
- 5.5. Market Analysis, Insights and Forecast - by Region
- 5.5.1. North America
- 5.5.2. Europe
- 5.5.3. Asia Pacific
- 5.5.4. Latin America
- 5.5.5. Middle East and Africa
- 5.1. Market Analysis, Insights and Forecast - by Component
- 6. North America Internet Filtering Software Industry Analysis, Insights and Forecast, 2019-2031
- 6.1. Market Analysis, Insights and Forecast - by Component
- 6.1.1. Solution
- 6.1.2. Services
- 6.2. Market Analysis, Insights and Forecast - by Deployment Mode
- 6.2.1. Cloud
- 6.2.2. On-premises
- 6.3. Market Analysis, Insights and Forecast - by Filtering Type (Qualitative Study)
- 6.3.1. DNS Filtering
- 6.3.2. Keyword Filtering
- 6.3.3. URL Filtering
- 6.3.4. Other Filtering Types
- 6.4. Market Analysis, Insights and Forecast - by Industry Vertical
- 6.4.1. BFSI
- 6.4.2. IT & Telecom
- 6.4.3. Government
- 6.4.4. Education
- 6.4.5. Other
- 6.1. Market Analysis, Insights and Forecast - by Component
- 7. Europe Internet Filtering Software Industry Analysis, Insights and Forecast, 2019-2031
- 7.1. Market Analysis, Insights and Forecast - by Component
- 7.1.1. Solution
- 7.1.2. Services
- 7.2. Market Analysis, Insights and Forecast - by Deployment Mode
- 7.2.1. Cloud
- 7.2.2. On-premises
- 7.3. Market Analysis, Insights and Forecast - by Filtering Type (Qualitative Study)
- 7.3.1. DNS Filtering
- 7.3.2. Keyword Filtering
- 7.3.3. URL Filtering
- 7.3.4. Other Filtering Types
- 7.4. Market Analysis, Insights and Forecast - by Industry Vertical
- 7.4.1. BFSI
- 7.4.2. IT & Telecom
- 7.4.3. Government
- 7.4.4. Education
- 7.4.5. Other
- 7.1. Market Analysis, Insights and Forecast - by Component
- 8. Asia Pacific Internet Filtering Software Industry Analysis, Insights and Forecast, 2019-2031
- 8.1. Market Analysis, Insights and Forecast - by Component
- 8.1.1. Solution
- 8.1.2. Services
- 8.2. Market Analysis, Insights and Forecast - by Deployment Mode
- 8.2.1. Cloud
- 8.2.2. On-premises
- 8.3. Market Analysis, Insights and Forecast - by Filtering Type (Qualitative Study)
- 8.3.1. DNS Filtering
- 8.3.2. Keyword Filtering
- 8.3.3. URL Filtering
- 8.3.4. Other Filtering Types
- 8.4. Market Analysis, Insights and Forecast - by Industry Vertical
- 8.4.1. BFSI
- 8.4.2. IT & Telecom
- 8.4.3. Government
- 8.4.4. Education
- 8.4.5. Other
- 8.1. Market Analysis, Insights and Forecast - by Component
- 9. Latin America Internet Filtering Software Industry Analysis, Insights and Forecast, 2019-2031
- 9.1. Market Analysis, Insights and Forecast - by Component
- 9.1.1. Solution
- 9.1.2. Services
- 9.2. Market Analysis, Insights and Forecast - by Deployment Mode
- 9.2.1. Cloud
- 9.2.2. On-premises
- 9.3. Market Analysis, Insights and Forecast - by Filtering Type (Qualitative Study)
- 9.3.1. DNS Filtering
- 9.3.2. Keyword Filtering
- 9.3.3. URL Filtering
- 9.3.4. Other Filtering Types
- 9.4. Market Analysis, Insights and Forecast - by Industry Vertical
- 9.4.1. BFSI
- 9.4.2. IT & Telecom
- 9.4.3. Government
- 9.4.4. Education
- 9.4.5. Other
- 9.1. Market Analysis, Insights and Forecast - by Component
- 10. Middle East and Africa Internet Filtering Software Industry Analysis, Insights and Forecast, 2019-2031
- 10.1. Market Analysis, Insights and Forecast - by Component
- 10.1.1. Solution
- 10.1.2. Services
- 10.2. Market Analysis, Insights and Forecast - by Deployment Mode
- 10.2.1. Cloud
- 10.2.2. On-premises
- 10.3. Market Analysis, Insights and Forecast - by Filtering Type (Qualitative Study)
- 10.3.1. DNS Filtering
- 10.3.2. Keyword Filtering
- 10.3.3. URL Filtering
- 10.3.4. Other Filtering Types
- 10.4. Market Analysis, Insights and Forecast - by Industry Vertical
- 10.4.1. BFSI
- 10.4.2. IT & Telecom
- 10.4.3. Government
- 10.4.4. Education
- 10.4.5. Other
- 10.1. Market Analysis, Insights and Forecast - by Component
- 11. North America Internet Filtering Software Industry Analysis, Insights and Forecast, 2019-2031
- 11.1. Market Analysis, Insights and Forecast - By Country/Sub-region
- 11.1.1 United States
- 11.1.2 Canada
- 11.1.3 Mexico
- 12. Europe Internet Filtering Software Industry Analysis, Insights and Forecast, 2019-2031
- 12.1. Market Analysis, Insights and Forecast - By Country/Sub-region
- 12.1.1 Germany
- 12.1.2 United Kingdom
- 12.1.3 France
- 12.1.4 Spain
- 12.1.5 Italy
- 12.1.6 Spain
- 12.1.7 Belgium
- 12.1.8 Netherland
- 12.1.9 Nordics
- 12.1.10 Rest of Europe
- 13. Asia Pacific Internet Filtering Software Industry Analysis, Insights and Forecast, 2019-2031
- 13.1. Market Analysis, Insights and Forecast - By Country/Sub-region
- 13.1.1 China
- 13.1.2 Japan
- 13.1.3 India
- 13.1.4 South Korea
- 13.1.5 Southeast Asia
- 13.1.6 Australia
- 13.1.7 Indonesia
- 13.1.8 Phillipes
- 13.1.9 Singapore
- 13.1.10 Thailandc
- 13.1.11 Rest of Asia Pacific
- 14. South America Internet Filtering Software Industry Analysis, Insights and Forecast, 2019-2031
- 14.1. Market Analysis, Insights and Forecast - By Country/Sub-region
- 14.1.1 Brazil
- 14.1.2 Argentina
- 14.1.3 Peru
- 14.1.4 Chile
- 14.1.5 Colombia
- 14.1.6 Ecuador
- 14.1.7 Venezuela
- 14.1.8 Rest of South America
- 15. North America Internet Filtering Software Industry Analysis, Insights and Forecast, 2019-2031
- 15.1. Market Analysis, Insights and Forecast - By Country/Sub-region
- 15.1.1 United States
- 15.1.2 Canada
- 15.1.3 Mexico
- 16. MEA Internet Filtering Software Industry Analysis, Insights and Forecast, 2019-2031
- 16.1. Market Analysis, Insights and Forecast - By Country/Sub-region
- 16.1.1 United Arab Emirates
- 16.1.2 Saudi Arabia
- 16.1.3 South Africa
- 16.1.4 Rest of Middle East and Africa
- 17. Competitive Analysis
- 17.1. Global Market Share Analysis 2024
- 17.2. Company Profiles
- 17.2.1 Broadcom Corporation
- 17.2.1.1. Overview
- 17.2.1.2. Products
- 17.2.1.3. SWOT Analysis
- 17.2.1.4. Recent Developments
- 17.2.1.5. Financials (Based on Availability)
- 17.2.2 Barracuda Networks Inc
- 17.2.2.1. Overview
- 17.2.2.2. Products
- 17.2.2.3. SWOT Analysis
- 17.2.2.4. Recent Developments
- 17.2.2.5. Financials (Based on Availability)
- 17.2.3 Trustwave Holdings Inc
- 17.2.3.1. Overview
- 17.2.3.2. Products
- 17.2.3.3. SWOT Analysis
- 17.2.3.4. Recent Developments
- 17.2.3.5. Financials (Based on Availability)
- 17.2.4 Sophos Group Plc
- 17.2.4.1. Overview
- 17.2.4.2. Products
- 17.2.4.3. SWOT Analysis
- 17.2.4.4. Recent Developments
- 17.2.4.5. Financials (Based on Availability)
- 17.2.5 Trend Micro Inc
- 17.2.5.1. Overview
- 17.2.5.2. Products
- 17.2.5.3. SWOT Analysis
- 17.2.5.4. Recent Developments
- 17.2.5.5. Financials (Based on Availability)
- 17.2.6 Zscaler Inc
- 17.2.6.1. Overview
- 17.2.6.2. Products
- 17.2.6.3. SWOT Analysis
- 17.2.6.4. Recent Developments
- 17.2.6.5. Financials (Based on Availability)
- 17.2.7 Fortinet Inc
- 17.2.7.1. Overview
- 17.2.7.2. Products
- 17.2.7.3. SWOT Analysis
- 17.2.7.4. Recent Developments
- 17.2.7.5. Financials (Based on Availability)
- 17.2.8 McAfee Inc
- 17.2.8.1. Overview
- 17.2.8.2. Products
- 17.2.8.3. SWOT Analysis
- 17.2.8.4. Recent Developments
- 17.2.8.5. Financials (Based on Availability)
- 17.2.9 Cisco Systems Inc
- 17.2.9.1. Overview
- 17.2.9.2. Products
- 17.2.9.3. SWOT Analysis
- 17.2.9.4. Recent Developments
- 17.2.9.5. Financials (Based on Availability)
- 17.2.10 Webroot Inc
- 17.2.10.1. Overview
- 17.2.10.2. Products
- 17.2.10.3. SWOT Analysis
- 17.2.10.4. Recent Developments
- 17.2.10.5. Financials (Based on Availability)
- 17.2.11 AO Kaspersky Lab
- 17.2.11.1. Overview
- 17.2.11.2. Products
- 17.2.11.3. SWOT Analysis
- 17.2.11.4. Recent Developments
- 17.2.11.5. Financials (Based on Availability)
- 17.2.12 Forcepoint Inc
- 17.2.12.1. Overview
- 17.2.12.2. Products
- 17.2.12.3. SWOT Analysis
- 17.2.12.4. Recent Developments
- 17.2.12.5. Financials (Based on Availability)
- 17.2.13 Palo Alto Networks Inc
- 17.2.13.1. Overview
- 17.2.13.2. Products
- 17.2.13.3. SWOT Analysis
- 17.2.13.4. Recent Developments
- 17.2.13.5. Financials (Based on Availability)
- 17.2.1 Broadcom Corporation
List of Figures
- Figure 1: Global Internet Filtering Software Industry Revenue Breakdown (Million, %) by Region 2024 & 2032
- Figure 2: North America Internet Filtering Software Industry Revenue (Million), by Country 2024 & 2032
- Figure 3: North America Internet Filtering Software Industry Revenue Share (%), by Country 2024 & 2032
- Figure 4: Europe Internet Filtering Software Industry Revenue (Million), by Country 2024 & 2032
- Figure 5: Europe Internet Filtering Software Industry Revenue Share (%), by Country 2024 & 2032
- Figure 6: Asia Pacific Internet Filtering Software Industry Revenue (Million), by Country 2024 & 2032
- Figure 7: Asia Pacific Internet Filtering Software Industry Revenue Share (%), by Country 2024 & 2032
- Figure 8: South America Internet Filtering Software Industry Revenue (Million), by Country 2024 & 2032
- Figure 9: South America Internet Filtering Software Industry Revenue Share (%), by Country 2024 & 2032
- Figure 10: North America Internet Filtering Software Industry Revenue (Million), by Country 2024 & 2032
- Figure 11: North America Internet Filtering Software Industry Revenue Share (%), by Country 2024 & 2032
- Figure 12: MEA Internet Filtering Software Industry Revenue (Million), by Country 2024 & 2032
- Figure 13: MEA Internet Filtering Software Industry Revenue Share (%), by Country 2024 & 2032
- Figure 14: North America Internet Filtering Software Industry Revenue (Million), by Component 2024 & 2032
- Figure 15: North America Internet Filtering Software Industry Revenue Share (%), by Component 2024 & 2032
- Figure 16: North America Internet Filtering Software Industry Revenue (Million), by Deployment Mode 2024 & 2032
- Figure 17: North America Internet Filtering Software Industry Revenue Share (%), by Deployment Mode 2024 & 2032
- Figure 18: North America Internet Filtering Software Industry Revenue (Million), by Filtering Type (Qualitative Study) 2024 & 2032
- Figure 19: North America Internet Filtering Software Industry Revenue Share (%), by Filtering Type (Qualitative Study) 2024 & 2032
- Figure 20: North America Internet Filtering Software Industry Revenue (Million), by Industry Vertical 2024 & 2032
- Figure 21: North America Internet Filtering Software Industry Revenue Share (%), by Industry Vertical 2024 & 2032
- Figure 22: North America Internet Filtering Software Industry Revenue (Million), by Country 2024 & 2032
- Figure 23: North America Internet Filtering Software Industry Revenue Share (%), by Country 2024 & 2032
- Figure 24: Europe Internet Filtering Software Industry Revenue (Million), by Component 2024 & 2032
- Figure 25: Europe Internet Filtering Software Industry Revenue Share (%), by Component 2024 & 2032
- Figure 26: Europe Internet Filtering Software Industry Revenue (Million), by Deployment Mode 2024 & 2032
- Figure 27: Europe Internet Filtering Software Industry Revenue Share (%), by Deployment Mode 2024 & 2032
- Figure 28: Europe Internet Filtering Software Industry Revenue (Million), by Filtering Type (Qualitative Study) 2024 & 2032
- Figure 29: Europe Internet Filtering Software Industry Revenue Share (%), by Filtering Type (Qualitative Study) 2024 & 2032
- Figure 30: Europe Internet Filtering Software Industry Revenue (Million), by Industry Vertical 2024 & 2032
- Figure 31: Europe Internet Filtering Software Industry Revenue Share (%), by Industry Vertical 2024 & 2032
- Figure 32: Europe Internet Filtering Software Industry Revenue (Million), by Country 2024 & 2032
- Figure 33: Europe Internet Filtering Software Industry Revenue Share (%), by Country 2024 & 2032
- Figure 34: Asia Pacific Internet Filtering Software Industry Revenue (Million), by Component 2024 & 2032
- Figure 35: Asia Pacific Internet Filtering Software Industry Revenue Share (%), by Component 2024 & 2032
- Figure 36: Asia Pacific Internet Filtering Software Industry Revenue (Million), by Deployment Mode 2024 & 2032
- Figure 37: Asia Pacific Internet Filtering Software Industry Revenue Share (%), by Deployment Mode 2024 & 2032
- Figure 38: Asia Pacific Internet Filtering Software Industry Revenue (Million), by Filtering Type (Qualitative Study) 2024 & 2032
- Figure 39: Asia Pacific Internet Filtering Software Industry Revenue Share (%), by Filtering Type (Qualitative Study) 2024 & 2032
- Figure 40: Asia Pacific Internet Filtering Software Industry Revenue (Million), by Industry Vertical 2024 & 2032
- Figure 41: Asia Pacific Internet Filtering Software Industry Revenue Share (%), by Industry Vertical 2024 & 2032
- Figure 42: Asia Pacific Internet Filtering Software Industry Revenue (Million), by Country 2024 & 2032
- Figure 43: Asia Pacific Internet Filtering Software Industry Revenue Share (%), by Country 2024 & 2032
- Figure 44: Latin America Internet Filtering Software Industry Revenue (Million), by Component 2024 & 2032
- Figure 45: Latin America Internet Filtering Software Industry Revenue Share (%), by Component 2024 & 2032
- Figure 46: Latin America Internet Filtering Software Industry Revenue (Million), by Deployment Mode 2024 & 2032
- Figure 47: Latin America Internet Filtering Software Industry Revenue Share (%), by Deployment Mode 2024 & 2032
- Figure 48: Latin America Internet Filtering Software Industry Revenue (Million), by Filtering Type (Qualitative Study) 2024 & 2032
- Figure 49: Latin America Internet Filtering Software Industry Revenue Share (%), by Filtering Type (Qualitative Study) 2024 & 2032
- Figure 50: Latin America Internet Filtering Software Industry Revenue (Million), by Industry Vertical 2024 & 2032
- Figure 51: Latin America Internet Filtering Software Industry Revenue Share (%), by Industry Vertical 2024 & 2032
- Figure 52: Latin America Internet Filtering Software Industry Revenue (Million), by Country 2024 & 2032
- Figure 53: Latin America Internet Filtering Software Industry Revenue Share (%), by Country 2024 & 2032
- Figure 54: Middle East and Africa Internet Filtering Software Industry Revenue (Million), by Component 2024 & 2032
- Figure 55: Middle East and Africa Internet Filtering Software Industry Revenue Share (%), by Component 2024 & 2032
- Figure 56: Middle East and Africa Internet Filtering Software Industry Revenue (Million), by Deployment Mode 2024 & 2032
- Figure 57: Middle East and Africa Internet Filtering Software Industry Revenue Share (%), by Deployment Mode 2024 & 2032
- Figure 58: Middle East and Africa Internet Filtering Software Industry Revenue (Million), by Filtering Type (Qualitative Study) 2024 & 2032
- Figure 59: Middle East and Africa Internet Filtering Software Industry Revenue Share (%), by Filtering Type (Qualitative Study) 2024 & 2032
- Figure 60: Middle East and Africa Internet Filtering Software Industry Revenue (Million), by Industry Vertical 2024 & 2032
- Figure 61: Middle East and Africa Internet Filtering Software Industry Revenue Share (%), by Industry Vertical 2024 & 2032
- Figure 62: Middle East and Africa Internet Filtering Software Industry Revenue (Million), by Country 2024 & 2032
- Figure 63: Middle East and Africa Internet Filtering Software Industry Revenue Share (%), by Country 2024 & 2032
List of Tables
- Table 1: Global Internet Filtering Software Industry Revenue Million Forecast, by Region 2019 & 2032
- Table 2: Global Internet Filtering Software Industry Revenue Million Forecast, by Component 2019 & 2032
- Table 3: Global Internet Filtering Software Industry Revenue Million Forecast, by Deployment Mode 2019 & 2032
- Table 4: Global Internet Filtering Software Industry Revenue Million Forecast, by Filtering Type (Qualitative Study) 2019 & 2032
- Table 5: Global Internet Filtering Software Industry Revenue Million Forecast, by Industry Vertical 2019 & 2032
- Table 6: Global Internet Filtering Software Industry Revenue Million Forecast, by Region 2019 & 2032
- Table 7: Global Internet Filtering Software Industry Revenue Million Forecast, by Country 2019 & 2032
- Table 8: United States Internet Filtering Software Industry Revenue (Million) Forecast, by Application 2019 & 2032
- Table 9: Canada Internet Filtering Software Industry Revenue (Million) Forecast, by Application 2019 & 2032
- Table 10: Mexico Internet Filtering Software Industry Revenue (Million) Forecast, by Application 2019 & 2032
- Table 11: Global Internet Filtering Software Industry Revenue Million Forecast, by Country 2019 & 2032
- Table 12: Germany Internet Filtering Software Industry Revenue (Million) Forecast, by Application 2019 & 2032
- Table 13: United Kingdom Internet Filtering Software Industry Revenue (Million) Forecast, by Application 2019 & 2032
- Table 14: France Internet Filtering Software Industry Revenue (Million) Forecast, by Application 2019 & 2032
- Table 15: Spain Internet Filtering Software Industry Revenue (Million) Forecast, by Application 2019 & 2032
- Table 16: Italy Internet Filtering Software Industry Revenue (Million) Forecast, by Application 2019 & 2032
- Table 17: Spain Internet Filtering Software Industry Revenue (Million) Forecast, by Application 2019 & 2032
- Table 18: Belgium Internet Filtering Software Industry Revenue (Million) Forecast, by Application 2019 & 2032
- Table 19: Netherland Internet Filtering Software Industry Revenue (Million) Forecast, by Application 2019 & 2032
- Table 20: Nordics Internet Filtering Software Industry Revenue (Million) Forecast, by Application 2019 & 2032
- Table 21: Rest of Europe Internet Filtering Software Industry Revenue (Million) Forecast, by Application 2019 & 2032
- Table 22: Global Internet Filtering Software Industry Revenue Million Forecast, by Country 2019 & 2032
- Table 23: China Internet Filtering Software Industry Revenue (Million) Forecast, by Application 2019 & 2032
- Table 24: Japan Internet Filtering Software Industry Revenue (Million) Forecast, by Application 2019 & 2032
- Table 25: India Internet Filtering Software Industry Revenue (Million) Forecast, by Application 2019 & 2032
- Table 26: South Korea Internet Filtering Software Industry Revenue (Million) Forecast, by Application 2019 & 2032
- Table 27: Southeast Asia Internet Filtering Software Industry Revenue (Million) Forecast, by Application 2019 & 2032
- Table 28: Australia Internet Filtering Software Industry Revenue (Million) Forecast, by Application 2019 & 2032
- Table 29: Indonesia Internet Filtering Software Industry Revenue (Million) Forecast, by Application 2019 & 2032
- Table 30: Phillipes Internet Filtering Software Industry Revenue (Million) Forecast, by Application 2019 & 2032
- Table 31: Singapore Internet Filtering Software Industry Revenue (Million) Forecast, by Application 2019 & 2032
- Table 32: Thailandc Internet Filtering Software Industry Revenue (Million) Forecast, by Application 2019 & 2032
- Table 33: Rest of Asia Pacific Internet Filtering Software Industry Revenue (Million) Forecast, by Application 2019 & 2032
- Table 34: Global Internet Filtering Software Industry Revenue Million Forecast, by Country 2019 & 2032
- Table 35: Brazil Internet Filtering Software Industry Revenue (Million) Forecast, by Application 2019 & 2032
- Table 36: Argentina Internet Filtering Software Industry Revenue (Million) Forecast, by Application 2019 & 2032
- Table 37: Peru Internet Filtering Software Industry Revenue (Million) Forecast, by Application 2019 & 2032
- Table 38: Chile Internet Filtering Software Industry Revenue (Million) Forecast, by Application 2019 & 2032
- Table 39: Colombia Internet Filtering Software Industry Revenue (Million) Forecast, by Application 2019 & 2032
- Table 40: Ecuador Internet Filtering Software Industry Revenue (Million) Forecast, by Application 2019 & 2032
- Table 41: Venezuela Internet Filtering Software Industry Revenue (Million) Forecast, by Application 2019 & 2032
- Table 42: Rest of South America Internet Filtering Software Industry Revenue (Million) Forecast, by Application 2019 & 2032
- Table 43: Global Internet Filtering Software Industry Revenue Million Forecast, by Country 2019 & 2032
- Table 44: United States Internet Filtering Software Industry Revenue (Million) Forecast, by Application 2019 & 2032
- Table 45: Canada Internet Filtering Software Industry Revenue (Million) Forecast, by Application 2019 & 2032
- Table 46: Mexico Internet Filtering Software Industry Revenue (Million) Forecast, by Application 2019 & 2032
- Table 47: Global Internet Filtering Software Industry Revenue Million Forecast, by Country 2019 & 2032
- Table 48: United Arab Emirates Internet Filtering Software Industry Revenue (Million) Forecast, by Application 2019 & 2032
- Table 49: Saudi Arabia Internet Filtering Software Industry Revenue (Million) Forecast, by Application 2019 & 2032
- Table 50: South Africa Internet Filtering Software Industry Revenue (Million) Forecast, by Application 2019 & 2032
- Table 51: Rest of Middle East and Africa Internet Filtering Software Industry Revenue (Million) Forecast, by Application 2019 & 2032
- Table 52: Global Internet Filtering Software Industry Revenue Million Forecast, by Component 2019 & 2032
- Table 53: Global Internet Filtering Software Industry Revenue Million Forecast, by Deployment Mode 2019 & 2032
- Table 54: Global Internet Filtering Software Industry Revenue Million Forecast, by Filtering Type (Qualitative Study) 2019 & 2032
- Table 55: Global Internet Filtering Software Industry Revenue Million Forecast, by Industry Vertical 2019 & 2032
- Table 56: Global Internet Filtering Software Industry Revenue Million Forecast, by Country 2019 & 2032
- Table 57: Global Internet Filtering Software Industry Revenue Million Forecast, by Component 2019 & 2032
- Table 58: Global Internet Filtering Software Industry Revenue Million Forecast, by Deployment Mode 2019 & 2032
- Table 59: Global Internet Filtering Software Industry Revenue Million Forecast, by Filtering Type (Qualitative Study) 2019 & 2032
- Table 60: Global Internet Filtering Software Industry Revenue Million Forecast, by Industry Vertical 2019 & 2032
- Table 61: Global Internet Filtering Software Industry Revenue Million Forecast, by Country 2019 & 2032
- Table 62: Global Internet Filtering Software Industry Revenue Million Forecast, by Component 2019 & 2032
- Table 63: Global Internet Filtering Software Industry Revenue Million Forecast, by Deployment Mode 2019 & 2032
- Table 64: Global Internet Filtering Software Industry Revenue Million Forecast, by Filtering Type (Qualitative Study) 2019 & 2032
- Table 65: Global Internet Filtering Software Industry Revenue Million Forecast, by Industry Vertical 2019 & 2032
- Table 66: Global Internet Filtering Software Industry Revenue Million Forecast, by Country 2019 & 2032
- Table 67: Global Internet Filtering Software Industry Revenue Million Forecast, by Component 2019 & 2032
- Table 68: Global Internet Filtering Software Industry Revenue Million Forecast, by Deployment Mode 2019 & 2032
- Table 69: Global Internet Filtering Software Industry Revenue Million Forecast, by Filtering Type (Qualitative Study) 2019 & 2032
- Table 70: Global Internet Filtering Software Industry Revenue Million Forecast, by Industry Vertical 2019 & 2032
- Table 71: Global Internet Filtering Software Industry Revenue Million Forecast, by Country 2019 & 2032
- Table 72: Global Internet Filtering Software Industry Revenue Million Forecast, by Component 2019 & 2032
- Table 73: Global Internet Filtering Software Industry Revenue Million Forecast, by Deployment Mode 2019 & 2032
- Table 74: Global Internet Filtering Software Industry Revenue Million Forecast, by Filtering Type (Qualitative Study) 2019 & 2032
- Table 75: Global Internet Filtering Software Industry Revenue Million Forecast, by Industry Vertical 2019 & 2032
- Table 76: Global Internet Filtering Software Industry Revenue Million Forecast, by Country 2019 & 2032
Frequently Asked Questions
1. What is the projected Compound Annual Growth Rate (CAGR) of the Internet Filtering Software Industry?
The projected CAGR is approximately 14.00%.
2. Which companies are prominent players in the Internet Filtering Software Industry?
Key companies in the market include Broadcom Corporation, Barracuda Networks Inc, Trustwave Holdings Inc, Sophos Group Plc, Trend Micro Inc, Zscaler Inc, Fortinet Inc, McAfee Inc, Cisco Systems Inc, Webroot Inc, AO Kaspersky Lab, Forcepoint Inc, Palo Alto Networks Inc.
3. What are the main segments of the Internet Filtering Software Industry?
The market segments include Component, Deployment Mode , Filtering Type (Qualitative Study), Industry Vertical.
4. Can you provide details about the market size?
The market size is estimated to be USD XX Million as of 2022.
5. What are some drivers contributing to market growth?
; Strict Government Regulations and the Need for Compliance; Growing BYOD Trend; Growing Online Malware and the Increasing Refinement Levels of Web Attacks.
6. What are the notable trends driving market growth?
BFSI to Drive the Market Growth.
7. Are there any restraints impacting market growth?
; Absence of Technical Capabilities and Skills in Handling Complex and Changing Environments.
8. Can you provide examples of recent developments in the market?
N/A
9. What pricing options are available for accessing the report?
Pricing options include single-user, multi-user, and enterprise licenses priced at USD 4750, USD 5250, and USD 8750 respectively.
10. Is the market size provided in terms of value or volume?
The market size is provided in terms of value, measured in Million.
11. Are there any specific market keywords associated with the report?
Yes, the market keyword associated with the report is "Internet Filtering Software Industry," which aids in identifying and referencing the specific market segment covered.
12. How do I determine which pricing option suits my needs best?
The pricing options vary based on user requirements and access needs. Individual users may opt for single-user licenses, while businesses requiring broader access may choose multi-user or enterprise licenses for cost-effective access to the report.
13. Are there any additional resources or data provided in the Internet Filtering Software Industry report?
While the report offers comprehensive insights, it's advisable to review the specific contents or supplementary materials provided to ascertain if additional resources or data are available.
14. How can I stay updated on further developments or reports in the Internet Filtering Software Industry?
To stay informed about further developments, trends, and reports in the Internet Filtering Software Industry, consider subscribing to industry newsletters, following relevant companies and organizations, or regularly checking reputable industry news sources and publications.
Methodology
Step 1 - Identification of Relevant Samples Size from Population Database


Step 2 - Approaches for Defining Global Market Size (Value, Volume* & Price*)

Note*: In applicable scenarios
Step 3 - Data Sources
Primary Research
- Web Analytics
- Survey Reports
- Research Institute
- Latest Research Reports
- Opinion Leaders
Secondary Research
- Annual Reports
- White Paper
- Latest Press Release
- Industry Association
- Paid Database
- Investor Presentations

Step 4 - Data Triangulation
Involves using different sources of information in order to increase the validity of a study
These sources are likely to be stakeholders in a program - participants, other researchers, program staff, other community members, and so on.
Then we put all data in single framework & apply various statistical tools to find out the dynamic on the market.
During the analysis stage, feedback from the stakeholder groups would be compared to determine areas of agreement as well as areas of divergence
