

Key Insights
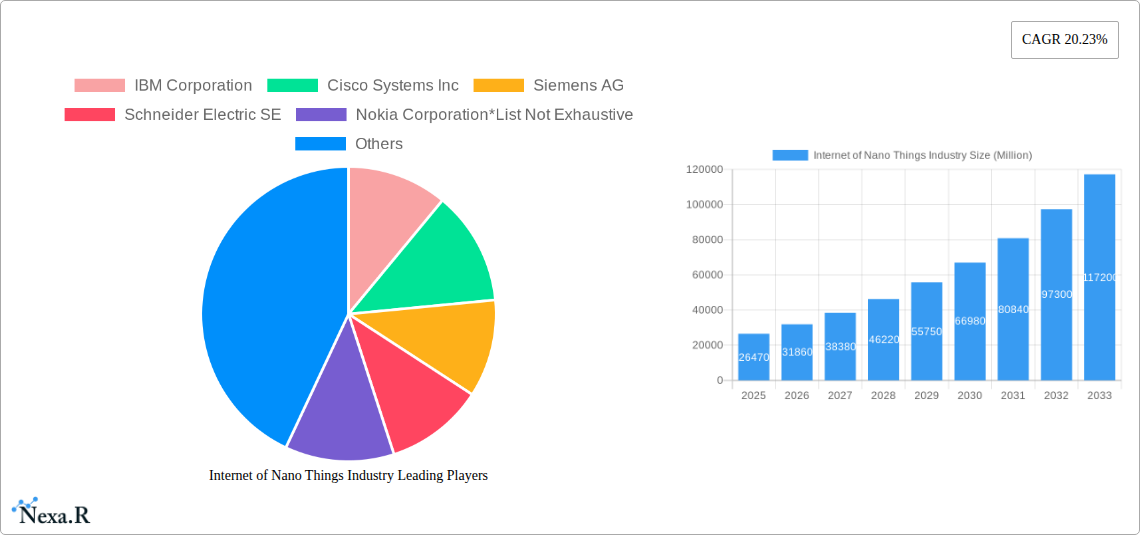
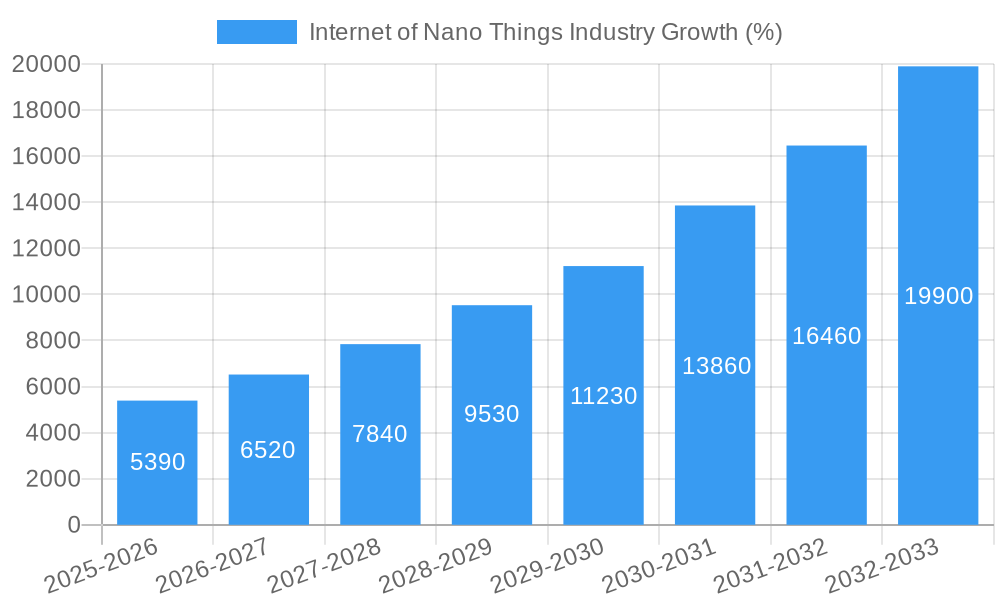
The Internet of Nano Things (IoNT) market is poised for explosive growth, projected to reach $26.47 billion by 2025 and maintain a Compound Annual Growth Rate (CAGR) of 20.23% from 2025 to 2033. This significant expansion is driven by several key factors. Advancements in nanotechnology are enabling the creation of smaller, more energy-efficient sensors and actuators, paving the way for widespread deployment across diverse sectors. The increasing demand for real-time data and improved monitoring capabilities in healthcare, logistics, and manufacturing are fueling adoption. Furthermore, the development of robust and secure communication protocols specifically designed for IoNT networks is addressing concerns about data management and security, thereby boosting market confidence. The integration of IoNT with artificial intelligence (AI) and machine learning (ML) algorithms enhances data analysis and predictive capabilities, creating further opportunities for innovation and growth.
Despite the promising outlook, the IoNT market faces certain challenges. The high initial investment costs associated with research and development, along with the complexities involved in integrating nanotechnology with existing infrastructure, can hinder widespread adoption. Moreover, standardization remains a hurdle, impacting interoperability across different IoNT devices and platforms. Regulatory uncertainty and concerns regarding the potential environmental impact of nanomaterials also need to be addressed. However, ongoing technological advancements, coupled with strategic investments from major players like IBM, Cisco, Siemens, and others, are likely to mitigate these challenges and further accelerate market growth. The segmentation by component (hardware, software, connectivity/services) and end-user (healthcare, logistics, defense, etc.) reflects the diverse applications and underlying technological components driving this dynamic sector. The robust growth projections across North America, Europe, and the Asia-Pacific region point to a globally significant market expansion over the forecast period.
Internet of Nano Things (IoNT) Industry Market Report: 2019-2033
This comprehensive report provides a detailed analysis of the burgeoning Internet of Nano Things (IoNT) industry, encompassing market dynamics, growth trends, key players, and future outlook. With a focus on both parent and child markets, this report offers invaluable insights for industry professionals, investors, and strategic decision-makers. The study period covers 2019-2033, with a base year of 2025 and a forecast period of 2025-2033. The market size is projected to reach xx Million units by 2033.
Internet of Nano Things Industry Market Dynamics & Structure
This section analyzes the IoNT market's competitive landscape, technological advancements, regulatory environment, and market consolidation trends. The market is characterized by moderate concentration, with several key players vying for market share. However, the emergence of numerous startups and the rapid pace of technological innovation contribute to a dynamic environment.
Market Concentration: The IoNT market exhibits a moderately concentrated structure with a Herfindahl-Hirschman Index (HHI) estimated at xx. The top five players hold an estimated xx% market share collectively in 2025.
Technological Innovation: Miniaturization, advanced materials science, and breakthroughs in sensor technology are driving IoNT growth. The integration of AI and machine learning further enhances data processing and analysis capabilities. However, challenges remain in power management, data security, and standardization.
Regulatory Landscape: Government regulations regarding data privacy, cybersecurity, and environmental impact are evolving and will increasingly shape industry practices. The lack of globally harmonized standards presents both challenges and opportunities for market players.
Competitive Substitutes: Traditional sensor technologies and wired communication networks offer alternative solutions in specific applications. The IoNT market's competitive advantage lies in its superior scalability, miniaturization, and energy efficiency.
End-User Demographics: The IoNT market caters to diverse end users across numerous sectors, including healthcare, manufacturing, and logistics. The increasing adoption of Industry 4.0 and the Internet of Things (IoT) fuels IoNT integration.
M&A Trends: The IoNT market has witnessed a modest number of mergers and acquisitions (M&A) deals in recent years (xx deals between 2019-2024). Strategic acquisitions are expected to accelerate as companies consolidate their positions and access emerging technologies.
Internet of Nano Things Industry Growth Trends & Insights
The IoNT market exhibits substantial growth potential, driven by technological advancements, increasing connectivity, and rising demand across diverse applications. The market is projected to experience a Compound Annual Growth Rate (CAGR) of xx% during the forecast period (2025-2033), reaching a market size of xx Million units by 2033. The historical period (2019-2024) showed a CAGR of xx%. Market penetration remains relatively low in several sectors but is steadily increasing as awareness and adoption improve. Technological disruptions such as the development of new nanomaterials and enhanced communication protocols continuously reshape the market landscape, fostering both opportunities and challenges. Consumer behavior shifts towards greater data-driven decision-making and automation further drive demand for IoNT solutions.
Dominant Regions, Countries, or Segments in Internet of Nano Things Industry
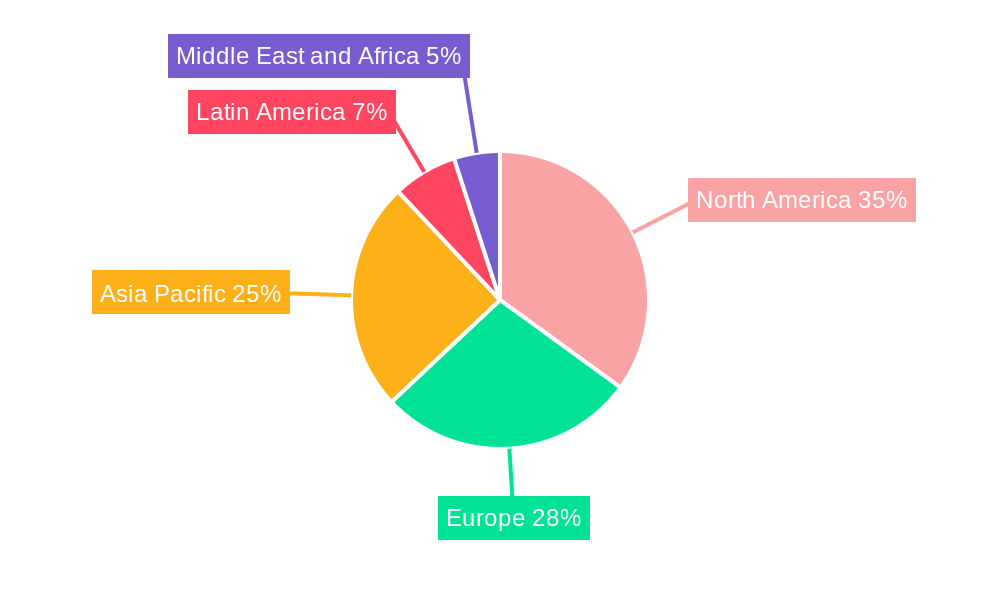
North America and Europe currently dominate the IoNT market, driven by robust technological infrastructure, substantial R&D investments, and a high concentration of key players. However, the Asia-Pacific region is expected to witness rapid growth in the coming years, propelled by increasing industrialization and a growing demand for smart solutions.
By Component: The hardware segment holds the largest market share in 2025 (xx%), followed by connectivity/services (xx%) and software (xx%). This is driven by the substantial investment in the development of advanced sensors, actuators, and communication modules.
By End User: The healthcare sector leads in IoNT adoption (xx%), driven by the need for improved diagnostics, personalized medicine, and remote patient monitoring. The manufacturing sector is experiencing significant growth (xx%), driven by the need for enhanced automation, predictive maintenance, and improved supply chain management.
- Key Drivers (North America): Strong government support for R&D, established technological infrastructure, and high consumer adoption rates.
- Key Drivers (Europe): Significant investments in IoT infrastructure, a robust regulatory framework, and a large number of innovative companies.
- Key Drivers (Asia-Pacific): Rapid industrialization, rising disposable incomes, and increasing government initiatives for digital transformation.
Internet of Nano Things Industry Product Landscape
The IoNT product landscape is characterized by a diverse range of sensors, actuators, communication modules, and software solutions. These products are designed to meet the specific requirements of various applications, with a focus on miniaturization, energy efficiency, and improved data accuracy. Innovations in nanomaterials are constantly improving sensor performance, leading to enhanced sensitivity, selectivity, and durability. Unique selling propositions often center on the cost-effectiveness, scalability, and enhanced capabilities of IoNT solutions compared to traditional technologies.
Key Drivers, Barriers & Challenges in Internet of Nano Things Industry
Key Drivers: The primary drivers of IoNT market growth include the increasing demand for miniaturized sensors, the proliferation of IoT devices, and advancements in nanotechnology. Government initiatives promoting Industry 4.0 and smart cities also significantly contribute.
Challenges & Restraints: Significant challenges include the high cost of development and implementation, concerns surrounding data security and privacy, and the lack of standardized communication protocols. Supply chain disruptions, primarily concerning the availability of rare-earth materials, also affect the market. Regulatory hurdles and difficulties integrating legacy systems further hinder widespread adoption. The high initial investment needed can also act as a barrier for smaller companies.
Emerging Opportunities in Internet of Nano Things Industry
Emerging opportunities lie in untapped markets, such as precision agriculture and environmental monitoring. The integration of IoNT with artificial intelligence and machine learning offers substantial potential for advanced data analytics and automation. New application areas like smart wearables and implantable medical devices continue to emerge. Consumer preferences are shifting towards personalized and data-driven services, creating further opportunities for IoNT solutions.
Growth Accelerators in the Internet of Nano Things Industry
Long-term growth will be driven by continued technological advancements in nanomaterials and sensor technologies. Strategic partnerships between technology providers and end-users will be crucial for accelerating adoption. The development of standardized communication protocols and robust cybersecurity measures will further boost market expansion. Expansion into new geographic regions and application areas will also fuel sustained growth.
Key Players Shaping the Internet of Nano Things Industry Market
- IBM Corporation
- Cisco Systems Inc
- Siemens AG
- Schneider Electric SE
- Nokia Corporation
- Juniper Networks Inc
- Qualcomm Inc
- SAP SE
- Intel Corporation *List Not Exhaustive
Notable Milestones in Internet of Nano Things Industry Sector
- February 2023: Siemens Digital Industries Software launched the latest update of its NX software, leveraging AI and advanced simulation capabilities to boost innovation among designers and engineers. This highlights the growing integration of advanced technologies within the IoNT ecosystem.
- January 2023: Advanced Material Development (AMD) secured an InnovateUK grant to validate its next-generation nanomaterial-based gas sensors, demonstrating the ongoing development of cutting-edge sensing technologies.
In-Depth Internet of Nano Things Industry Market Outlook
The IoNT market holds immense future potential, driven by the convergence of several technological advancements and the ever-growing demand for data-driven decision-making across various sectors. Strategic partnerships, the development of industry standards, and continued innovation in nanomaterials will play pivotal roles in unlocking this potential. The market's future growth trajectory is strongly linked to the ability to address challenges related to data security, cost reduction, and regulatory complexities. Companies focusing on developing cost-effective solutions and addressing data privacy concerns will secure a competitive edge and drive substantial market growth in the years to come.
Internet of Nano Things Industry Segmentation
-
1. Component
- 1.1. Hardware
- 1.2. Software
- 1.3. Connectivity/Services
-
2. End User
- 2.1. Healthcare
- 2.2. Logistics
- 2.3. Defense and Aerospace
- 2.4. Manufacturing
- 2.5. Energy and Power
- 2.6. Retail
- 2.7. Other End Users
Internet of Nano Things Industry Segmentation By Geography
- 1. North America
- 2. Europe
- 3. Asia
- 4. Australia and New Zealand
- 5. Latin America
- 6. Middle East and Africa
Internet of Nano Things Industry REPORT HIGHLIGHTS
| Aspects | Details |
|---|---|
| Study Period | 2019-2033 |
| Base Year | 2024 |
| Estimated Year | 2025 |
| Forecast Period | 2025-2033 |
| Historical Period | 2019-2024 |
| Growth Rate | CAGR of 20.23% from 2019-2033 |
| Segmentation |
|
Table of Contents
- 1. Introduction
- 1.1. Research Scope
- 1.2. Market Segmentation
- 1.3. Research Methodology
- 1.4. Definitions and Assumptions
- 2. Executive Summary
- 2.1. Introduction
- 3. Market Dynamics
- 3.1. Introduction
- 3.2. Market Drivers
- 3.2.1. Wide Connectivity in Devices; Emergence of Nanotechnology
- 3.3. Market Restrains
- 3.3.1. Security Concerns; High Costs of the Technology
- 3.4. Market Trends
- 3.4.1. Healthcare Industry is Expected to Hold a Significant Share
- 4. Market Factor Analysis
- 4.1. Porters Five Forces
- 4.2. Supply/Value Chain
- 4.3. PESTEL analysis
- 4.4. Market Entropy
- 4.5. Patent/Trademark Analysis
- 5. Global Internet of Nano Things Industry Analysis, Insights and Forecast, 2019-2031
- 5.1. Market Analysis, Insights and Forecast - by Component
- 5.1.1. Hardware
- 5.1.2. Software
- 5.1.3. Connectivity/Services
- 5.2. Market Analysis, Insights and Forecast - by End User
- 5.2.1. Healthcare
- 5.2.2. Logistics
- 5.2.3. Defense and Aerospace
- 5.2.4. Manufacturing
- 5.2.5. Energy and Power
- 5.2.6. Retail
- 5.2.7. Other End Users
- 5.3. Market Analysis, Insights and Forecast - by Region
- 5.3.1. North America
- 5.3.2. Europe
- 5.3.3. Asia
- 5.3.4. Australia and New Zealand
- 5.3.5. Latin America
- 5.3.6. Middle East and Africa
- 5.1. Market Analysis, Insights and Forecast - by Component
- 6. North America Internet of Nano Things Industry Analysis, Insights and Forecast, 2019-2031
- 6.1. Market Analysis, Insights and Forecast - by Component
- 6.1.1. Hardware
- 6.1.2. Software
- 6.1.3. Connectivity/Services
- 6.2. Market Analysis, Insights and Forecast - by End User
- 6.2.1. Healthcare
- 6.2.2. Logistics
- 6.2.3. Defense and Aerospace
- 6.2.4. Manufacturing
- 6.2.5. Energy and Power
- 6.2.6. Retail
- 6.2.7. Other End Users
- 6.1. Market Analysis, Insights and Forecast - by Component
- 7. Europe Internet of Nano Things Industry Analysis, Insights and Forecast, 2019-2031
- 7.1. Market Analysis, Insights and Forecast - by Component
- 7.1.1. Hardware
- 7.1.2. Software
- 7.1.3. Connectivity/Services
- 7.2. Market Analysis, Insights and Forecast - by End User
- 7.2.1. Healthcare
- 7.2.2. Logistics
- 7.2.3. Defense and Aerospace
- 7.2.4. Manufacturing
- 7.2.5. Energy and Power
- 7.2.6. Retail
- 7.2.7. Other End Users
- 7.1. Market Analysis, Insights and Forecast - by Component
- 8. Asia Internet of Nano Things Industry Analysis, Insights and Forecast, 2019-2031
- 8.1. Market Analysis, Insights and Forecast - by Component
- 8.1.1. Hardware
- 8.1.2. Software
- 8.1.3. Connectivity/Services
- 8.2. Market Analysis, Insights and Forecast - by End User
- 8.2.1. Healthcare
- 8.2.2. Logistics
- 8.2.3. Defense and Aerospace
- 8.2.4. Manufacturing
- 8.2.5. Energy and Power
- 8.2.6. Retail
- 8.2.7. Other End Users
- 8.1. Market Analysis, Insights and Forecast - by Component
- 9. Australia and New Zealand Internet of Nano Things Industry Analysis, Insights and Forecast, 2019-2031
- 9.1. Market Analysis, Insights and Forecast - by Component
- 9.1.1. Hardware
- 9.1.2. Software
- 9.1.3. Connectivity/Services
- 9.2. Market Analysis, Insights and Forecast - by End User
- 9.2.1. Healthcare
- 9.2.2. Logistics
- 9.2.3. Defense and Aerospace
- 9.2.4. Manufacturing
- 9.2.5. Energy and Power
- 9.2.6. Retail
- 9.2.7. Other End Users
- 9.1. Market Analysis, Insights and Forecast - by Component
- 10. Latin America Internet of Nano Things Industry Analysis, Insights and Forecast, 2019-2031
- 10.1. Market Analysis, Insights and Forecast - by Component
- 10.1.1. Hardware
- 10.1.2. Software
- 10.1.3. Connectivity/Services
- 10.2. Market Analysis, Insights and Forecast - by End User
- 10.2.1. Healthcare
- 10.2.2. Logistics
- 10.2.3. Defense and Aerospace
- 10.2.4. Manufacturing
- 10.2.5. Energy and Power
- 10.2.6. Retail
- 10.2.7. Other End Users
- 10.1. Market Analysis, Insights and Forecast - by Component
- 11. Middle East and Africa Internet of Nano Things Industry Analysis, Insights and Forecast, 2019-2031
- 11.1. Market Analysis, Insights and Forecast - by Component
- 11.1.1. Hardware
- 11.1.2. Software
- 11.1.3. Connectivity/Services
- 11.2. Market Analysis, Insights and Forecast - by End User
- 11.2.1. Healthcare
- 11.2.2. Logistics
- 11.2.3. Defense and Aerospace
- 11.2.4. Manufacturing
- 11.2.5. Energy and Power
- 11.2.6. Retail
- 11.2.7. Other End Users
- 11.1. Market Analysis, Insights and Forecast - by Component
- 12. North America Internet of Nano Things Industry Analysis, Insights and Forecast, 2019-2031
- 12.1. Market Analysis, Insights and Forecast - By Country/Sub-region
- 12.1.1.
- 13. Europe Internet of Nano Things Industry Analysis, Insights and Forecast, 2019-2031
- 13.1. Market Analysis, Insights and Forecast - By Country/Sub-region
- 13.1.1.
- 14. Asia Pacific Internet of Nano Things Industry Analysis, Insights and Forecast, 2019-2031
- 14.1. Market Analysis, Insights and Forecast - By Country/Sub-region
- 14.1.1.
- 15. Latin America Internet of Nano Things Industry Analysis, Insights and Forecast, 2019-2031
- 15.1. Market Analysis, Insights and Forecast - By Country/Sub-region
- 15.1.1.
- 16. Middle East and Africa Internet of Nano Things Industry Analysis, Insights and Forecast, 2019-2031
- 16.1. Market Analysis, Insights and Forecast - By Country/Sub-region
- 16.1.1.
- 17. Competitive Analysis
- 17.1. Global Market Share Analysis 2024
- 17.2. Company Profiles
- 17.2.1 IBM Corporation
- 17.2.1.1. Overview
- 17.2.1.2. Products
- 17.2.1.3. SWOT Analysis
- 17.2.1.4. Recent Developments
- 17.2.1.5. Financials (Based on Availability)
- 17.2.2 Cisco Systems Inc
- 17.2.2.1. Overview
- 17.2.2.2. Products
- 17.2.2.3. SWOT Analysis
- 17.2.2.4. Recent Developments
- 17.2.2.5. Financials (Based on Availability)
- 17.2.3 Siemens AG
- 17.2.3.1. Overview
- 17.2.3.2. Products
- 17.2.3.3. SWOT Analysis
- 17.2.3.4. Recent Developments
- 17.2.3.5. Financials (Based on Availability)
- 17.2.4 Schneider Electric SE
- 17.2.4.1. Overview
- 17.2.4.2. Products
- 17.2.4.3. SWOT Analysis
- 17.2.4.4. Recent Developments
- 17.2.4.5. Financials (Based on Availability)
- 17.2.5 Nokia Corporation*List Not Exhaustive
- 17.2.5.1. Overview
- 17.2.5.2. Products
- 17.2.5.3. SWOT Analysis
- 17.2.5.4. Recent Developments
- 17.2.5.5. Financials (Based on Availability)
- 17.2.6 Juniper Networks Inc
- 17.2.6.1. Overview
- 17.2.6.2. Products
- 17.2.6.3. SWOT Analysis
- 17.2.6.4. Recent Developments
- 17.2.6.5. Financials (Based on Availability)
- 17.2.7 Qualcomm Inc
- 17.2.7.1. Overview
- 17.2.7.2. Products
- 17.2.7.3. SWOT Analysis
- 17.2.7.4. Recent Developments
- 17.2.7.5. Financials (Based on Availability)
- 17.2.8 SAP SE
- 17.2.8.1. Overview
- 17.2.8.2. Products
- 17.2.8.3. SWOT Analysis
- 17.2.8.4. Recent Developments
- 17.2.8.5. Financials (Based on Availability)
- 17.2.9 Intel Corporation
- 17.2.9.1. Overview
- 17.2.9.2. Products
- 17.2.9.3. SWOT Analysis
- 17.2.9.4. Recent Developments
- 17.2.9.5. Financials (Based on Availability)
- 17.2.1 IBM Corporation
List of Figures
- Figure 1: Global Internet of Nano Things Industry Revenue Breakdown (Million, %) by Region 2024 & 2032
- Figure 2: North America Internet of Nano Things Industry Revenue (Million), by Country 2024 & 2032
- Figure 3: North America Internet of Nano Things Industry Revenue Share (%), by Country 2024 & 2032
- Figure 4: Europe Internet of Nano Things Industry Revenue (Million), by Country 2024 & 2032
- Figure 5: Europe Internet of Nano Things Industry Revenue Share (%), by Country 2024 & 2032
- Figure 6: Asia Pacific Internet of Nano Things Industry Revenue (Million), by Country 2024 & 2032
- Figure 7: Asia Pacific Internet of Nano Things Industry Revenue Share (%), by Country 2024 & 2032
- Figure 8: Latin America Internet of Nano Things Industry Revenue (Million), by Country 2024 & 2032
- Figure 9: Latin America Internet of Nano Things Industry Revenue Share (%), by Country 2024 & 2032
- Figure 10: Middle East and Africa Internet of Nano Things Industry Revenue (Million), by Country 2024 & 2032
- Figure 11: Middle East and Africa Internet of Nano Things Industry Revenue Share (%), by Country 2024 & 2032
- Figure 12: North America Internet of Nano Things Industry Revenue (Million), by Component 2024 & 2032
- Figure 13: North America Internet of Nano Things Industry Revenue Share (%), by Component 2024 & 2032
- Figure 14: North America Internet of Nano Things Industry Revenue (Million), by End User 2024 & 2032
- Figure 15: North America Internet of Nano Things Industry Revenue Share (%), by End User 2024 & 2032
- Figure 16: North America Internet of Nano Things Industry Revenue (Million), by Country 2024 & 2032
- Figure 17: North America Internet of Nano Things Industry Revenue Share (%), by Country 2024 & 2032
- Figure 18: Europe Internet of Nano Things Industry Revenue (Million), by Component 2024 & 2032
- Figure 19: Europe Internet of Nano Things Industry Revenue Share (%), by Component 2024 & 2032
- Figure 20: Europe Internet of Nano Things Industry Revenue (Million), by End User 2024 & 2032
- Figure 21: Europe Internet of Nano Things Industry Revenue Share (%), by End User 2024 & 2032
- Figure 22: Europe Internet of Nano Things Industry Revenue (Million), by Country 2024 & 2032
- Figure 23: Europe Internet of Nano Things Industry Revenue Share (%), by Country 2024 & 2032
- Figure 24: Asia Internet of Nano Things Industry Revenue (Million), by Component 2024 & 2032
- Figure 25: Asia Internet of Nano Things Industry Revenue Share (%), by Component 2024 & 2032
- Figure 26: Asia Internet of Nano Things Industry Revenue (Million), by End User 2024 & 2032
- Figure 27: Asia Internet of Nano Things Industry Revenue Share (%), by End User 2024 & 2032
- Figure 28: Asia Internet of Nano Things Industry Revenue (Million), by Country 2024 & 2032
- Figure 29: Asia Internet of Nano Things Industry Revenue Share (%), by Country 2024 & 2032
- Figure 30: Australia and New Zealand Internet of Nano Things Industry Revenue (Million), by Component 2024 & 2032
- Figure 31: Australia and New Zealand Internet of Nano Things Industry Revenue Share (%), by Component 2024 & 2032
- Figure 32: Australia and New Zealand Internet of Nano Things Industry Revenue (Million), by End User 2024 & 2032
- Figure 33: Australia and New Zealand Internet of Nano Things Industry Revenue Share (%), by End User 2024 & 2032
- Figure 34: Australia and New Zealand Internet of Nano Things Industry Revenue (Million), by Country 2024 & 2032
- Figure 35: Australia and New Zealand Internet of Nano Things Industry Revenue Share (%), by Country 2024 & 2032
- Figure 36: Latin America Internet of Nano Things Industry Revenue (Million), by Component 2024 & 2032
- Figure 37: Latin America Internet of Nano Things Industry Revenue Share (%), by Component 2024 & 2032
- Figure 38: Latin America Internet of Nano Things Industry Revenue (Million), by End User 2024 & 2032
- Figure 39: Latin America Internet of Nano Things Industry Revenue Share (%), by End User 2024 & 2032
- Figure 40: Latin America Internet of Nano Things Industry Revenue (Million), by Country 2024 & 2032
- Figure 41: Latin America Internet of Nano Things Industry Revenue Share (%), by Country 2024 & 2032
- Figure 42: Middle East and Africa Internet of Nano Things Industry Revenue (Million), by Component 2024 & 2032
- Figure 43: Middle East and Africa Internet of Nano Things Industry Revenue Share (%), by Component 2024 & 2032
- Figure 44: Middle East and Africa Internet of Nano Things Industry Revenue (Million), by End User 2024 & 2032
- Figure 45: Middle East and Africa Internet of Nano Things Industry Revenue Share (%), by End User 2024 & 2032
- Figure 46: Middle East and Africa Internet of Nano Things Industry Revenue (Million), by Country 2024 & 2032
- Figure 47: Middle East and Africa Internet of Nano Things Industry Revenue Share (%), by Country 2024 & 2032
List of Tables
- Table 1: Global Internet of Nano Things Industry Revenue Million Forecast, by Region 2019 & 2032
- Table 2: Global Internet of Nano Things Industry Revenue Million Forecast, by Component 2019 & 2032
- Table 3: Global Internet of Nano Things Industry Revenue Million Forecast, by End User 2019 & 2032
- Table 4: Global Internet of Nano Things Industry Revenue Million Forecast, by Region 2019 & 2032
- Table 5: Global Internet of Nano Things Industry Revenue Million Forecast, by Country 2019 & 2032
- Table 6: Internet of Nano Things Industry Revenue (Million) Forecast, by Application 2019 & 2032
- Table 7: Global Internet of Nano Things Industry Revenue Million Forecast, by Country 2019 & 2032
- Table 8: Internet of Nano Things Industry Revenue (Million) Forecast, by Application 2019 & 2032
- Table 9: Global Internet of Nano Things Industry Revenue Million Forecast, by Country 2019 & 2032
- Table 10: Internet of Nano Things Industry Revenue (Million) Forecast, by Application 2019 & 2032
- Table 11: Global Internet of Nano Things Industry Revenue Million Forecast, by Country 2019 & 2032
- Table 12: Internet of Nano Things Industry Revenue (Million) Forecast, by Application 2019 & 2032
- Table 13: Global Internet of Nano Things Industry Revenue Million Forecast, by Country 2019 & 2032
- Table 14: Internet of Nano Things Industry Revenue (Million) Forecast, by Application 2019 & 2032
- Table 15: Global Internet of Nano Things Industry Revenue Million Forecast, by Component 2019 & 2032
- Table 16: Global Internet of Nano Things Industry Revenue Million Forecast, by End User 2019 & 2032
- Table 17: Global Internet of Nano Things Industry Revenue Million Forecast, by Country 2019 & 2032
- Table 18: Global Internet of Nano Things Industry Revenue Million Forecast, by Component 2019 & 2032
- Table 19: Global Internet of Nano Things Industry Revenue Million Forecast, by End User 2019 & 2032
- Table 20: Global Internet of Nano Things Industry Revenue Million Forecast, by Country 2019 & 2032
- Table 21: Global Internet of Nano Things Industry Revenue Million Forecast, by Component 2019 & 2032
- Table 22: Global Internet of Nano Things Industry Revenue Million Forecast, by End User 2019 & 2032
- Table 23: Global Internet of Nano Things Industry Revenue Million Forecast, by Country 2019 & 2032
- Table 24: Global Internet of Nano Things Industry Revenue Million Forecast, by Component 2019 & 2032
- Table 25: Global Internet of Nano Things Industry Revenue Million Forecast, by End User 2019 & 2032
- Table 26: Global Internet of Nano Things Industry Revenue Million Forecast, by Country 2019 & 2032
- Table 27: Global Internet of Nano Things Industry Revenue Million Forecast, by Component 2019 & 2032
- Table 28: Global Internet of Nano Things Industry Revenue Million Forecast, by End User 2019 & 2032
- Table 29: Global Internet of Nano Things Industry Revenue Million Forecast, by Country 2019 & 2032
- Table 30: Global Internet of Nano Things Industry Revenue Million Forecast, by Component 2019 & 2032
- Table 31: Global Internet of Nano Things Industry Revenue Million Forecast, by End User 2019 & 2032
- Table 32: Global Internet of Nano Things Industry Revenue Million Forecast, by Country 2019 & 2032
Frequently Asked Questions
1. What is the projected Compound Annual Growth Rate (CAGR) of the Internet of Nano Things Industry?
The projected CAGR is approximately 20.23%.
2. Which companies are prominent players in the Internet of Nano Things Industry?
Key companies in the market include IBM Corporation, Cisco Systems Inc, Siemens AG, Schneider Electric SE, Nokia Corporation*List Not Exhaustive, Juniper Networks Inc, Qualcomm Inc, SAP SE, Intel Corporation.
3. What are the main segments of the Internet of Nano Things Industry?
The market segments include Component, End User.
4. Can you provide details about the market size?
The market size is estimated to be USD 26.47 Million as of 2022.
5. What are some drivers contributing to market growth?
Wide Connectivity in Devices; Emergence of Nanotechnology.
6. What are the notable trends driving market growth?
Healthcare Industry is Expected to Hold a Significant Share.
7. Are there any restraints impacting market growth?
Security Concerns; High Costs of the Technology.
8. Can you provide examples of recent developments in the market?
February 2023: Siemens Digital Industries Software launched the latest update of its industry-leading NX software, part of the Xcelerator portfolio of software and services. The newest update of NX software leverages advanced technologies, such as artificial intelligence (AI) and advanced simulation capabilities, while continuing to invest in significant productivity and capability enhancements to enable its community of designers, engineers, and manufacturers to innovate more quickly.
9. What pricing options are available for accessing the report?
Pricing options include single-user, multi-user, and enterprise licenses priced at USD 4750, USD 5250, and USD 8750 respectively.
10. Is the market size provided in terms of value or volume?
The market size is provided in terms of value, measured in Million.
11. Are there any specific market keywords associated with the report?
Yes, the market keyword associated with the report is "Internet of Nano Things Industry," which aids in identifying and referencing the specific market segment covered.
12. How do I determine which pricing option suits my needs best?
The pricing options vary based on user requirements and access needs. Individual users may opt for single-user licenses, while businesses requiring broader access may choose multi-user or enterprise licenses for cost-effective access to the report.
13. Are there any additional resources or data provided in the Internet of Nano Things Industry report?
While the report offers comprehensive insights, it's advisable to review the specific contents or supplementary materials provided to ascertain if additional resources or data are available.
14. How can I stay updated on further developments or reports in the Internet of Nano Things Industry?
To stay informed about further developments, trends, and reports in the Internet of Nano Things Industry, consider subscribing to industry newsletters, following relevant companies and organizations, or regularly checking reputable industry news sources and publications.
Methodology
Step 1 - Identification of Relevant Samples Size from Population Database


Step 2 - Approaches for Defining Global Market Size (Value, Volume* & Price*)

Note*: In applicable scenarios
Step 3 - Data Sources
Primary Research
- Web Analytics
- Survey Reports
- Research Institute
- Latest Research Reports
- Opinion Leaders
Secondary Research
- Annual Reports
- White Paper
- Latest Press Release
- Industry Association
- Paid Database
- Investor Presentations

Step 4 - Data Triangulation
Involves using different sources of information in order to increase the validity of a study
These sources are likely to be stakeholders in a program - participants, other researchers, program staff, other community members, and so on.
Then we put all data in single framework & apply various statistical tools to find out the dynamic on the market.
During the analysis stage, feedback from the stakeholder groups would be compared to determine areas of agreement as well as areas of divergence
