

Key Insights
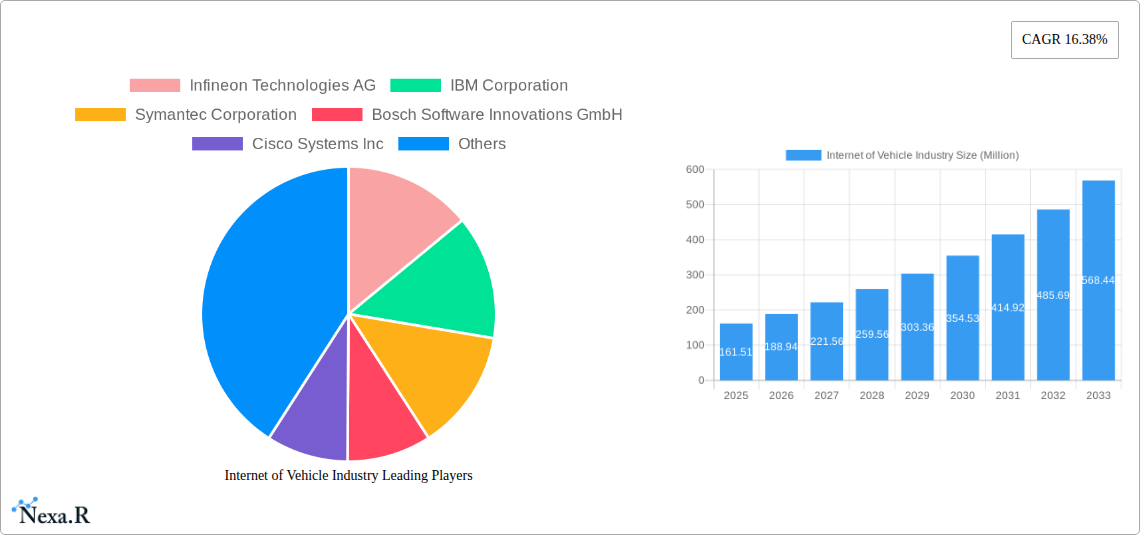
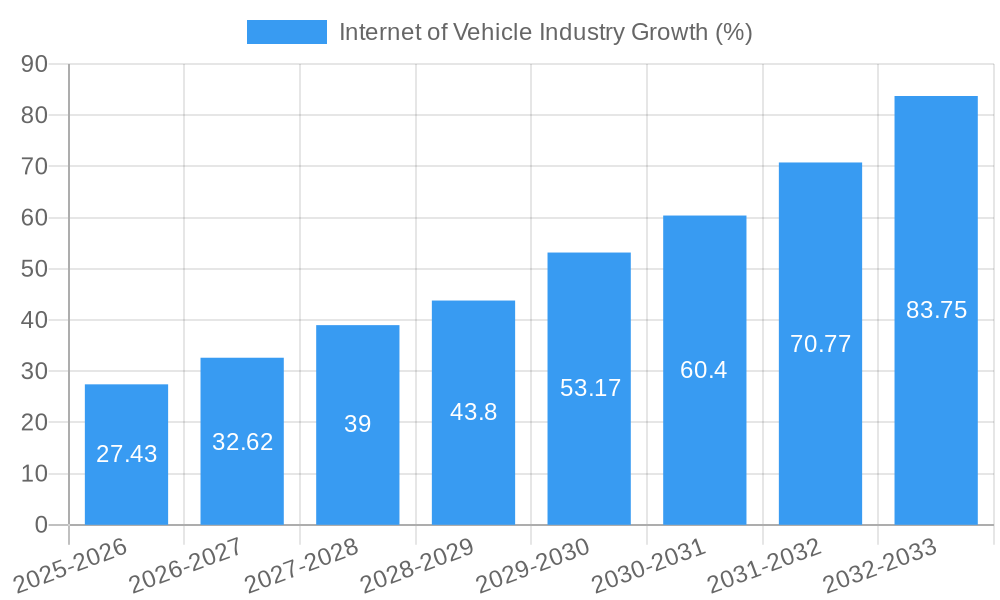
The Internet of Vehicles (IoV) market is experiencing robust growth, projected to reach a substantial size driven by increasing vehicle connectivity, advanced driver-assistance systems (ADAS), and the burgeoning demand for enhanced safety and efficiency in transportation and logistics. The 16.38% CAGR from 2019-2033, with a 2025 market value of $161.51 million, indicates a significant upward trajectory. Key drivers include the rising adoption of connected car technologies, the integration of telematics for fleet management, and the increasing focus on improving fuel efficiency and reducing emissions. Furthermore, the development of sophisticated software solutions like real-time transit management systems, security solutions, and remote monitoring systems are contributing to market expansion. The automotive and transportation & logistics sectors are the primary end-user industries fueling this growth, with increasing investments in infrastructure and technological advancements further bolstering the market's potential. Growth is geographically diverse, with North America and Asia Pacific anticipated to remain key regional markets due to strong technological innovation and early adoption of connected vehicle technologies.
The market segmentation highlights opportunities across various software solutions and applications. Real-time transit management, security solutions, and fleet management are leading software segments, improving operational efficiency and safety. Applications like mobility management and integrated entertainment are enhancing the user experience. This diversification creates a robust landscape for technological advancement and innovation. While challenges remain, such as data security concerns and the need for robust infrastructure, the overall market outlook remains positive, with continuous technological advancements and increasing government regulations supporting the ongoing adoption of IoV technologies across different geographical regions and sectors. The competitive landscape is characterized by the presence of both established technology companies and automotive manufacturers, indicating a collaborative ecosystem driving innovation and market expansion.
Internet of Vehicle Industry Market Report: 2019-2033
This comprehensive report provides a detailed analysis of the Internet of Vehicle (IoV) industry, encompassing market dynamics, growth trends, regional dominance, product landscapes, key players, and future outlooks. With a focus on parent markets (Automotive, Transportation & Logistics) and child markets (Software Solutions, Applications, End-user Industries), this report is an indispensable resource for industry professionals, investors, and strategists seeking to navigate this rapidly evolving sector. The study period covers 2019-2033, with a base year of 2025 and a forecast period of 2025-2033.
Internet of Vehicle Industry Market Dynamics & Structure
The IoV market is characterized by increasing market concentration amongst leading technology providers and automotive manufacturers, driven by significant technological innovations, particularly in areas like Artificial Intelligence (AI) and 5G connectivity. Stringent regulatory frameworks governing data privacy and vehicle safety are shaping market dynamics, alongside the emergence of competitive product substitutes like advanced driver-assistance systems (ADAS). The end-user demographic is expanding, encompassing individual consumers, fleet operators, and logistics providers. Mergers and acquisitions (M&A) are prevalent, with major players seeking to consolidate market share and expand their technological capabilities. The global IoV market size in 2024 was estimated at xx million units.
- Market Concentration: Top 5 players hold approximately xx% market share in 2024.
- Technological Innovation: Focus on AI, 5G, and edge computing fuels market growth.
- Regulatory Landscape: Data privacy regulations (GDPR, CCPA) and cybersecurity standards influence product development.
- M&A Activity: xx major M&A deals were recorded between 2019 and 2024.
- Innovation Barriers: High development costs and integration complexities hinder wider adoption.
Internet of Vehicle Industry Growth Trends & Insights
The IoV market exhibits robust growth, driven by increasing vehicle connectivity, the proliferation of smartphones, and the expanding adoption of cloud-based services. The market size is projected to reach xx million units by 2033, registering a CAGR of xx% during the forecast period. Technological disruptions, such as the development of autonomous vehicles and advanced driver-assistance systems (ADAS), are accelerating market expansion. Consumer behavior shifts towards increased demand for in-car connectivity and infotainment features further fuel this growth. Market penetration is expected to increase from xx% in 2024 to xx% by 2033.
Dominant Regions, Countries, or Segments in Internet of Vehicle Industry
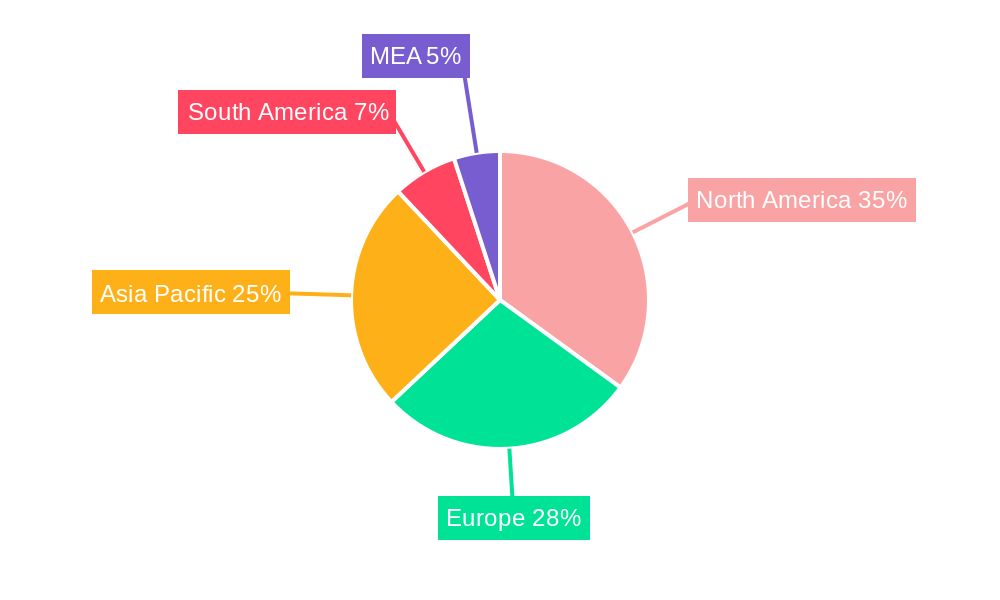
North America and Europe currently dominate the IoV market due to robust technological infrastructure, early adoption rates, and supportive government policies. Within the software solutions segment, real-time transit management systems and security solutions are experiencing the highest growth, driven by the need for efficient transportation and enhanced vehicle safety. In terms of applications, mobility management and vehicle management are major drivers, while the automotive end-user industry currently accounts for the largest market share.
- Key Drivers (North America & Europe): Advanced technological infrastructure, strong consumer demand, and favorable regulatory environments.
- Dominant Segments: Real-time transit management systems and security solutions (Software); Mobility and Vehicle Management (Applications); Automotive (End-user industry).
- Growth Potential: Asia-Pacific holds substantial untapped potential due to increasing vehicle ownership and infrastructure development.
Internet of Vehicle Industry Product Landscape
The IoV product landscape comprises a diverse range of hardware and software solutions, including telematics devices, embedded systems, cloud platforms, and mobile applications. Recent innovations center around enhanced security features, AI-powered analytics, and seamless integration with other smart devices. These products offer unique selling propositions like improved fuel efficiency, enhanced safety features, and personalized driver experiences. Technological advancements are focused on developing more robust and secure communication protocols, as well as advanced data analytics capabilities.
Key Drivers, Barriers & Challenges in Internet of Vehicle Industry
Key Drivers:
- Technological advancements in AI, 5G, and cloud computing.
- Increasing demand for enhanced safety and security features in vehicles.
- Growing adoption of connected car services and applications.
Challenges & Restraints:
- High initial investment costs for implementing IoV infrastructure.
- Concerns over data security and privacy.
- Complex regulatory frameworks and standardization issues. These issues can significantly impact market growth, potentially slowing expansion by xx% in certain regions.
Emerging Opportunities in Internet of Vehicle Industry
Emerging opportunities include the integration of IoV with smart cities, the expansion of autonomous driving capabilities, and the development of personalized in-car experiences. Untapped markets in developing economies and the integration of IoV with other smart technologies present significant growth avenues. Evolving consumer preferences for eco-friendly and technologically advanced vehicles offer significant opportunities.
Growth Accelerators in the Internet of Vehicle Industry Industry
Technological breakthroughs in AI and 5G connectivity are driving long-term growth. Strategic partnerships between automotive manufacturers, technology providers, and telecommunication companies further accelerate market expansion. Government initiatives promoting smart city development and investments in smart transportation infrastructure create significant growth opportunities.
Key Players Shaping the Internet of Vehicle Industry Market
- Infineon Technologies AG
- IBM Corporation
- Symantec Corporation
- Bosch Software Innovations GmbH
- Cisco Systems Inc
- Microsoft Corporation
- Tesla Motors Inc
- Waymo LLC (Alphabet Inc)
- Oracle Corporation
- General Electric Company
- SAP SE
Notable Milestones in Internet of Vehicle Industry Sector
- September 2022: Bosch and Mercedes-Benz's driverless parking system approved for commercial use. This milestone signifies a significant advancement in autonomous driving technology.
- February 2023: Cisco Systems, Inc. partners with Mercedes-Benz to integrate Webex into the new E-Class vehicles. This collaboration showcases the growing integration of work and mobility.
In-Depth Internet of Vehicle Industry Market Outlook
The IoV market is poised for significant growth, driven by technological innovation, increasing connectivity, and evolving consumer preferences. Strategic partnerships, infrastructure development, and government support will continue to propel market expansion. The long-term potential is vast, encompassing opportunities in autonomous driving, connected mobility services, and integrated entertainment systems. Focus on enhanced security and data privacy will be crucial for sustained growth.
Internet of Vehicle Industry Segmentation
-
1. Software Solutions
- 1.1. Real time Transit Management System
- 1.2. Security Solution
- 1.3. Remote Monitoring System
- 1.4. Network Bandwidth Management
- 1.5. Fleet Management
-
2. Applications
- 2.1. Mobility Management
- 2.2. Vehicle Management
- 2.3. Integrated Entertainment
-
3. End-user Industry
- 3.1. Transportation and Logistics
- 3.2. Automotive
- 3.3. Others End User Industries
Internet of Vehicle Industry Segmentation By Geography
- 1. North America
- 2. Europe
- 3. Asia Pacific
- 4. Rest of the World
Internet of Vehicle Industry REPORT HIGHLIGHTS
| Aspects | Details |
|---|---|
| Study Period | 2019-2033 |
| Base Year | 2024 |
| Estimated Year | 2025 |
| Forecast Period | 2025-2033 |
| Historical Period | 2019-2024 |
| Growth Rate | CAGR of 16.38% from 2019-2033 |
| Segmentation |
|
Table of Contents
- 1. Introduction
- 1.1. Research Scope
- 1.2. Market Segmentation
- 1.3. Research Methodology
- 1.4. Definitions and Assumptions
- 2. Executive Summary
- 2.1. Introduction
- 3. Market Dynamics
- 3.1. Introduction
- 3.2. Market Drivers
- 3.2.1. Increased Government Funding and Investments in Connected Transport System; Growing Demand for Smart Applications in Cars
- 3.3. Market Restrains
- 3.3.1. Slower Rate of Penetration of Connected Systems across the Developing Economies; High Initial Cost of Smart Transportation System
- 3.4. Market Trends
- 3.4.1. Automotive Sector to Witness the Growth
- 4. Market Factor Analysis
- 4.1. Porters Five Forces
- 4.2. Supply/Value Chain
- 4.3. PESTEL analysis
- 4.4. Market Entropy
- 4.5. Patent/Trademark Analysis
- 5. Global Internet of Vehicle Industry Analysis, Insights and Forecast, 2019-2031
- 5.1. Market Analysis, Insights and Forecast - by Software Solutions
- 5.1.1. Real time Transit Management System
- 5.1.2. Security Solution
- 5.1.3. Remote Monitoring System
- 5.1.4. Network Bandwidth Management
- 5.1.5. Fleet Management
- 5.2. Market Analysis, Insights and Forecast - by Applications
- 5.2.1. Mobility Management
- 5.2.2. Vehicle Management
- 5.2.3. Integrated Entertainment
- 5.3. Market Analysis, Insights and Forecast - by End-user Industry
- 5.3.1. Transportation and Logistics
- 5.3.2. Automotive
- 5.3.3. Others End User Industries
- 5.4. Market Analysis, Insights and Forecast - by Region
- 5.4.1. North America
- 5.4.2. Europe
- 5.4.3. Asia Pacific
- 5.4.4. Rest of the World
- 5.1. Market Analysis, Insights and Forecast - by Software Solutions
- 6. North America Internet of Vehicle Industry Analysis, Insights and Forecast, 2019-2031
- 6.1. Market Analysis, Insights and Forecast - by Software Solutions
- 6.1.1. Real time Transit Management System
- 6.1.2. Security Solution
- 6.1.3. Remote Monitoring System
- 6.1.4. Network Bandwidth Management
- 6.1.5. Fleet Management
- 6.2. Market Analysis, Insights and Forecast - by Applications
- 6.2.1. Mobility Management
- 6.2.2. Vehicle Management
- 6.2.3. Integrated Entertainment
- 6.3. Market Analysis, Insights and Forecast - by End-user Industry
- 6.3.1. Transportation and Logistics
- 6.3.2. Automotive
- 6.3.3. Others End User Industries
- 6.1. Market Analysis, Insights and Forecast - by Software Solutions
- 7. Europe Internet of Vehicle Industry Analysis, Insights and Forecast, 2019-2031
- 7.1. Market Analysis, Insights and Forecast - by Software Solutions
- 7.1.1. Real time Transit Management System
- 7.1.2. Security Solution
- 7.1.3. Remote Monitoring System
- 7.1.4. Network Bandwidth Management
- 7.1.5. Fleet Management
- 7.2. Market Analysis, Insights and Forecast - by Applications
- 7.2.1. Mobility Management
- 7.2.2. Vehicle Management
- 7.2.3. Integrated Entertainment
- 7.3. Market Analysis, Insights and Forecast - by End-user Industry
- 7.3.1. Transportation and Logistics
- 7.3.2. Automotive
- 7.3.3. Others End User Industries
- 7.1. Market Analysis, Insights and Forecast - by Software Solutions
- 8. Asia Pacific Internet of Vehicle Industry Analysis, Insights and Forecast, 2019-2031
- 8.1. Market Analysis, Insights and Forecast - by Software Solutions
- 8.1.1. Real time Transit Management System
- 8.1.2. Security Solution
- 8.1.3. Remote Monitoring System
- 8.1.4. Network Bandwidth Management
- 8.1.5. Fleet Management
- 8.2. Market Analysis, Insights and Forecast - by Applications
- 8.2.1. Mobility Management
- 8.2.2. Vehicle Management
- 8.2.3. Integrated Entertainment
- 8.3. Market Analysis, Insights and Forecast - by End-user Industry
- 8.3.1. Transportation and Logistics
- 8.3.2. Automotive
- 8.3.3. Others End User Industries
- 8.1. Market Analysis, Insights and Forecast - by Software Solutions
- 9. Rest of the World Internet of Vehicle Industry Analysis, Insights and Forecast, 2019-2031
- 9.1. Market Analysis, Insights and Forecast - by Software Solutions
- 9.1.1. Real time Transit Management System
- 9.1.2. Security Solution
- 9.1.3. Remote Monitoring System
- 9.1.4. Network Bandwidth Management
- 9.1.5. Fleet Management
- 9.2. Market Analysis, Insights and Forecast - by Applications
- 9.2.1. Mobility Management
- 9.2.2. Vehicle Management
- 9.2.3. Integrated Entertainment
- 9.3. Market Analysis, Insights and Forecast - by End-user Industry
- 9.3.1. Transportation and Logistics
- 9.3.2. Automotive
- 9.3.3. Others End User Industries
- 9.1. Market Analysis, Insights and Forecast - by Software Solutions
- 10. North America Internet of Vehicle Industry Analysis, Insights and Forecast, 2019-2031
- 10.1. Market Analysis, Insights and Forecast - By Country/Sub-region
- 10.1.1 United States
- 10.1.2 Canada
- 10.1.3 Mexico
- 11. Europe Internet of Vehicle Industry Analysis, Insights and Forecast, 2019-2031
- 11.1. Market Analysis, Insights and Forecast - By Country/Sub-region
- 11.1.1 Germany
- 11.1.2 United Kingdom
- 11.1.3 France
- 11.1.4 Spain
- 11.1.5 Italy
- 11.1.6 Spain
- 11.1.7 Belgium
- 11.1.8 Netherland
- 11.1.9 Nordics
- 11.1.10 Rest of Europe
- 12. Asia Pacific Internet of Vehicle Industry Analysis, Insights and Forecast, 2019-2031
- 12.1. Market Analysis, Insights and Forecast - By Country/Sub-region
- 12.1.1 China
- 12.1.2 Japan
- 12.1.3 India
- 12.1.4 South Korea
- 12.1.5 Southeast Asia
- 12.1.6 Australia
- 12.1.7 Indonesia
- 12.1.8 Phillipes
- 12.1.9 Singapore
- 12.1.10 Thailandc
- 12.1.11 Rest of Asia Pacific
- 13. South America Internet of Vehicle Industry Analysis, Insights and Forecast, 2019-2031
- 13.1. Market Analysis, Insights and Forecast - By Country/Sub-region
- 13.1.1 Brazil
- 13.1.2 Argentina
- 13.1.3 Peru
- 13.1.4 Chile
- 13.1.5 Colombia
- 13.1.6 Ecuador
- 13.1.7 Venezuela
- 13.1.8 Rest of South America
- 14. North America Internet of Vehicle Industry Analysis, Insights and Forecast, 2019-2031
- 14.1. Market Analysis, Insights and Forecast - By Country/Sub-region
- 14.1.1 United States
- 14.1.2 Canada
- 14.1.3 Mexico
- 15. MEA Internet of Vehicle Industry Analysis, Insights and Forecast, 2019-2031
- 15.1. Market Analysis, Insights and Forecast - By Country/Sub-region
- 15.1.1 United Arab Emirates
- 15.1.2 Saudi Arabia
- 15.1.3 South Africa
- 15.1.4 Rest of Middle East and Africa
- 16. Competitive Analysis
- 16.1. Global Market Share Analysis 2024
- 16.2. Company Profiles
- 16.2.1 Infineon Technologies AG
- 16.2.1.1. Overview
- 16.2.1.2. Products
- 16.2.1.3. SWOT Analysis
- 16.2.1.4. Recent Developments
- 16.2.1.5. Financials (Based on Availability)
- 16.2.2 IBM Corporation
- 16.2.2.1. Overview
- 16.2.2.2. Products
- 16.2.2.3. SWOT Analysis
- 16.2.2.4. Recent Developments
- 16.2.2.5. Financials (Based on Availability)
- 16.2.3 Symantec Corporation
- 16.2.3.1. Overview
- 16.2.3.2. Products
- 16.2.3.3. SWOT Analysis
- 16.2.3.4. Recent Developments
- 16.2.3.5. Financials (Based on Availability)
- 16.2.4 Bosch Software Innovations GmbH
- 16.2.4.1. Overview
- 16.2.4.2. Products
- 16.2.4.3. SWOT Analysis
- 16.2.4.4. Recent Developments
- 16.2.4.5. Financials (Based on Availability)
- 16.2.5 Cisco Systems Inc
- 16.2.5.1. Overview
- 16.2.5.2. Products
- 16.2.5.3. SWOT Analysis
- 16.2.5.4. Recent Developments
- 16.2.5.5. Financials (Based on Availability)
- 16.2.6 Microsoft Corporation
- 16.2.6.1. Overview
- 16.2.6.2. Products
- 16.2.6.3. SWOT Analysis
- 16.2.6.4. Recent Developments
- 16.2.6.5. Financials (Based on Availability)
- 16.2.7 Tesla Motors Inc
- 16.2.7.1. Overview
- 16.2.7.2. Products
- 16.2.7.3. SWOT Analysis
- 16.2.7.4. Recent Developments
- 16.2.7.5. Financials (Based on Availability)
- 16.2.8 Waymo LLC (Alphabet Inc )
- 16.2.8.1. Overview
- 16.2.8.2. Products
- 16.2.8.3. SWOT Analysis
- 16.2.8.4. Recent Developments
- 16.2.8.5. Financials (Based on Availability)
- 16.2.9 Oracle Corporation
- 16.2.9.1. Overview
- 16.2.9.2. Products
- 16.2.9.3. SWOT Analysis
- 16.2.9.4. Recent Developments
- 16.2.9.5. Financials (Based on Availability)
- 16.2.10 General Electric Company
- 16.2.10.1. Overview
- 16.2.10.2. Products
- 16.2.10.3. SWOT Analysis
- 16.2.10.4. Recent Developments
- 16.2.10.5. Financials (Based on Availability)
- 16.2.11 SAP SE
- 16.2.11.1. Overview
- 16.2.11.2. Products
- 16.2.11.3. SWOT Analysis
- 16.2.11.4. Recent Developments
- 16.2.11.5. Financials (Based on Availability)
- 16.2.1 Infineon Technologies AG
List of Figures
- Figure 1: Global Internet of Vehicle Industry Revenue Breakdown (Million, %) by Region 2024 & 2032
- Figure 2: North America Internet of Vehicle Industry Revenue (Million), by Country 2024 & 2032
- Figure 3: North America Internet of Vehicle Industry Revenue Share (%), by Country 2024 & 2032
- Figure 4: Europe Internet of Vehicle Industry Revenue (Million), by Country 2024 & 2032
- Figure 5: Europe Internet of Vehicle Industry Revenue Share (%), by Country 2024 & 2032
- Figure 6: Asia Pacific Internet of Vehicle Industry Revenue (Million), by Country 2024 & 2032
- Figure 7: Asia Pacific Internet of Vehicle Industry Revenue Share (%), by Country 2024 & 2032
- Figure 8: South America Internet of Vehicle Industry Revenue (Million), by Country 2024 & 2032
- Figure 9: South America Internet of Vehicle Industry Revenue Share (%), by Country 2024 & 2032
- Figure 10: North America Internet of Vehicle Industry Revenue (Million), by Country 2024 & 2032
- Figure 11: North America Internet of Vehicle Industry Revenue Share (%), by Country 2024 & 2032
- Figure 12: MEA Internet of Vehicle Industry Revenue (Million), by Country 2024 & 2032
- Figure 13: MEA Internet of Vehicle Industry Revenue Share (%), by Country 2024 & 2032
- Figure 14: North America Internet of Vehicle Industry Revenue (Million), by Software Solutions 2024 & 2032
- Figure 15: North America Internet of Vehicle Industry Revenue Share (%), by Software Solutions 2024 & 2032
- Figure 16: North America Internet of Vehicle Industry Revenue (Million), by Applications 2024 & 2032
- Figure 17: North America Internet of Vehicle Industry Revenue Share (%), by Applications 2024 & 2032
- Figure 18: North America Internet of Vehicle Industry Revenue (Million), by End-user Industry 2024 & 2032
- Figure 19: North America Internet of Vehicle Industry Revenue Share (%), by End-user Industry 2024 & 2032
- Figure 20: North America Internet of Vehicle Industry Revenue (Million), by Country 2024 & 2032
- Figure 21: North America Internet of Vehicle Industry Revenue Share (%), by Country 2024 & 2032
- Figure 22: Europe Internet of Vehicle Industry Revenue (Million), by Software Solutions 2024 & 2032
- Figure 23: Europe Internet of Vehicle Industry Revenue Share (%), by Software Solutions 2024 & 2032
- Figure 24: Europe Internet of Vehicle Industry Revenue (Million), by Applications 2024 & 2032
- Figure 25: Europe Internet of Vehicle Industry Revenue Share (%), by Applications 2024 & 2032
- Figure 26: Europe Internet of Vehicle Industry Revenue (Million), by End-user Industry 2024 & 2032
- Figure 27: Europe Internet of Vehicle Industry Revenue Share (%), by End-user Industry 2024 & 2032
- Figure 28: Europe Internet of Vehicle Industry Revenue (Million), by Country 2024 & 2032
- Figure 29: Europe Internet of Vehicle Industry Revenue Share (%), by Country 2024 & 2032
- Figure 30: Asia Pacific Internet of Vehicle Industry Revenue (Million), by Software Solutions 2024 & 2032
- Figure 31: Asia Pacific Internet of Vehicle Industry Revenue Share (%), by Software Solutions 2024 & 2032
- Figure 32: Asia Pacific Internet of Vehicle Industry Revenue (Million), by Applications 2024 & 2032
- Figure 33: Asia Pacific Internet of Vehicle Industry Revenue Share (%), by Applications 2024 & 2032
- Figure 34: Asia Pacific Internet of Vehicle Industry Revenue (Million), by End-user Industry 2024 & 2032
- Figure 35: Asia Pacific Internet of Vehicle Industry Revenue Share (%), by End-user Industry 2024 & 2032
- Figure 36: Asia Pacific Internet of Vehicle Industry Revenue (Million), by Country 2024 & 2032
- Figure 37: Asia Pacific Internet of Vehicle Industry Revenue Share (%), by Country 2024 & 2032
- Figure 38: Rest of the World Internet of Vehicle Industry Revenue (Million), by Software Solutions 2024 & 2032
- Figure 39: Rest of the World Internet of Vehicle Industry Revenue Share (%), by Software Solutions 2024 & 2032
- Figure 40: Rest of the World Internet of Vehicle Industry Revenue (Million), by Applications 2024 & 2032
- Figure 41: Rest of the World Internet of Vehicle Industry Revenue Share (%), by Applications 2024 & 2032
- Figure 42: Rest of the World Internet of Vehicle Industry Revenue (Million), by End-user Industry 2024 & 2032
- Figure 43: Rest of the World Internet of Vehicle Industry Revenue Share (%), by End-user Industry 2024 & 2032
- Figure 44: Rest of the World Internet of Vehicle Industry Revenue (Million), by Country 2024 & 2032
- Figure 45: Rest of the World Internet of Vehicle Industry Revenue Share (%), by Country 2024 & 2032
List of Tables
- Table 1: Global Internet of Vehicle Industry Revenue Million Forecast, by Region 2019 & 2032
- Table 2: Global Internet of Vehicle Industry Revenue Million Forecast, by Software Solutions 2019 & 2032
- Table 3: Global Internet of Vehicle Industry Revenue Million Forecast, by Applications 2019 & 2032
- Table 4: Global Internet of Vehicle Industry Revenue Million Forecast, by End-user Industry 2019 & 2032
- Table 5: Global Internet of Vehicle Industry Revenue Million Forecast, by Region 2019 & 2032
- Table 6: Global Internet of Vehicle Industry Revenue Million Forecast, by Country 2019 & 2032
- Table 7: United States Internet of Vehicle Industry Revenue (Million) Forecast, by Application 2019 & 2032
- Table 8: Canada Internet of Vehicle Industry Revenue (Million) Forecast, by Application 2019 & 2032
- Table 9: Mexico Internet of Vehicle Industry Revenue (Million) Forecast, by Application 2019 & 2032
- Table 10: Global Internet of Vehicle Industry Revenue Million Forecast, by Country 2019 & 2032
- Table 11: Germany Internet of Vehicle Industry Revenue (Million) Forecast, by Application 2019 & 2032
- Table 12: United Kingdom Internet of Vehicle Industry Revenue (Million) Forecast, by Application 2019 & 2032
- Table 13: France Internet of Vehicle Industry Revenue (Million) Forecast, by Application 2019 & 2032
- Table 14: Spain Internet of Vehicle Industry Revenue (Million) Forecast, by Application 2019 & 2032
- Table 15: Italy Internet of Vehicle Industry Revenue (Million) Forecast, by Application 2019 & 2032
- Table 16: Spain Internet of Vehicle Industry Revenue (Million) Forecast, by Application 2019 & 2032
- Table 17: Belgium Internet of Vehicle Industry Revenue (Million) Forecast, by Application 2019 & 2032
- Table 18: Netherland Internet of Vehicle Industry Revenue (Million) Forecast, by Application 2019 & 2032
- Table 19: Nordics Internet of Vehicle Industry Revenue (Million) Forecast, by Application 2019 & 2032
- Table 20: Rest of Europe Internet of Vehicle Industry Revenue (Million) Forecast, by Application 2019 & 2032
- Table 21: Global Internet of Vehicle Industry Revenue Million Forecast, by Country 2019 & 2032
- Table 22: China Internet of Vehicle Industry Revenue (Million) Forecast, by Application 2019 & 2032
- Table 23: Japan Internet of Vehicle Industry Revenue (Million) Forecast, by Application 2019 & 2032
- Table 24: India Internet of Vehicle Industry Revenue (Million) Forecast, by Application 2019 & 2032
- Table 25: South Korea Internet of Vehicle Industry Revenue (Million) Forecast, by Application 2019 & 2032
- Table 26: Southeast Asia Internet of Vehicle Industry Revenue (Million) Forecast, by Application 2019 & 2032
- Table 27: Australia Internet of Vehicle Industry Revenue (Million) Forecast, by Application 2019 & 2032
- Table 28: Indonesia Internet of Vehicle Industry Revenue (Million) Forecast, by Application 2019 & 2032
- Table 29: Phillipes Internet of Vehicle Industry Revenue (Million) Forecast, by Application 2019 & 2032
- Table 30: Singapore Internet of Vehicle Industry Revenue (Million) Forecast, by Application 2019 & 2032
- Table 31: Thailandc Internet of Vehicle Industry Revenue (Million) Forecast, by Application 2019 & 2032
- Table 32: Rest of Asia Pacific Internet of Vehicle Industry Revenue (Million) Forecast, by Application 2019 & 2032
- Table 33: Global Internet of Vehicle Industry Revenue Million Forecast, by Country 2019 & 2032
- Table 34: Brazil Internet of Vehicle Industry Revenue (Million) Forecast, by Application 2019 & 2032
- Table 35: Argentina Internet of Vehicle Industry Revenue (Million) Forecast, by Application 2019 & 2032
- Table 36: Peru Internet of Vehicle Industry Revenue (Million) Forecast, by Application 2019 & 2032
- Table 37: Chile Internet of Vehicle Industry Revenue (Million) Forecast, by Application 2019 & 2032
- Table 38: Colombia Internet of Vehicle Industry Revenue (Million) Forecast, by Application 2019 & 2032
- Table 39: Ecuador Internet of Vehicle Industry Revenue (Million) Forecast, by Application 2019 & 2032
- Table 40: Venezuela Internet of Vehicle Industry Revenue (Million) Forecast, by Application 2019 & 2032
- Table 41: Rest of South America Internet of Vehicle Industry Revenue (Million) Forecast, by Application 2019 & 2032
- Table 42: Global Internet of Vehicle Industry Revenue Million Forecast, by Country 2019 & 2032
- Table 43: United States Internet of Vehicle Industry Revenue (Million) Forecast, by Application 2019 & 2032
- Table 44: Canada Internet of Vehicle Industry Revenue (Million) Forecast, by Application 2019 & 2032
- Table 45: Mexico Internet of Vehicle Industry Revenue (Million) Forecast, by Application 2019 & 2032
- Table 46: Global Internet of Vehicle Industry Revenue Million Forecast, by Country 2019 & 2032
- Table 47: United Arab Emirates Internet of Vehicle Industry Revenue (Million) Forecast, by Application 2019 & 2032
- Table 48: Saudi Arabia Internet of Vehicle Industry Revenue (Million) Forecast, by Application 2019 & 2032
- Table 49: South Africa Internet of Vehicle Industry Revenue (Million) Forecast, by Application 2019 & 2032
- Table 50: Rest of Middle East and Africa Internet of Vehicle Industry Revenue (Million) Forecast, by Application 2019 & 2032
- Table 51: Global Internet of Vehicle Industry Revenue Million Forecast, by Software Solutions 2019 & 2032
- Table 52: Global Internet of Vehicle Industry Revenue Million Forecast, by Applications 2019 & 2032
- Table 53: Global Internet of Vehicle Industry Revenue Million Forecast, by End-user Industry 2019 & 2032
- Table 54: Global Internet of Vehicle Industry Revenue Million Forecast, by Country 2019 & 2032
- Table 55: Global Internet of Vehicle Industry Revenue Million Forecast, by Software Solutions 2019 & 2032
- Table 56: Global Internet of Vehicle Industry Revenue Million Forecast, by Applications 2019 & 2032
- Table 57: Global Internet of Vehicle Industry Revenue Million Forecast, by End-user Industry 2019 & 2032
- Table 58: Global Internet of Vehicle Industry Revenue Million Forecast, by Country 2019 & 2032
- Table 59: Global Internet of Vehicle Industry Revenue Million Forecast, by Software Solutions 2019 & 2032
- Table 60: Global Internet of Vehicle Industry Revenue Million Forecast, by Applications 2019 & 2032
- Table 61: Global Internet of Vehicle Industry Revenue Million Forecast, by End-user Industry 2019 & 2032
- Table 62: Global Internet of Vehicle Industry Revenue Million Forecast, by Country 2019 & 2032
- Table 63: Global Internet of Vehicle Industry Revenue Million Forecast, by Software Solutions 2019 & 2032
- Table 64: Global Internet of Vehicle Industry Revenue Million Forecast, by Applications 2019 & 2032
- Table 65: Global Internet of Vehicle Industry Revenue Million Forecast, by End-user Industry 2019 & 2032
- Table 66: Global Internet of Vehicle Industry Revenue Million Forecast, by Country 2019 & 2032
Frequently Asked Questions
1. What is the projected Compound Annual Growth Rate (CAGR) of the Internet of Vehicle Industry?
The projected CAGR is approximately 16.38%.
2. Which companies are prominent players in the Internet of Vehicle Industry?
Key companies in the market include Infineon Technologies AG, IBM Corporation, Symantec Corporation, Bosch Software Innovations GmbH, Cisco Systems Inc, Microsoft Corporation, Tesla Motors Inc, Waymo LLC (Alphabet Inc ), Oracle Corporation, General Electric Company, SAP SE.
3. What are the main segments of the Internet of Vehicle Industry?
The market segments include Software Solutions, Applications, End-user Industry.
4. Can you provide details about the market size?
The market size is estimated to be USD 161.51 Million as of 2022.
5. What are some drivers contributing to market growth?
Increased Government Funding and Investments in Connected Transport System; Growing Demand for Smart Applications in Cars.
6. What are the notable trends driving market growth?
Automotive Sector to Witness the Growth.
7. Are there any restraints impacting market growth?
Slower Rate of Penetration of Connected Systems across the Developing Economies; High Initial Cost of Smart Transportation System.
8. Can you provide examples of recent developments in the market?
February 2023 - Cisco Systems, Inc has announced it is working with Mercedes-Benz to provide an optimal mobile office experience in its new Mercedes-Benz E Class vehicles. Where the partnership will help people get work done safely, securely, and comfortably in their cars, with the modern luxury and intuitive features that Mercedes-Benz and Webex customers are accustomed to
9. What pricing options are available for accessing the report?
Pricing options include single-user, multi-user, and enterprise licenses priced at USD 4750, USD 5250, and USD 8750 respectively.
10. Is the market size provided in terms of value or volume?
The market size is provided in terms of value, measured in Million.
11. Are there any specific market keywords associated with the report?
Yes, the market keyword associated with the report is "Internet of Vehicle Industry," which aids in identifying and referencing the specific market segment covered.
12. How do I determine which pricing option suits my needs best?
The pricing options vary based on user requirements and access needs. Individual users may opt for single-user licenses, while businesses requiring broader access may choose multi-user or enterprise licenses for cost-effective access to the report.
13. Are there any additional resources or data provided in the Internet of Vehicle Industry report?
While the report offers comprehensive insights, it's advisable to review the specific contents or supplementary materials provided to ascertain if additional resources or data are available.
14. How can I stay updated on further developments or reports in the Internet of Vehicle Industry?
To stay informed about further developments, trends, and reports in the Internet of Vehicle Industry, consider subscribing to industry newsletters, following relevant companies and organizations, or regularly checking reputable industry news sources and publications.
Methodology
Step 1 - Identification of Relevant Samples Size from Population Database


Step 2 - Approaches for Defining Global Market Size (Value, Volume* & Price*)

Note*: In applicable scenarios
Step 3 - Data Sources
Primary Research
- Web Analytics
- Survey Reports
- Research Institute
- Latest Research Reports
- Opinion Leaders
Secondary Research
- Annual Reports
- White Paper
- Latest Press Release
- Industry Association
- Paid Database
- Investor Presentations

Step 4 - Data Triangulation
Involves using different sources of information in order to increase the validity of a study
These sources are likely to be stakeholders in a program - participants, other researchers, program staff, other community members, and so on.
Then we put all data in single framework & apply various statistical tools to find out the dynamic on the market.
During the analysis stage, feedback from the stakeholder groups would be compared to determine areas of agreement as well as areas of divergence
