

Key Insights
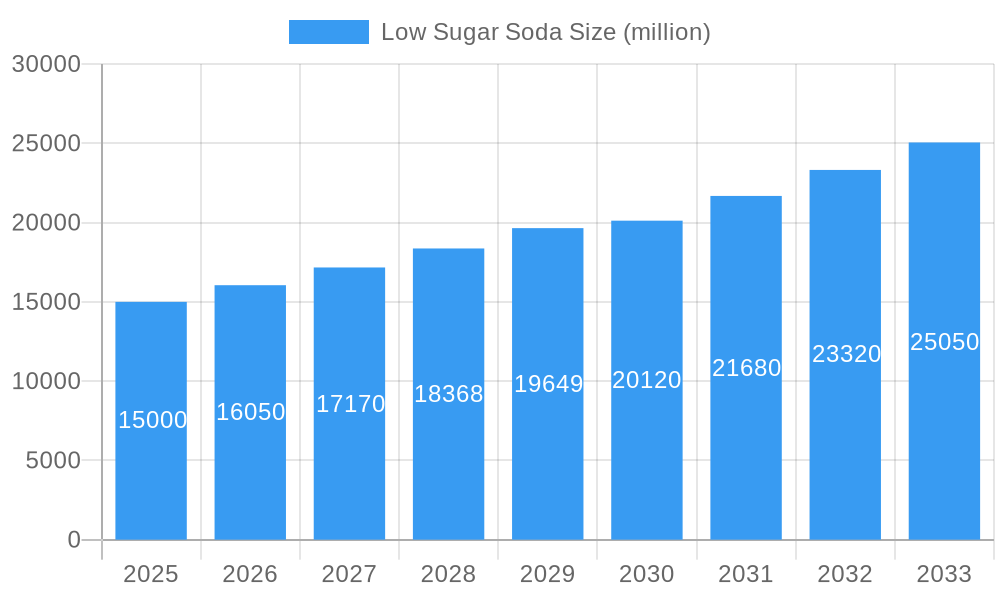
The low-sugar soda market is experiencing robust growth, driven by increasing health consciousness and a global shift towards reduced sugar consumption. The market, estimated at $15 billion in 2025, is projected to maintain a healthy Compound Annual Growth Rate (CAGR) of 7% from 2025 to 2033, reaching an estimated $28 billion by 2033. This expansion is fueled by several key factors. Consumers are actively seeking healthier alternatives to traditional sugary sodas, leading to increased demand for products with reduced or zero sugar content. This trend is particularly strong among younger demographics and health-conscious individuals. Furthermore, the innovation within the low-sugar soda industry is remarkable, with companies constantly developing new flavors, formulations, and packaging to appeal to evolving consumer preferences. The rise of natural sweeteners, such as stevia and monk fruit, has also significantly contributed to the market's growth, providing healthier and often more palatable options compared to artificial sweeteners used in earlier generations of diet sodas.
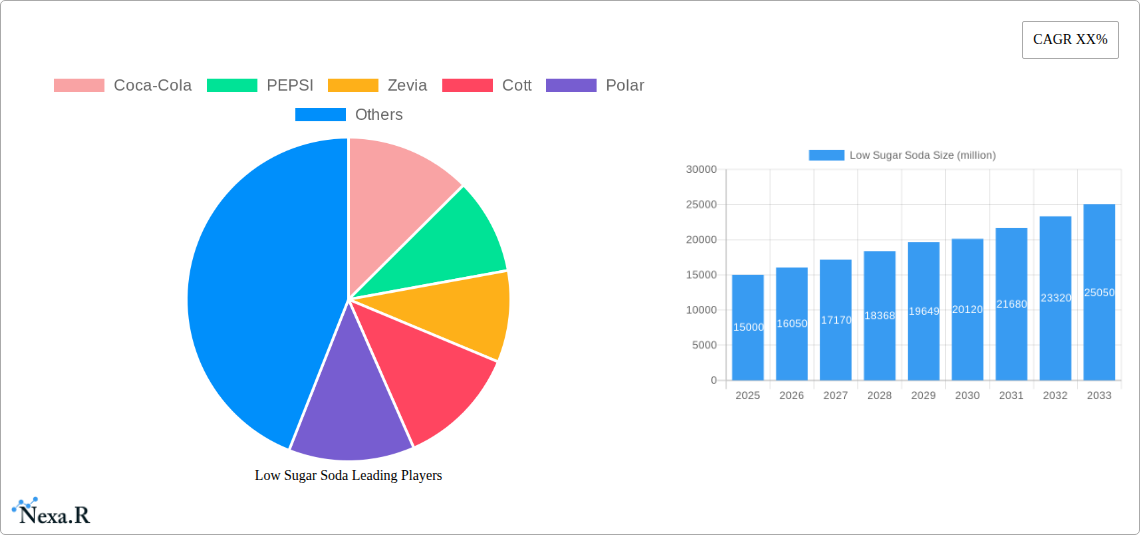
Low Sugar Soda Market Size (In Billion)
Major players like Coca-Cola, PepsiCo, and Dr Pepper Snapple Group are actively investing in research and development to enhance their low-sugar offerings, expanding their product portfolios, and leveraging their extensive distribution networks to capture market share. However, challenges remain. Some consumers perceive low-sugar sodas as having a less desirable taste than their sugary counterparts, presenting a hurdle to widespread adoption. Furthermore, the perception of artificial sweeteners remains a concern for a segment of the population. Competition within the market is intense, with smaller brands such as Zevia, Bai Brands, and Olipop offering unique selling propositions based on natural ingredients and distinctive flavor profiles. These companies are successfully carving out niches within the market, particularly attracting consumers seeking premium and more naturally sourced alternatives. The regional distribution of market share is expected to be influenced by health regulations, consumer preferences, and economic factors across different regions.
Low Sugar Soda Company Market Share
Low Sugar Soda Market Report: 2019-2033
This comprehensive report provides a detailed analysis of the low sugar soda market, encompassing market dynamics, growth trends, regional analysis, competitive landscape, and future outlook. The study period covers 2019-2033, with 2025 as the base and estimated year. The forecast period extends from 2025 to 2033, while the historical period analyzed is 2019-2024. This report is essential for industry professionals, investors, and anyone seeking in-depth insights into this rapidly evolving market segment.
Low Sugar Soda Market Dynamics & Structure
The low sugar soda market is characterized by increasing consumer health consciousness and a shift away from traditional sugary beverages. Market concentration is moderate, with key players like Coca-Cola, PepsiCo, and Zevia holding significant shares, but smaller players and emerging brands also contributing substantially. Technological innovation, particularly in natural sweeteners and flavor enhancements, is a key driver, while regulatory frameworks regarding sugar content and labeling influence product development. Competitive substitutes include sparkling water, flavored water, and other functional beverages. The end-user demographic is broad, encompassing health-conscious adults and younger generations. M&A activity in the sector has been moderate, with approximately xx million deals in the past five years, driven by the desire for portfolio diversification and expansion into healthier beverage segments.
- Market Concentration: Moderate, with top 5 players holding approximately xx% market share (2024).
- Technological Innovation: Focus on natural sweeteners (stevia, monk fruit), innovative flavor profiles, and functional ingredients.
- Regulatory Framework: Varying regulations on sugar content and labeling across different regions impact product formulation and marketing.
- Competitive Substitutes: Sparkling water, flavored water, functional beverages pose significant competition.
- End-User Demographics: Health-conscious adults, millennials, and Gen Z are primary consumers.
- M&A Activity: Approximately xx million deals (2019-2024), indicating consolidation and expansion efforts.
Low Sugar Soda Growth Trends & Insights
The low sugar soda market has experienced substantial growth in recent years, driven by increasing awareness of health risks associated with high sugar intake. Market size has expanded from xx million units in 2019 to xx million units in 2024, with a projected CAGR of xx% during the forecast period. This growth is fueled by rising adoption rates, particularly amongst health-conscious consumers, and technological disruptions that have enabled the creation of better-tasting, lower-sugar alternatives. Consumer behavior is shifting towards healthier beverage options, with low-sugar soda viewed as a more acceptable alternative to traditional sodas. This trend is expected to continue, leading to further market penetration in the coming years.
Dominant Regions, Countries, or Segments in Low Sugar Soda
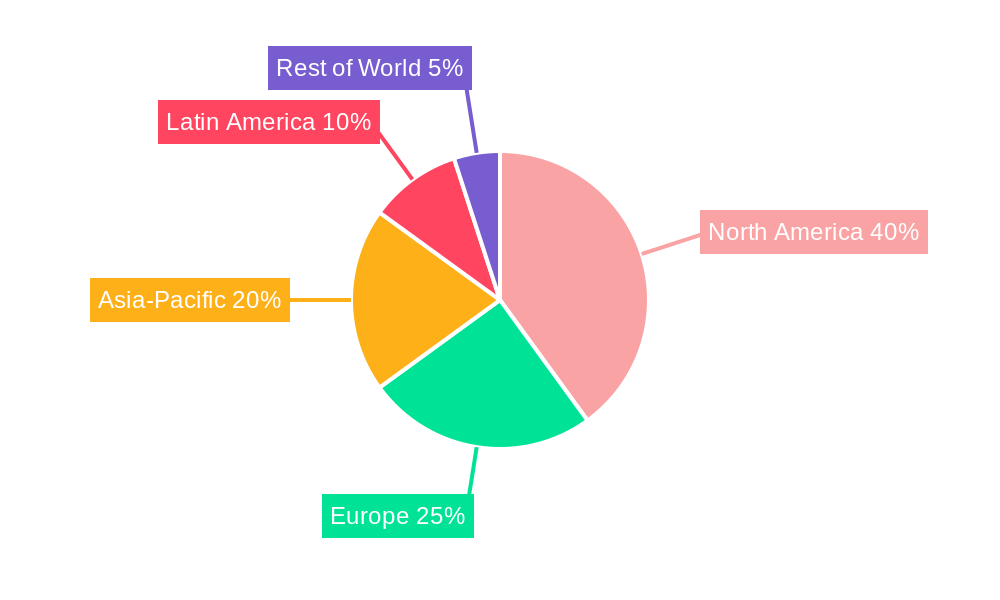
North America currently dominates the low-sugar soda market, holding the largest market share (approximately xx%) due to high consumer awareness of health and wellness and a strong presence of key players. Europe follows with a significant share of xx%, driven by increasing health consciousness and government initiatives to reduce sugar consumption. Asia-Pacific is a region with high growth potential, driven by a burgeoning middle class and increasing disposable incomes. However, cultural preferences and established beverage habits present challenges.
- North America: High consumer health consciousness, strong presence of key players, advanced distribution networks.
- Europe: Growing health awareness, government regulations supporting reduced sugar intake.
- Asia-Pacific: High growth potential, increasing middle class, but challenges posed by established beverage preferences.
Low Sugar Soda Product Landscape
The low sugar soda market offers a diverse range of products, employing various natural and artificial sweeteners, innovative flavor combinations, and functional ingredients. Companies are focusing on enhancing taste profiles to overcome the perceived taste compromises associated with reduced sugar content. Key innovations include the use of stevia, monk fruit, and other natural sweeteners, as well as the incorporation of functional ingredients like vitamins, antioxidants, and probiotics. Performance metrics focus on sugar reduction, calorie count, and consumer satisfaction, highlighting the unique selling propositions of these products.
Key Drivers, Barriers & Challenges in Low Sugar Soda
Key Drivers:
- Rising consumer health awareness.
- Growing demand for healthier beverage alternatives.
- Technological advancements in natural sweeteners and flavor technologies.
- Increased regulatory scrutiny of high-sugar beverages.
Key Challenges & Restraints:
- Maintaining the taste and carbonation comparable to traditional sodas.
- Competition from other healthier beverage options.
- Fluctuations in raw material prices (e.g., natural sweeteners).
- Stringent regulations and labeling requirements impacting cost and complexity. This can represent a significant challenge accounting for xx% of production costs in some regions.
Emerging Opportunities in Low Sugar Soda
- Expansion into untapped markets in developing countries.
- Development of functional low-sugar sodas with added health benefits (e.g., probiotics, vitamins).
- Customization and personalization of flavors to meet diverse consumer preferences.
- Utilizing sustainable packaging options to appeal to environmentally conscious consumers.
Growth Accelerators in the Low Sugar Soda Industry
Technological advancements in sweetener production and flavor enhancement will play a crucial role in driving future growth. Strategic partnerships between established beverage companies and smaller innovative players will accelerate product development and market reach. Market expansion into developing countries, driven by growing middle classes and health awareness, will also significantly contribute to market growth.
Notable Milestones in Low Sugar Soda Sector
- 2020: Zevia launches a new line of organic low-sugar sodas.
- 2021: Coca-Cola invests in a new stevia production facility.
- 2022: PepsiCo introduces a range of low-sugar sodas with added functional ingredients.
- 2023: A major merger occurs between two smaller low-sugar soda producers. (Specific details not available - xx)
In-Depth Low Sugar Soda Market Outlook
The low sugar soda market is poised for continued strong growth, driven by sustained consumer demand for healthier alternatives and ongoing innovation in product development. Strategic partnerships and expansion into new markets will create substantial opportunities for established and emerging players alike. The market's future potential is significant, with projected growth exceeding xx million units by 2033, representing a substantial increase in market value.
Low Sugar Soda Segmentation
-
1. Application
- 1.1. Supermarkets/Hypermarkets
- 1.2. Departmental Stores
- 1.3. Online Retail Stores
- 1.4. Others
-
2. Types
- 2.1. Artificial Sweetener
- 2.2. Natural Sweetener
Low Sugar Soda Segmentation By Geography
-
1. North America
- 1.1. United States
- 1.2. Canada
- 1.3. Mexico
-
2. South America
- 2.1. Brazil
- 2.2. Argentina
- 2.3. Rest of South America
-
3. Europe
- 3.1. United Kingdom
- 3.2. Germany
- 3.3. France
- 3.4. Italy
- 3.5. Spain
- 3.6. Russia
- 3.7. Benelux
- 3.8. Nordics
- 3.9. Rest of Europe
-
4. Middle East & Africa
- 4.1. Turkey
- 4.2. Israel
- 4.3. GCC
- 4.4. North Africa
- 4.5. South Africa
- 4.6. Rest of Middle East & Africa
-
5. Asia Pacific
- 5.1. China
- 5.2. India
- 5.3. Japan
- 5.4. South Korea
- 5.5. ASEAN
- 5.6. Oceania
- 5.7. Rest of Asia Pacific
Low Sugar Soda Regional Market Share
Geographic Coverage of Low Sugar Soda
Low Sugar Soda REPORT HIGHLIGHTS
| Aspects | Details |
|---|---|
| Study Period | 2020-2034 |
| Base Year | 2025 |
| Estimated Year | 2026 |
| Forecast Period | 2026-2034 |
| Historical Period | 2020-2025 |
| Growth Rate | CAGR of 6.7% from 2020-2034 |
| Segmentation |
|
Table of Contents
- 1. Introduction
- 1.1. Research Scope
- 1.2. Market Segmentation
- 1.3. Research Methodology
- 1.4. Definitions and Assumptions
- 2. Executive Summary
- 2.1. Introduction
- 3. Market Dynamics
- 3.1. Introduction
- 3.2. Market Drivers
- 3.3. Market Restrains
- 3.4. Market Trends
- 4. Market Factor Analysis
- 4.1. Porters Five Forces
- 4.2. Supply/Value Chain
- 4.3. PESTEL analysis
- 4.4. Market Entropy
- 4.5. Patent/Trademark Analysis
- 5. Global Low Sugar Soda Analysis, Insights and Forecast, 2020-2032
- 5.1. Market Analysis, Insights and Forecast - by Application
- 5.1.1. Supermarkets/Hypermarkets
- 5.1.2. Departmental Stores
- 5.1.3. Online Retail Stores
- 5.1.4. Others
- 5.2. Market Analysis, Insights and Forecast - by Types
- 5.2.1. Artificial Sweetener
- 5.2.2. Natural Sweetener
- 5.3. Market Analysis, Insights and Forecast - by Region
- 5.3.1. North America
- 5.3.2. South America
- 5.3.3. Europe
- 5.3.4. Middle East & Africa
- 5.3.5. Asia Pacific
- 5.1. Market Analysis, Insights and Forecast - by Application
- 6. North America Low Sugar Soda Analysis, Insights and Forecast, 2020-2032
- 6.1. Market Analysis, Insights and Forecast - by Application
- 6.1.1. Supermarkets/Hypermarkets
- 6.1.2. Departmental Stores
- 6.1.3. Online Retail Stores
- 6.1.4. Others
- 6.2. Market Analysis, Insights and Forecast - by Types
- 6.2.1. Artificial Sweetener
- 6.2.2. Natural Sweetener
- 6.1. Market Analysis, Insights and Forecast - by Application
- 7. South America Low Sugar Soda Analysis, Insights and Forecast, 2020-2032
- 7.1. Market Analysis, Insights and Forecast - by Application
- 7.1.1. Supermarkets/Hypermarkets
- 7.1.2. Departmental Stores
- 7.1.3. Online Retail Stores
- 7.1.4. Others
- 7.2. Market Analysis, Insights and Forecast - by Types
- 7.2.1. Artificial Sweetener
- 7.2.2. Natural Sweetener
- 7.1. Market Analysis, Insights and Forecast - by Application
- 8. Europe Low Sugar Soda Analysis, Insights and Forecast, 2020-2032
- 8.1. Market Analysis, Insights and Forecast - by Application
- 8.1.1. Supermarkets/Hypermarkets
- 8.1.2. Departmental Stores
- 8.1.3. Online Retail Stores
- 8.1.4. Others
- 8.2. Market Analysis, Insights and Forecast - by Types
- 8.2.1. Artificial Sweetener
- 8.2.2. Natural Sweetener
- 8.1. Market Analysis, Insights and Forecast - by Application
- 9. Middle East & Africa Low Sugar Soda Analysis, Insights and Forecast, 2020-2032
- 9.1. Market Analysis, Insights and Forecast - by Application
- 9.1.1. Supermarkets/Hypermarkets
- 9.1.2. Departmental Stores
- 9.1.3. Online Retail Stores
- 9.1.4. Others
- 9.2. Market Analysis, Insights and Forecast - by Types
- 9.2.1. Artificial Sweetener
- 9.2.2. Natural Sweetener
- 9.1. Market Analysis, Insights and Forecast - by Application
- 10. Asia Pacific Low Sugar Soda Analysis, Insights and Forecast, 2020-2032
- 10.1. Market Analysis, Insights and Forecast - by Application
- 10.1.1. Supermarkets/Hypermarkets
- 10.1.2. Departmental Stores
- 10.1.3. Online Retail Stores
- 10.1.4. Others
- 10.2. Market Analysis, Insights and Forecast - by Types
- 10.2.1. Artificial Sweetener
- 10.2.2. Natural Sweetener
- 10.1. Market Analysis, Insights and Forecast - by Application
- 11. Competitive Analysis
- 11.1. Global Market Share Analysis 2025
- 11.2. Company Profiles
- 11.2.1 Coca-Cola
- 11.2.1.1. Overview
- 11.2.1.2. Products
- 11.2.1.3. SWOT Analysis
- 11.2.1.4. Recent Developments
- 11.2.1.5. Financials (Based on Availability)
- 11.2.2 PEPSI
- 11.2.2.1. Overview
- 11.2.2.2. Products
- 11.2.2.3. SWOT Analysis
- 11.2.2.4. Recent Developments
- 11.2.2.5. Financials (Based on Availability)
- 11.2.3 Zevia
- 11.2.3.1. Overview
- 11.2.3.2. Products
- 11.2.3.3. SWOT Analysis
- 11.2.3.4. Recent Developments
- 11.2.3.5. Financials (Based on Availability)
- 11.2.4 Cott
- 11.2.4.1. Overview
- 11.2.4.2. Products
- 11.2.4.3. SWOT Analysis
- 11.2.4.4. Recent Developments
- 11.2.4.5. Financials (Based on Availability)
- 11.2.5 Polar
- 11.2.5.1. Overview
- 11.2.5.2. Products
- 11.2.5.3. SWOT Analysis
- 11.2.5.4. Recent Developments
- 11.2.5.5. Financials (Based on Availability)
- 11.2.6 A&W
- 11.2.6.1. Overview
- 11.2.6.2. Products
- 11.2.6.3. SWOT Analysis
- 11.2.6.4. Recent Developments
- 11.2.6.5. Financials (Based on Availability)
- 11.2.7 Mountain Dew
- 11.2.7.1. Overview
- 11.2.7.2. Products
- 11.2.7.3. SWOT Analysis
- 11.2.7.4. Recent Developments
- 11.2.7.5. Financials (Based on Availability)
- 11.2.8 Dr Pepper Snapple Group
- 11.2.8.1. Overview
- 11.2.8.2. Products
- 11.2.8.3. SWOT Analysis
- 11.2.8.4. Recent Developments
- 11.2.8.5. Financials (Based on Availability)
- 11.2.9 Nestle Water
- 11.2.9.1. Overview
- 11.2.9.2. Products
- 11.2.9.3. SWOT Analysis
- 11.2.9.4. Recent Developments
- 11.2.9.5. Financials (Based on Availability)
- 11.2.10 Talking Rain Beverage Company
- 11.2.10.1. Overview
- 11.2.10.2. Products
- 11.2.10.3. SWOT Analysis
- 11.2.10.4. Recent Developments
- 11.2.10.5. Financials (Based on Availability)
- 11.2.11 Bai Brands LLC
- 11.2.11.1. Overview
- 11.2.11.2. Products
- 11.2.11.3. SWOT Analysis
- 11.2.11.4. Recent Developments
- 11.2.11.5. Financials (Based on Availability)
- 11.2.12 Poppi
- 11.2.12.1. Overview
- 11.2.12.2. Products
- 11.2.12.3. SWOT Analysis
- 11.2.12.4. Recent Developments
- 11.2.12.5. Financials (Based on Availability)
- 11.2.13 Breezzo
- 11.2.13.1. Overview
- 11.2.13.2. Products
- 11.2.13.3. SWOT Analysis
- 11.2.13.4. Recent Developments
- 11.2.13.5. Financials (Based on Availability)
- 11.2.14 Spindrift
- 11.2.14.1. Overview
- 11.2.14.2. Products
- 11.2.14.3. SWOT Analysis
- 11.2.14.4. Recent Developments
- 11.2.14.5. Financials (Based on Availability)
- 11.2.15 Olipop
- 11.2.15.1. Overview
- 11.2.15.2. Products
- 11.2.15.3. SWOT Analysis
- 11.2.15.4. Recent Developments
- 11.2.15.5. Financials (Based on Availability)
- 11.2.1 Coca-Cola
List of Figures
- Figure 1: Global Low Sugar Soda Revenue Breakdown (undefined, %) by Region 2025 & 2033
- Figure 2: Global Low Sugar Soda Volume Breakdown (K, %) by Region 2025 & 2033
- Figure 3: North America Low Sugar Soda Revenue (undefined), by Application 2025 & 2033
- Figure 4: North America Low Sugar Soda Volume (K), by Application 2025 & 2033
- Figure 5: North America Low Sugar Soda Revenue Share (%), by Application 2025 & 2033
- Figure 6: North America Low Sugar Soda Volume Share (%), by Application 2025 & 2033
- Figure 7: North America Low Sugar Soda Revenue (undefined), by Types 2025 & 2033
- Figure 8: North America Low Sugar Soda Volume (K), by Types 2025 & 2033
- Figure 9: North America Low Sugar Soda Revenue Share (%), by Types 2025 & 2033
- Figure 10: North America Low Sugar Soda Volume Share (%), by Types 2025 & 2033
- Figure 11: North America Low Sugar Soda Revenue (undefined), by Country 2025 & 2033
- Figure 12: North America Low Sugar Soda Volume (K), by Country 2025 & 2033
- Figure 13: North America Low Sugar Soda Revenue Share (%), by Country 2025 & 2033
- Figure 14: North America Low Sugar Soda Volume Share (%), by Country 2025 & 2033
- Figure 15: South America Low Sugar Soda Revenue (undefined), by Application 2025 & 2033
- Figure 16: South America Low Sugar Soda Volume (K), by Application 2025 & 2033
- Figure 17: South America Low Sugar Soda Revenue Share (%), by Application 2025 & 2033
- Figure 18: South America Low Sugar Soda Volume Share (%), by Application 2025 & 2033
- Figure 19: South America Low Sugar Soda Revenue (undefined), by Types 2025 & 2033
- Figure 20: South America Low Sugar Soda Volume (K), by Types 2025 & 2033
- Figure 21: South America Low Sugar Soda Revenue Share (%), by Types 2025 & 2033
- Figure 22: South America Low Sugar Soda Volume Share (%), by Types 2025 & 2033
- Figure 23: South America Low Sugar Soda Revenue (undefined), by Country 2025 & 2033
- Figure 24: South America Low Sugar Soda Volume (K), by Country 2025 & 2033
- Figure 25: South America Low Sugar Soda Revenue Share (%), by Country 2025 & 2033
- Figure 26: South America Low Sugar Soda Volume Share (%), by Country 2025 & 2033
- Figure 27: Europe Low Sugar Soda Revenue (undefined), by Application 2025 & 2033
- Figure 28: Europe Low Sugar Soda Volume (K), by Application 2025 & 2033
- Figure 29: Europe Low Sugar Soda Revenue Share (%), by Application 2025 & 2033
- Figure 30: Europe Low Sugar Soda Volume Share (%), by Application 2025 & 2033
- Figure 31: Europe Low Sugar Soda Revenue (undefined), by Types 2025 & 2033
- Figure 32: Europe Low Sugar Soda Volume (K), by Types 2025 & 2033
- Figure 33: Europe Low Sugar Soda Revenue Share (%), by Types 2025 & 2033
- Figure 34: Europe Low Sugar Soda Volume Share (%), by Types 2025 & 2033
- Figure 35: Europe Low Sugar Soda Revenue (undefined), by Country 2025 & 2033
- Figure 36: Europe Low Sugar Soda Volume (K), by Country 2025 & 2033
- Figure 37: Europe Low Sugar Soda Revenue Share (%), by Country 2025 & 2033
- Figure 38: Europe Low Sugar Soda Volume Share (%), by Country 2025 & 2033
- Figure 39: Middle East & Africa Low Sugar Soda Revenue (undefined), by Application 2025 & 2033
- Figure 40: Middle East & Africa Low Sugar Soda Volume (K), by Application 2025 & 2033
- Figure 41: Middle East & Africa Low Sugar Soda Revenue Share (%), by Application 2025 & 2033
- Figure 42: Middle East & Africa Low Sugar Soda Volume Share (%), by Application 2025 & 2033
- Figure 43: Middle East & Africa Low Sugar Soda Revenue (undefined), by Types 2025 & 2033
- Figure 44: Middle East & Africa Low Sugar Soda Volume (K), by Types 2025 & 2033
- Figure 45: Middle East & Africa Low Sugar Soda Revenue Share (%), by Types 2025 & 2033
- Figure 46: Middle East & Africa Low Sugar Soda Volume Share (%), by Types 2025 & 2033
- Figure 47: Middle East & Africa Low Sugar Soda Revenue (undefined), by Country 2025 & 2033
- Figure 48: Middle East & Africa Low Sugar Soda Volume (K), by Country 2025 & 2033
- Figure 49: Middle East & Africa Low Sugar Soda Revenue Share (%), by Country 2025 & 2033
- Figure 50: Middle East & Africa Low Sugar Soda Volume Share (%), by Country 2025 & 2033
- Figure 51: Asia Pacific Low Sugar Soda Revenue (undefined), by Application 2025 & 2033
- Figure 52: Asia Pacific Low Sugar Soda Volume (K), by Application 2025 & 2033
- Figure 53: Asia Pacific Low Sugar Soda Revenue Share (%), by Application 2025 & 2033
- Figure 54: Asia Pacific Low Sugar Soda Volume Share (%), by Application 2025 & 2033
- Figure 55: Asia Pacific Low Sugar Soda Revenue (undefined), by Types 2025 & 2033
- Figure 56: Asia Pacific Low Sugar Soda Volume (K), by Types 2025 & 2033
- Figure 57: Asia Pacific Low Sugar Soda Revenue Share (%), by Types 2025 & 2033
- Figure 58: Asia Pacific Low Sugar Soda Volume Share (%), by Types 2025 & 2033
- Figure 59: Asia Pacific Low Sugar Soda Revenue (undefined), by Country 2025 & 2033
- Figure 60: Asia Pacific Low Sugar Soda Volume (K), by Country 2025 & 2033
- Figure 61: Asia Pacific Low Sugar Soda Revenue Share (%), by Country 2025 & 2033
- Figure 62: Asia Pacific Low Sugar Soda Volume Share (%), by Country 2025 & 2033
List of Tables
- Table 1: Global Low Sugar Soda Revenue undefined Forecast, by Application 2020 & 2033
- Table 2: Global Low Sugar Soda Volume K Forecast, by Application 2020 & 2033
- Table 3: Global Low Sugar Soda Revenue undefined Forecast, by Types 2020 & 2033
- Table 4: Global Low Sugar Soda Volume K Forecast, by Types 2020 & 2033
- Table 5: Global Low Sugar Soda Revenue undefined Forecast, by Region 2020 & 2033
- Table 6: Global Low Sugar Soda Volume K Forecast, by Region 2020 & 2033
- Table 7: Global Low Sugar Soda Revenue undefined Forecast, by Application 2020 & 2033
- Table 8: Global Low Sugar Soda Volume K Forecast, by Application 2020 & 2033
- Table 9: Global Low Sugar Soda Revenue undefined Forecast, by Types 2020 & 2033
- Table 10: Global Low Sugar Soda Volume K Forecast, by Types 2020 & 2033
- Table 11: Global Low Sugar Soda Revenue undefined Forecast, by Country 2020 & 2033
- Table 12: Global Low Sugar Soda Volume K Forecast, by Country 2020 & 2033
- Table 13: United States Low Sugar Soda Revenue (undefined) Forecast, by Application 2020 & 2033
- Table 14: United States Low Sugar Soda Volume (K) Forecast, by Application 2020 & 2033
- Table 15: Canada Low Sugar Soda Revenue (undefined) Forecast, by Application 2020 & 2033
- Table 16: Canada Low Sugar Soda Volume (K) Forecast, by Application 2020 & 2033
- Table 17: Mexico Low Sugar Soda Revenue (undefined) Forecast, by Application 2020 & 2033
- Table 18: Mexico Low Sugar Soda Volume (K) Forecast, by Application 2020 & 2033
- Table 19: Global Low Sugar Soda Revenue undefined Forecast, by Application 2020 & 2033
- Table 20: Global Low Sugar Soda Volume K Forecast, by Application 2020 & 2033
- Table 21: Global Low Sugar Soda Revenue undefined Forecast, by Types 2020 & 2033
- Table 22: Global Low Sugar Soda Volume K Forecast, by Types 2020 & 2033
- Table 23: Global Low Sugar Soda Revenue undefined Forecast, by Country 2020 & 2033
- Table 24: Global Low Sugar Soda Volume K Forecast, by Country 2020 & 2033
- Table 25: Brazil Low Sugar Soda Revenue (undefined) Forecast, by Application 2020 & 2033
- Table 26: Brazil Low Sugar Soda Volume (K) Forecast, by Application 2020 & 2033
- Table 27: Argentina Low Sugar Soda Revenue (undefined) Forecast, by Application 2020 & 2033
- Table 28: Argentina Low Sugar Soda Volume (K) Forecast, by Application 2020 & 2033
- Table 29: Rest of South America Low Sugar Soda Revenue (undefined) Forecast, by Application 2020 & 2033
- Table 30: Rest of South America Low Sugar Soda Volume (K) Forecast, by Application 2020 & 2033
- Table 31: Global Low Sugar Soda Revenue undefined Forecast, by Application 2020 & 2033
- Table 32: Global Low Sugar Soda Volume K Forecast, by Application 2020 & 2033
- Table 33: Global Low Sugar Soda Revenue undefined Forecast, by Types 2020 & 2033
- Table 34: Global Low Sugar Soda Volume K Forecast, by Types 2020 & 2033
- Table 35: Global Low Sugar Soda Revenue undefined Forecast, by Country 2020 & 2033
- Table 36: Global Low Sugar Soda Volume K Forecast, by Country 2020 & 2033
- Table 37: United Kingdom Low Sugar Soda Revenue (undefined) Forecast, by Application 2020 & 2033
- Table 38: United Kingdom Low Sugar Soda Volume (K) Forecast, by Application 2020 & 2033
- Table 39: Germany Low Sugar Soda Revenue (undefined) Forecast, by Application 2020 & 2033
- Table 40: Germany Low Sugar Soda Volume (K) Forecast, by Application 2020 & 2033
- Table 41: France Low Sugar Soda Revenue (undefined) Forecast, by Application 2020 & 2033
- Table 42: France Low Sugar Soda Volume (K) Forecast, by Application 2020 & 2033
- Table 43: Italy Low Sugar Soda Revenue (undefined) Forecast, by Application 2020 & 2033
- Table 44: Italy Low Sugar Soda Volume (K) Forecast, by Application 2020 & 2033
- Table 45: Spain Low Sugar Soda Revenue (undefined) Forecast, by Application 2020 & 2033
- Table 46: Spain Low Sugar Soda Volume (K) Forecast, by Application 2020 & 2033
- Table 47: Russia Low Sugar Soda Revenue (undefined) Forecast, by Application 2020 & 2033
- Table 48: Russia Low Sugar Soda Volume (K) Forecast, by Application 2020 & 2033
- Table 49: Benelux Low Sugar Soda Revenue (undefined) Forecast, by Application 2020 & 2033
- Table 50: Benelux Low Sugar Soda Volume (K) Forecast, by Application 2020 & 2033
- Table 51: Nordics Low Sugar Soda Revenue (undefined) Forecast, by Application 2020 & 2033
- Table 52: Nordics Low Sugar Soda Volume (K) Forecast, by Application 2020 & 2033
- Table 53: Rest of Europe Low Sugar Soda Revenue (undefined) Forecast, by Application 2020 & 2033
- Table 54: Rest of Europe Low Sugar Soda Volume (K) Forecast, by Application 2020 & 2033
- Table 55: Global Low Sugar Soda Revenue undefined Forecast, by Application 2020 & 2033
- Table 56: Global Low Sugar Soda Volume K Forecast, by Application 2020 & 2033
- Table 57: Global Low Sugar Soda Revenue undefined Forecast, by Types 2020 & 2033
- Table 58: Global Low Sugar Soda Volume K Forecast, by Types 2020 & 2033
- Table 59: Global Low Sugar Soda Revenue undefined Forecast, by Country 2020 & 2033
- Table 60: Global Low Sugar Soda Volume K Forecast, by Country 2020 & 2033
- Table 61: Turkey Low Sugar Soda Revenue (undefined) Forecast, by Application 2020 & 2033
- Table 62: Turkey Low Sugar Soda Volume (K) Forecast, by Application 2020 & 2033
- Table 63: Israel Low Sugar Soda Revenue (undefined) Forecast, by Application 2020 & 2033
- Table 64: Israel Low Sugar Soda Volume (K) Forecast, by Application 2020 & 2033
- Table 65: GCC Low Sugar Soda Revenue (undefined) Forecast, by Application 2020 & 2033
- Table 66: GCC Low Sugar Soda Volume (K) Forecast, by Application 2020 & 2033
- Table 67: North Africa Low Sugar Soda Revenue (undefined) Forecast, by Application 2020 & 2033
- Table 68: North Africa Low Sugar Soda Volume (K) Forecast, by Application 2020 & 2033
- Table 69: South Africa Low Sugar Soda Revenue (undefined) Forecast, by Application 2020 & 2033
- Table 70: South Africa Low Sugar Soda Volume (K) Forecast, by Application 2020 & 2033
- Table 71: Rest of Middle East & Africa Low Sugar Soda Revenue (undefined) Forecast, by Application 2020 & 2033
- Table 72: Rest of Middle East & Africa Low Sugar Soda Volume (K) Forecast, by Application 2020 & 2033
- Table 73: Global Low Sugar Soda Revenue undefined Forecast, by Application 2020 & 2033
- Table 74: Global Low Sugar Soda Volume K Forecast, by Application 2020 & 2033
- Table 75: Global Low Sugar Soda Revenue undefined Forecast, by Types 2020 & 2033
- Table 76: Global Low Sugar Soda Volume K Forecast, by Types 2020 & 2033
- Table 77: Global Low Sugar Soda Revenue undefined Forecast, by Country 2020 & 2033
- Table 78: Global Low Sugar Soda Volume K Forecast, by Country 2020 & 2033
- Table 79: China Low Sugar Soda Revenue (undefined) Forecast, by Application 2020 & 2033
- Table 80: China Low Sugar Soda Volume (K) Forecast, by Application 2020 & 2033
- Table 81: India Low Sugar Soda Revenue (undefined) Forecast, by Application 2020 & 2033
- Table 82: India Low Sugar Soda Volume (K) Forecast, by Application 2020 & 2033
- Table 83: Japan Low Sugar Soda Revenue (undefined) Forecast, by Application 2020 & 2033
- Table 84: Japan Low Sugar Soda Volume (K) Forecast, by Application 2020 & 2033
- Table 85: South Korea Low Sugar Soda Revenue (undefined) Forecast, by Application 2020 & 2033
- Table 86: South Korea Low Sugar Soda Volume (K) Forecast, by Application 2020 & 2033
- Table 87: ASEAN Low Sugar Soda Revenue (undefined) Forecast, by Application 2020 & 2033
- Table 88: ASEAN Low Sugar Soda Volume (K) Forecast, by Application 2020 & 2033
- Table 89: Oceania Low Sugar Soda Revenue (undefined) Forecast, by Application 2020 & 2033
- Table 90: Oceania Low Sugar Soda Volume (K) Forecast, by Application 2020 & 2033
- Table 91: Rest of Asia Pacific Low Sugar Soda Revenue (undefined) Forecast, by Application 2020 & 2033
- Table 92: Rest of Asia Pacific Low Sugar Soda Volume (K) Forecast, by Application 2020 & 2033
Frequently Asked Questions
1. What is the projected Compound Annual Growth Rate (CAGR) of the Low Sugar Soda?
The projected CAGR is approximately 6.7%.
2. Which companies are prominent players in the Low Sugar Soda?
Key companies in the market include Coca-Cola, PEPSI, Zevia, Cott, Polar, A&W, Mountain Dew, Dr Pepper Snapple Group, Nestle Water, Talking Rain Beverage Company, Bai Brands LLC, Poppi, Breezzo, Spindrift, Olipop.
3. What are the main segments of the Low Sugar Soda?
The market segments include Application, Types.
4. Can you provide details about the market size?
The market size is estimated to be USD XXX N/A as of 2022.
5. What are some drivers contributing to market growth?
N/A
6. What are the notable trends driving market growth?
N/A
7. Are there any restraints impacting market growth?
N/A
8. Can you provide examples of recent developments in the market?
N/A
9. What pricing options are available for accessing the report?
Pricing options include single-user, multi-user, and enterprise licenses priced at USD 3350.00, USD 5025.00, and USD 6700.00 respectively.
10. Is the market size provided in terms of value or volume?
The market size is provided in terms of value, measured in N/A and volume, measured in K.
11. Are there any specific market keywords associated with the report?
Yes, the market keyword associated with the report is "Low Sugar Soda," which aids in identifying and referencing the specific market segment covered.
12. How do I determine which pricing option suits my needs best?
The pricing options vary based on user requirements and access needs. Individual users may opt for single-user licenses, while businesses requiring broader access may choose multi-user or enterprise licenses for cost-effective access to the report.
13. Are there any additional resources or data provided in the Low Sugar Soda report?
While the report offers comprehensive insights, it's advisable to review the specific contents or supplementary materials provided to ascertain if additional resources or data are available.
14. How can I stay updated on further developments or reports in the Low Sugar Soda?
To stay informed about further developments, trends, and reports in the Low Sugar Soda, consider subscribing to industry newsletters, following relevant companies and organizations, or regularly checking reputable industry news sources and publications.
Methodology
Step 1 - Identification of Relevant Samples Size from Population Database


Step 2 - Approaches for Defining Global Market Size (Value, Volume* & Price*)

Note*: In applicable scenarios
Step 3 - Data Sources
Primary Research
- Web Analytics
- Survey Reports
- Research Institute
- Latest Research Reports
- Opinion Leaders
Secondary Research
- Annual Reports
- White Paper
- Latest Press Release
- Industry Association
- Paid Database
- Investor Presentations

Step 4 - Data Triangulation
Involves using different sources of information in order to increase the validity of a study
These sources are likely to be stakeholders in a program - participants, other researchers, program staff, other community members, and so on.
Then we put all data in single framework & apply various statistical tools to find out the dynamic on the market.
During the analysis stage, feedback from the stakeholder groups would be compared to determine areas of agreement as well as areas of divergence