

Key Insights
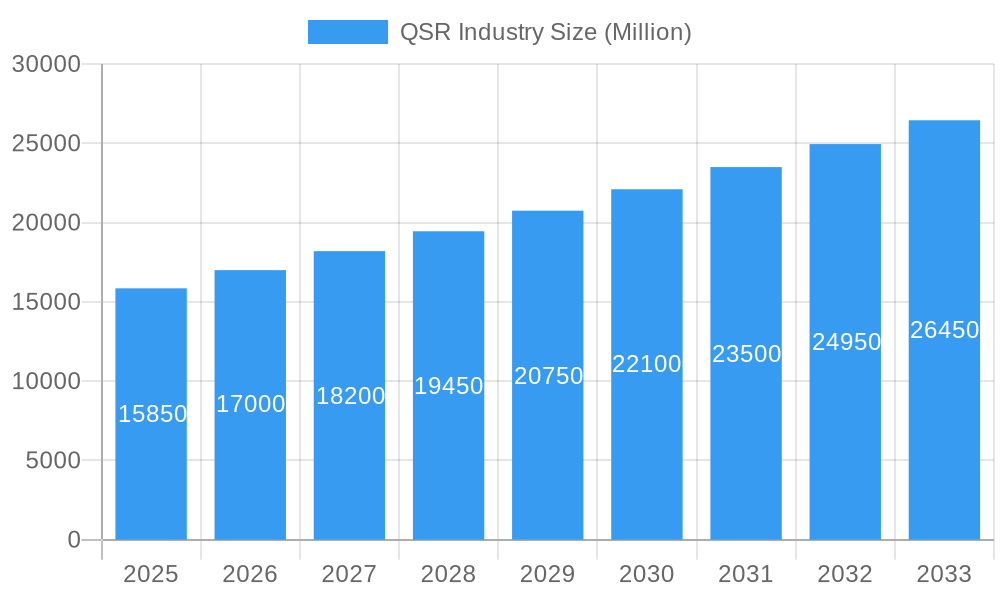
The Quick Service Restaurant (QSR) industry is poised for robust expansion, with a projected market size of $15,850 million in 2025. This growth is propelled by a Compound Annual Growth Rate (CAGR) of 7.4% from 2019 to 2033, indicating sustained momentum. Key drivers include the increasing demand for convenience, evolving consumer lifestyles, and the burgeoning popularity of diverse cuisines within the QSR format. The sector's agility in adapting to consumer preferences, such as the integration of healthier options and digital ordering platforms, further fuels its expansion. Bakeries, Burger joints, and Pizza establishments are anticipated to lead this growth, capturing significant market share due to their widespread appeal and constant innovation. The prevalence of chained outlets, benefiting from brand recognition and operational efficiencies, is expected to continue dominating the market structure, although independent outlets offer niche opportunities for specialized offerings.
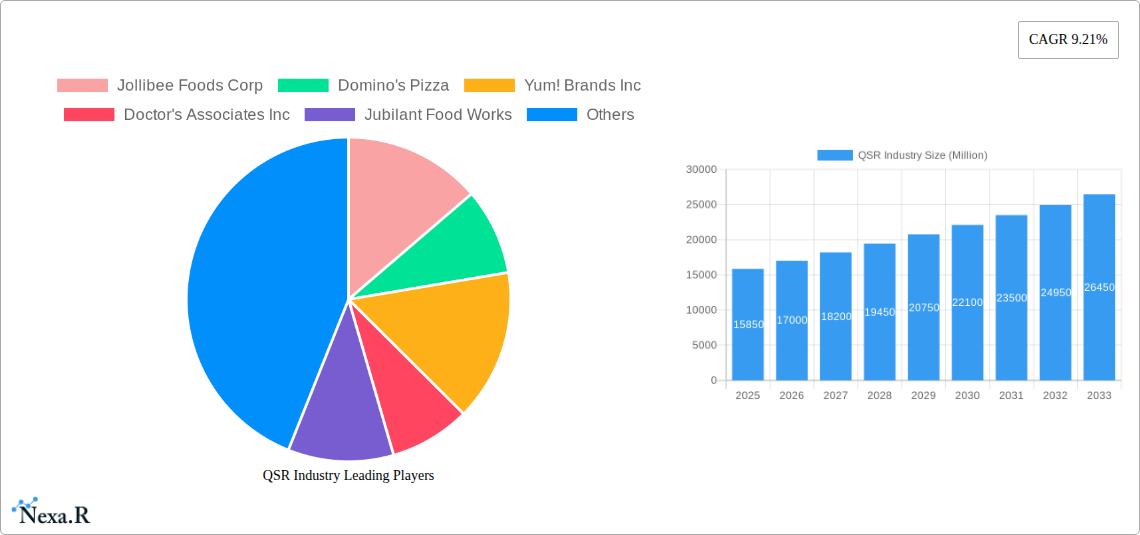
QSR Industry Market Size (In Billion)
The QSR market's trajectory is also shaped by evolving consumer trends, including a growing preference for customizable menus, plant-based alternatives, and a heightened focus on sustainability. Technological advancements, particularly in online ordering, delivery services, and in-store automation, are transforming the customer experience and operational efficiency. However, the industry faces challenges, including rising ingredient costs, labor shortages, and intense competition, which could moderate growth in certain segments. Geographically, North America and Asia Pacific are expected to remain the dominant regions, driven by large populations, disposable incomes, and a strong QSR culture. The strategic expansion of global players like McDonald's Corporation, Yum! Brands Inc., and Domino's Pizza, coupled with the rise of regional powerhouses, will continue to define the competitive landscape.
QSR Industry Company Market Share
Quick Service Restaurant (QSR) Industry Report: Market Dynamics, Growth Trends, and Regional Dominance (2019-2033)
Unlock critical insights into the dynamic Quick Service Restaurant (QSR) industry with this comprehensive report. Spanning the historical period of 2019-2024 and projecting growth through 2033, with a base and estimated year of 2025, this analysis is your definitive guide to understanding market evolution, competitive landscapes, and future opportunities. Dive deep into sector-specific data, including market share percentages, CAGR, and technological adoption rates, crucial for strategic decision-making. This report is essential for stakeholders, investors, and industry professionals seeking to navigate the rapidly evolving global QSR market.
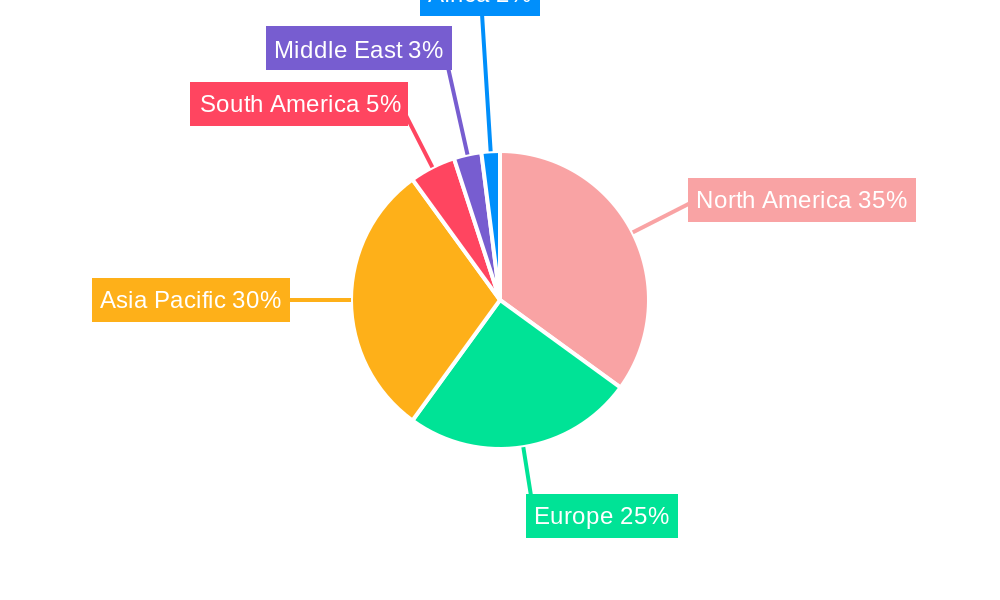
QSR Industry Regional Market Share
QSR Industry Market Dynamics & Structure
The global Quick Service Restaurant (QSR) market is characterized by a moderate concentration, with key players like McDonald's Corporation, Yum! Brands Inc., and Restaurant Brands International holding significant influence. Technological innovation continues to be a primary driver, with advancements in digital ordering platforms, AI-powered customer service, and automated kitchen operations significantly impacting efficiency and customer experience. Regulatory frameworks, particularly concerning food safety, labor practices, and environmental sustainability, play a crucial role in shaping operational strategies. Competitive product substitutes, ranging from home meal kits to ghost kitchens offering diverse culinary options, are intensifying market pressure. End-user demographics are shifting, with a growing demand for healthier options, plant-based alternatives, and personalized dining experiences. Mergers and acquisitions (M&A) trends reveal a strategic consolidation aimed at market expansion, technological integration, and portfolio diversification.
- Market Concentration: Dominated by a few large corporations, but with a growing presence of agile, niche players.
- Technological Innovation Drivers: Digital ordering, AI, automation, data analytics, and advanced supply chain management.
- Regulatory Frameworks: Food safety standards, labor laws, franchising regulations, and sustainability mandates.
- Competitive Product Substitutes: Meal kits, grocery store prepared meals, food trucks, and other casual dining formats.
- End-User Demographics: Millennial and Gen Z preferences for convenience, customization, and ethical sourcing.
- M&A Trends: Focus on acquiring innovative technologies, expanding into new markets, and consolidating market share in high-growth segments. Estimated M&A deal volume projected to reach $25,000 million units by 2028.
QSR Industry Growth Trends & Insights
The Quick Service Restaurant (QSR) industry is poised for robust growth, projected to expand significantly throughout the forecast period. This expansion is fueled by evolving consumer behaviors, technological disruptions, and increasing urbanization across the globe. The market size, estimated at $980,000 million units in 2025, is anticipated to reach $1,500,000 million units by 2033, exhibiting a Compound Annual Growth Rate (CAGR) of approximately 5.5%. Adoption rates for digital ordering and delivery services have surged, becoming integral components of the QSR business model, with an estimated 70% of QSR transactions now initiated digitally. Technological disruptions, including the implementation of AI in personalized marketing and inventory management, are optimizing operations and enhancing customer engagement. Consumer behavior shifts are marked by an increasing demand for convenience, speed, and value, alongside a growing awareness of health and sustainability. The rise of plant-based menus and transparent sourcing practices are further influencing purchasing decisions, creating new avenues for growth and differentiation within the sector. The penetration of QSR outlets in emerging economies is also a key driver, as disposable incomes rise and urbanization continues.
Dominant Regions, Countries, or Segments in QSR Industry
The Pizza cuisine segment stands out as a dominant force in the global QSR industry, consistently outperforming other categories due to its universal appeal, adaptability to various tastes, and strong franchise models. North America, particularly the United States, remains the largest regional market, driven by established brands and high consumer spending on convenience food. Within the United States, the Chained Outlets structure dominates, benefiting from economies of scale, standardized operations, and significant brand recognition. The market share for pizza QSRs in North America is estimated at 30% of the total QSR market, with a projected growth rate of 5.8% through 2033. Key drivers for this dominance include ongoing innovation in toppings and crusts, the widespread availability of delivery and takeout options, and effective marketing campaigns.
- Dominant Segment: Pizza Cuisine
- Market Share: Approximately 30% of the global QSR market.
- Growth Potential: High, driven by product innovation and expanding delivery networks.
- Key Drivers: Ubiquitous appeal, customizable options, and established franchise ecosystems.
- Dominant Region: North America
- Market Size: Estimated $450,000 million units in 2025.
- Growth Drivers: High disposable income, dense population centers, and established consumer demand for convenience.
- Economic Policies: Favorable business environments for franchising and retail expansion.
- Dominant Structure: Chained Outlets
- Market Share: Over 80% of total QSR revenue.
- Advantages: Brand consistency, operational efficiency, marketing power, and supply chain leverage.
- Growth Strategy: Continued expansion through franchising and strategic acquisitions.
QSR Industry Product Landscape
The QSR product landscape is characterized by a relentless pursuit of innovation, focusing on convenience, customization, and evolving dietary preferences. Recent product developments include the introduction of plant-based burger options, healthier sides like kale salads, and premium coffee and beverage selections. Performance metrics highlight the success of limited-time offers (LTOs) in driving foot traffic and sales, with some LTOs contributing up to 15% of quarterly revenue. Technological advancements are enabling personalized menu recommendations through AI-driven apps and the integration of smart kitchen equipment to ensure consistent quality and speed. Unique selling propositions are increasingly centered on transparency in sourcing, ethical practices, and catering to specific dietary needs, such as gluten-free or low-calorie options.
Key Drivers, Barriers & Challenges in QSR Industry
Key Drivers:
- Convenience and Affordability: The core appeal of QSR remains its ability to offer quick, accessible, and budget-friendly meal solutions.
- Technological Integration: Digital ordering, delivery platforms, and AI-driven personalization are enhancing customer experience and operational efficiency, projected to boost sales by $150,000 million units annually.
- Urbanization and Population Growth: Increasing urban populations create a larger customer base and higher demand for convenient food options.
- Evolving Consumer Preferences: Growing demand for healthier, plant-based, and ethically sourced food options is driving menu diversification.
Barriers & Challenges:
- Intense Competition: The QSR market is highly saturated, leading to price wars and the need for constant innovation.
- Supply Chain Disruptions: Global events can lead to ingredient shortages and increased costs, impacting profitability. Estimated impact of $50,000 million units in potential lost revenue.
- Labor Shortages and Rising Wages: Attracting and retaining staff in the service industry, coupled with increasing labor costs, presents a significant challenge.
- Regulatory Compliance: Adhering to evolving food safety, health, and labor regulations adds operational complexity and costs.
- Changing Consumer Lifestyles: The push for healthier eating habits and concerns about sustainability require adaptation.
Emerging Opportunities in QSR Industry
Emerging opportunities in the QSR industry lie in the burgeoning demand for personalized nutrition, the expansion of ghost kitchens to serve delivery-only markets, and the integration of sustainable packaging solutions. Untapped markets in developing economies offer significant growth potential, driven by a rising middle class and increasing adoption of Western dining habits. Innovative applications of AI for hyper-personalized marketing and loyalty programs are creating new avenues for customer engagement. Furthermore, the growing consumer interest in plant-based and ethically sourced ingredients presents a substantial opportunity for brands willing to innovate and adapt their menus.
Growth Accelerators in the QSR Industry Industry
The QSR industry is experiencing accelerated growth driven by several key catalysts. Technological breakthroughs, such as advanced data analytics for consumer behavior prediction and AI-powered operational optimization, are significantly enhancing efficiency and profitability. Strategic partnerships between QSR brands and food delivery aggregators have expanded market reach and customer accessibility, contributing an estimated $200,000 million units in incremental sales. Furthermore, aggressive market expansion strategies, particularly in emerging economies and underserved urban areas, are tapping into new customer bases and driving overall sector growth. The development of more efficient supply chain logistics and the adoption of sustainable practices are also contributing to long-term viability and consumer appeal.
Key Players Shaping the QSR Industry Market
- McDonald's Corporation
- Yum! Brands Inc.
- Restaurant Brands International
- Domino's Pizza
- Jubilant Food Works
- Starbucks Corporation
- The Wendy's Company
- Doctor's Associates Inc.
- Jollibee Foods Corp
- Little Ceaser Enterprises Inc
- Duskin Co Ltd
- Yoshinoya Holdings Co Ltd
Notable Milestones in QSR Industry Sector
- 2019: Increased adoption of mobile ordering and loyalty programs across major QSR chains.
- 2020: Surge in third-party delivery service integration due to global health events, boosting digital sales by 40%.
- 2021: Growing emphasis on plant-based menu options and sustainable sourcing by leading brands.
- 2022: Expansion of drive-thru and curbside pickup services to enhance convenience and reduce in-store contact.
- 2023: Increased investment in AI and automation for operational efficiency and personalized customer experiences.
- 2024 (estimated): Continued growth in the ghost kitchen model and dark kitchens catering specifically to delivery.
In-Depth QSR Industry Market Outlook
The future outlook for the QSR industry is exceptionally bright, fueled by persistent consumer demand for convenience, affordability, and evolving culinary experiences. Growth accelerators such as the continued integration of advanced technologies like AI for personalized marketing and predictive analytics, alongside strategic expansion into untapped international markets, will be pivotal. The industry will also benefit from the growing trend towards sustainable practices and the increasing popularity of plant-based alternatives. Strategic partnerships and a focus on enhancing digital customer journeys will further solidify market dominance and drive substantial revenue growth, with the market projected to reach $1,500,000 million units by 2033.
QSR Industry Segmentation
-
1. Cuisine
- 1.1. Bakeries
- 1.2. Burger
- 1.3. Ice Cream
- 1.4. Meat Based Cuisines
- 1.5. Pizza
- 1.6. Other QSR Cuisine
-
2. Structure
- 2.1. Independent Outlets
- 2.2. Chained Outlets
QSR Industry Segmentation By Geography
-
1. North America
- 1.1. United States
- 1.2. Canada
- 1.3. Mexico
- 1.4. Rest of North America
-
2. Europe
- 2.1. United Kingdom
- 2.2. Germany
- 2.3. Spain
- 2.4. France
- 2.5. Italy
- 2.6. Russia
- 2.7. Rest of Europe
-
3. Asia Pacific
- 3.1. China
- 3.2. Japan
- 3.3. India
- 3.4. Australia
- 3.5. Rest of Asia Pacific
-
4. South America
- 4.1. Brazil
- 4.2. Argentina
- 4.3. Rest of South America
- 5. Middle East
-
6. United Arab Emirates
- 6.1. South Africa
- 6.2. Rest of Middle East
QSR Industry Regional Market Share
Geographic Coverage of QSR Industry
QSR Industry REPORT HIGHLIGHTS
| Aspects | Details |
|---|---|
| Study Period | 2020-2034 |
| Base Year | 2025 |
| Estimated Year | 2026 |
| Forecast Period | 2026-2034 |
| Historical Period | 2020-2025 |
| Growth Rate | CAGR of 5.1% from 2020-2034 |
| Segmentation |
|
Table of Contents
- 1. Introduction
- 1.1. Research Scope
- 1.2. Market Segmentation
- 1.3. Research Objective
- 1.4. Definitions and Assumptions
- 2. Executive Summary
- 2.1. Market Snapshot
- 3. Market Dynamics
- 3.1. Market Drivers
- 3.2. Market Restrains
- 3.3. Market Trends
- 3.4. Market Opportunities
- 4. Market Factor Analysis
- 4.1. Porters Five Forces
- 4.1.1. Bargaining Power of Suppliers
- 4.1.2. Bargaining Power of Buyers
- 4.1.3. Threat of New Entrants
- 4.1.4. Threat of Substitutes
- 4.1.5. Competitive Rivalry
- 4.2. PESTEL analysis
- 4.3. BCG Analysis
- 4.3.1. Stars (High Growth, High Market Share)
- 4.3.2. Cash Cows (Low Growth, High Market Share)
- 4.3.3. Question Mark (High Growth, Low Market Share)
- 4.3.4. Dogs (Low Growth, Low Market Share)
- 4.4. Ansoff Matrix Analysis
- 4.5. Supply Chain Analysis
- 4.6. Regulatory Landscape
- 4.7. Current Market Potential and Opportunity Assessment (TAM–SAM–SOM Framework)
- 4.8. NRP Analyst Note
- 4.1. Porters Five Forces
- 5. Market Analysis, Insights and Forecast 2021-2033
- 5.1. Market Analysis, Insights and Forecast - by Cuisine
- 5.1.1. Bakeries
- 5.1.2. Burger
- 5.1.3. Ice Cream
- 5.1.4. Meat Based Cuisines
- 5.1.5. Pizza
- 5.1.6. Other QSR Cuisine
- 5.2. Market Analysis, Insights and Forecast - by Structure
- 5.2.1. Independent Outlets
- 5.2.2. Chained Outlets
- 5.3. Market Analysis, Insights and Forecast - by Region
- 5.3.1. North America
- 5.3.2. Europe
- 5.3.3. Asia Pacific
- 5.3.4. South America
- 5.3.5. Middle East
- 5.3.6. United Arab Emirates
- 5.1. Market Analysis, Insights and Forecast - by Cuisine
- 6. Global QSR Industry Analysis, Insights and Forecast, 2021-2033
- 6.1. Market Analysis, Insights and Forecast - by Cuisine
- 6.1.1. Bakeries
- 6.1.2. Burger
- 6.1.3. Ice Cream
- 6.1.4. Meat Based Cuisines
- 6.1.5. Pizza
- 6.1.6. Other QSR Cuisine
- 6.2. Market Analysis, Insights and Forecast - by Structure
- 6.2.1. Independent Outlets
- 6.2.2. Chained Outlets
- 6.1. Market Analysis, Insights and Forecast - by Cuisine
- 7. North America QSR Industry Analysis, Insights and Forecast, 2020-2032
- 7.1. Market Analysis, Insights and Forecast - by Cuisine
- 7.1.1. Bakeries
- 7.1.2. Burger
- 7.1.3. Ice Cream
- 7.1.4. Meat Based Cuisines
- 7.1.5. Pizza
- 7.1.6. Other QSR Cuisine
- 7.2. Market Analysis, Insights and Forecast - by Structure
- 7.2.1. Independent Outlets
- 7.2.2. Chained Outlets
- 7.1. Market Analysis, Insights and Forecast - by Cuisine
- 8. Europe QSR Industry Analysis, Insights and Forecast, 2020-2032
- 8.1. Market Analysis, Insights and Forecast - by Cuisine
- 8.1.1. Bakeries
- 8.1.2. Burger
- 8.1.3. Ice Cream
- 8.1.4. Meat Based Cuisines
- 8.1.5. Pizza
- 8.1.6. Other QSR Cuisine
- 8.2. Market Analysis, Insights and Forecast - by Structure
- 8.2.1. Independent Outlets
- 8.2.2. Chained Outlets
- 8.1. Market Analysis, Insights and Forecast - by Cuisine
- 9. Asia Pacific QSR Industry Analysis, Insights and Forecast, 2020-2032
- 9.1. Market Analysis, Insights and Forecast - by Cuisine
- 9.1.1. Bakeries
- 9.1.2. Burger
- 9.1.3. Ice Cream
- 9.1.4. Meat Based Cuisines
- 9.1.5. Pizza
- 9.1.6. Other QSR Cuisine
- 9.2. Market Analysis, Insights and Forecast - by Structure
- 9.2.1. Independent Outlets
- 9.2.2. Chained Outlets
- 9.1. Market Analysis, Insights and Forecast - by Cuisine
- 10. South America QSR Industry Analysis, Insights and Forecast, 2020-2032
- 10.1. Market Analysis, Insights and Forecast - by Cuisine
- 10.1.1. Bakeries
- 10.1.2. Burger
- 10.1.3. Ice Cream
- 10.1.4. Meat Based Cuisines
- 10.1.5. Pizza
- 10.1.6. Other QSR Cuisine
- 10.2. Market Analysis, Insights and Forecast - by Structure
- 10.2.1. Independent Outlets
- 10.2.2. Chained Outlets
- 10.1. Market Analysis, Insights and Forecast - by Cuisine
- 11. Middle East QSR Industry Analysis, Insights and Forecast, 2020-2032
- 11.1. Market Analysis, Insights and Forecast - by Cuisine
- 11.1.1. Bakeries
- 11.1.2. Burger
- 11.1.3. Ice Cream
- 11.1.4. Meat Based Cuisines
- 11.1.5. Pizza
- 11.1.6. Other QSR Cuisine
- 11.2. Market Analysis, Insights and Forecast - by Structure
- 11.2.1. Independent Outlets
- 11.2.2. Chained Outlets
- 11.1. Market Analysis, Insights and Forecast - by Cuisine
- 12. United Arab Emirates QSR Industry Analysis, Insights and Forecast, 2020-2032
- 12.1. Market Analysis, Insights and Forecast - by Cuisine
- 12.1.1. Bakeries
- 12.1.2. Burger
- 12.1.3. Ice Cream
- 12.1.4. Meat Based Cuisines
- 12.1.5. Pizza
- 12.1.6. Other QSR Cuisine
- 12.2. Market Analysis, Insights and Forecast - by Structure
- 12.2.1. Independent Outlets
- 12.2.2. Chained Outlets
- 12.1. Market Analysis, Insights and Forecast - by Cuisine
- 13. Competitive Analysis
- 13.1. Company Profiles
- 13.1.1 Jollibee Foods Corp
- 13.1.1.1. Company Overview
- 13.1.1.2. Products
- 13.1.1.3. Company Financials
- 13.1.1.4. SWOT Analysis
- 13.1.2 Domino's Pizza
- 13.1.2.1. Company Overview
- 13.1.2.2. Products
- 13.1.2.3. Company Financials
- 13.1.2.4. SWOT Analysis
- 13.1.3 Yum! Brands Inc
- 13.1.3.1. Company Overview
- 13.1.3.2. Products
- 13.1.3.3. Company Financials
- 13.1.3.4. SWOT Analysis
- 13.1.4 Doctor's Associates Inc
- 13.1.4.1. Company Overview
- 13.1.4.2. Products
- 13.1.4.3. Company Financials
- 13.1.4.4. SWOT Analysis
- 13.1.5 Jubilant Food Works
- 13.1.5.1. Company Overview
- 13.1.5.2. Products
- 13.1.5.3. Company Financials
- 13.1.5.4. SWOT Analysis
- 13.1.6 The Wendy's Company
- 13.1.6.1. Company Overview
- 13.1.6.2. Products
- 13.1.6.3. Company Financials
- 13.1.6.4. SWOT Analysis
- 13.1.7 Starbucks Corporation*List Not Exhaustive
- 13.1.7.1. Company Overview
- 13.1.7.2. Products
- 13.1.7.3. Company Financials
- 13.1.7.4. SWOT Analysis
- 13.1.8 Little Ceaser Enterprises Inc
- 13.1.8.1. Company Overview
- 13.1.8.2. Products
- 13.1.8.3. Company Financials
- 13.1.8.4. SWOT Analysis
- 13.1.9 Duskin Co Ltd
- 13.1.9.1. Company Overview
- 13.1.9.2. Products
- 13.1.9.3. Company Financials
- 13.1.9.4. SWOT Analysis
- 13.1.10 Yoshinoya Holdings Co Ltd
- 13.1.10.1. Company Overview
- 13.1.10.2. Products
- 13.1.10.3. Company Financials
- 13.1.10.4. SWOT Analysis
- 13.1.11 McDonald's Corporation
- 13.1.11.1. Company Overview
- 13.1.11.2. Products
- 13.1.11.3. Company Financials
- 13.1.11.4. SWOT Analysis
- 13.1.12 Restaurant Brands International
- 13.1.12.1. Company Overview
- 13.1.12.2. Products
- 13.1.12.3. Company Financials
- 13.1.12.4. SWOT Analysis
- 13.1.1 Jollibee Foods Corp
- 13.2. Market Entropy
- 13.2.1 Company's Key Areas Served
- 13.2.2 Recent Developments
- 13.3. Company Market Share Analysis 2025
- 13.3.1 Top 5 Companies Market Share Analysis
- 13.3.2 Top 3 Companies Market Share Analysis
- 13.4. List of Potential Customers
- 14. Research Methodology
List of Figures
- Figure 1: Global QSR Industry Revenue Breakdown (billion, %) by Region 2025 & 2033
- Figure 2: North America QSR Industry Revenue (billion), by Cuisine 2025 & 2033
- Figure 3: North America QSR Industry Revenue Share (%), by Cuisine 2025 & 2033
- Figure 4: North America QSR Industry Revenue (billion), by Structure 2025 & 2033
- Figure 5: North America QSR Industry Revenue Share (%), by Structure 2025 & 2033
- Figure 6: North America QSR Industry Revenue (billion), by Country 2025 & 2033
- Figure 7: North America QSR Industry Revenue Share (%), by Country 2025 & 2033
- Figure 8: Europe QSR Industry Revenue (billion), by Cuisine 2025 & 2033
- Figure 9: Europe QSR Industry Revenue Share (%), by Cuisine 2025 & 2033
- Figure 10: Europe QSR Industry Revenue (billion), by Structure 2025 & 2033
- Figure 11: Europe QSR Industry Revenue Share (%), by Structure 2025 & 2033
- Figure 12: Europe QSR Industry Revenue (billion), by Country 2025 & 2033
- Figure 13: Europe QSR Industry Revenue Share (%), by Country 2025 & 2033
- Figure 14: Asia Pacific QSR Industry Revenue (billion), by Cuisine 2025 & 2033
- Figure 15: Asia Pacific QSR Industry Revenue Share (%), by Cuisine 2025 & 2033
- Figure 16: Asia Pacific QSR Industry Revenue (billion), by Structure 2025 & 2033
- Figure 17: Asia Pacific QSR Industry Revenue Share (%), by Structure 2025 & 2033
- Figure 18: Asia Pacific QSR Industry Revenue (billion), by Country 2025 & 2033
- Figure 19: Asia Pacific QSR Industry Revenue Share (%), by Country 2025 & 2033
- Figure 20: South America QSR Industry Revenue (billion), by Cuisine 2025 & 2033
- Figure 21: South America QSR Industry Revenue Share (%), by Cuisine 2025 & 2033
- Figure 22: South America QSR Industry Revenue (billion), by Structure 2025 & 2033
- Figure 23: South America QSR Industry Revenue Share (%), by Structure 2025 & 2033
- Figure 24: South America QSR Industry Revenue (billion), by Country 2025 & 2033
- Figure 25: South America QSR Industry Revenue Share (%), by Country 2025 & 2033
- Figure 26: Middle East QSR Industry Revenue (billion), by Cuisine 2025 & 2033
- Figure 27: Middle East QSR Industry Revenue Share (%), by Cuisine 2025 & 2033
- Figure 28: Middle East QSR Industry Revenue (billion), by Structure 2025 & 2033
- Figure 29: Middle East QSR Industry Revenue Share (%), by Structure 2025 & 2033
- Figure 30: Middle East QSR Industry Revenue (billion), by Country 2025 & 2033
- Figure 31: Middle East QSR Industry Revenue Share (%), by Country 2025 & 2033
- Figure 32: United Arab Emirates QSR Industry Revenue (billion), by Cuisine 2025 & 2033
- Figure 33: United Arab Emirates QSR Industry Revenue Share (%), by Cuisine 2025 & 2033
- Figure 34: United Arab Emirates QSR Industry Revenue (billion), by Structure 2025 & 2033
- Figure 35: United Arab Emirates QSR Industry Revenue Share (%), by Structure 2025 & 2033
- Figure 36: United Arab Emirates QSR Industry Revenue (billion), by Country 2025 & 2033
- Figure 37: United Arab Emirates QSR Industry Revenue Share (%), by Country 2025 & 2033
List of Tables
- Table 1: Global QSR Industry Revenue billion Forecast, by Cuisine 2020 & 2033
- Table 2: Global QSR Industry Revenue billion Forecast, by Structure 2020 & 2033
- Table 3: Global QSR Industry Revenue billion Forecast, by Region 2020 & 2033
- Table 4: Global QSR Industry Revenue billion Forecast, by Cuisine 2020 & 2033
- Table 5: Global QSR Industry Revenue billion Forecast, by Structure 2020 & 2033
- Table 6: Global QSR Industry Revenue billion Forecast, by Country 2020 & 2033
- Table 7: United States QSR Industry Revenue (billion) Forecast, by Application 2020 & 2033
- Table 8: Canada QSR Industry Revenue (billion) Forecast, by Application 2020 & 2033
- Table 9: Mexico QSR Industry Revenue (billion) Forecast, by Application 2020 & 2033
- Table 10: Rest of North America QSR Industry Revenue (billion) Forecast, by Application 2020 & 2033
- Table 11: Global QSR Industry Revenue billion Forecast, by Cuisine 2020 & 2033
- Table 12: Global QSR Industry Revenue billion Forecast, by Structure 2020 & 2033
- Table 13: Global QSR Industry Revenue billion Forecast, by Country 2020 & 2033
- Table 14: United Kingdom QSR Industry Revenue (billion) Forecast, by Application 2020 & 2033
- Table 15: Germany QSR Industry Revenue (billion) Forecast, by Application 2020 & 2033
- Table 16: Spain QSR Industry Revenue (billion) Forecast, by Application 2020 & 2033
- Table 17: France QSR Industry Revenue (billion) Forecast, by Application 2020 & 2033
- Table 18: Italy QSR Industry Revenue (billion) Forecast, by Application 2020 & 2033
- Table 19: Russia QSR Industry Revenue (billion) Forecast, by Application 2020 & 2033
- Table 20: Rest of Europe QSR Industry Revenue (billion) Forecast, by Application 2020 & 2033
- Table 21: Global QSR Industry Revenue billion Forecast, by Cuisine 2020 & 2033
- Table 22: Global QSR Industry Revenue billion Forecast, by Structure 2020 & 2033
- Table 23: Global QSR Industry Revenue billion Forecast, by Country 2020 & 2033
- Table 24: China QSR Industry Revenue (billion) Forecast, by Application 2020 & 2033
- Table 25: Japan QSR Industry Revenue (billion) Forecast, by Application 2020 & 2033
- Table 26: India QSR Industry Revenue (billion) Forecast, by Application 2020 & 2033
- Table 27: Australia QSR Industry Revenue (billion) Forecast, by Application 2020 & 2033
- Table 28: Rest of Asia Pacific QSR Industry Revenue (billion) Forecast, by Application 2020 & 2033
- Table 29: Global QSR Industry Revenue billion Forecast, by Cuisine 2020 & 2033
- Table 30: Global QSR Industry Revenue billion Forecast, by Structure 2020 & 2033
- Table 31: Global QSR Industry Revenue billion Forecast, by Country 2020 & 2033
- Table 32: Brazil QSR Industry Revenue (billion) Forecast, by Application 2020 & 2033
- Table 33: Argentina QSR Industry Revenue (billion) Forecast, by Application 2020 & 2033
- Table 34: Rest of South America QSR Industry Revenue (billion) Forecast, by Application 2020 & 2033
- Table 35: Global QSR Industry Revenue billion Forecast, by Cuisine 2020 & 2033
- Table 36: Global QSR Industry Revenue billion Forecast, by Structure 2020 & 2033
- Table 37: Global QSR Industry Revenue billion Forecast, by Country 2020 & 2033
- Table 38: Global QSR Industry Revenue billion Forecast, by Cuisine 2020 & 2033
- Table 39: Global QSR Industry Revenue billion Forecast, by Structure 2020 & 2033
- Table 40: Global QSR Industry Revenue billion Forecast, by Country 2020 & 2033
- Table 41: South Africa QSR Industry Revenue (billion) Forecast, by Application 2020 & 2033
- Table 42: Rest of Middle East QSR Industry Revenue (billion) Forecast, by Application 2020 & 2033
Frequently Asked Questions
1. What is the projected Compound Annual Growth Rate (CAGR) of the QSR Industry?
The projected CAGR is approximately 5.1%.
2. Which companies are prominent players in the QSR Industry?
Key companies in the market include Jollibee Foods Corp, Domino's Pizza, Yum! Brands Inc, Doctor's Associates Inc, Jubilant Food Works, The Wendy's Company, Starbucks Corporation*List Not Exhaustive, Little Ceaser Enterprises Inc, Duskin Co Ltd, Yoshinoya Holdings Co Ltd, McDonald's Corporation, Restaurant Brands International.
3. What are the main segments of the QSR Industry?
The market segments include Cuisine, Structure.
4. Can you provide details about the market size?
The market size is estimated to be USD 898 billion as of 2022.
5. What are some drivers contributing to market growth?
Growing Presence of International Fast-Food Restaurants; Restaurant Digitization and AI Are Transforming the QSR Industry.
6. What are the notable trends driving market growth?
Growing Presence of International Fast-Food Restaurants.
7. Are there any restraints impacting market growth?
Consumer Inclination Toward Ready Meals.
8. Can you provide examples of recent developments in the market?
N/A
9. What pricing options are available for accessing the report?
Pricing options include single-user, multi-user, and enterprise licenses priced at USD 4750, USD 5250, and USD 8750 respectively.
10. Is the market size provided in terms of value or volume?
The market size is provided in terms of value, measured in billion.
11. Are there any specific market keywords associated with the report?
Yes, the market keyword associated with the report is "QSR Industry," which aids in identifying and referencing the specific market segment covered.
12. How do I determine which pricing option suits my needs best?
The pricing options vary based on user requirements and access needs. Individual users may opt for single-user licenses, while businesses requiring broader access may choose multi-user or enterprise licenses for cost-effective access to the report.
13. Are there any additional resources or data provided in the QSR Industry report?
While the report offers comprehensive insights, it's advisable to review the specific contents or supplementary materials provided to ascertain if additional resources or data are available.
14. How can I stay updated on further developments or reports in the QSR Industry?
To stay informed about further developments, trends, and reports in the QSR Industry, consider subscribing to industry newsletters, following relevant companies and organizations, or regularly checking reputable industry news sources and publications.
Methodology
Step 1 - Identification of Relevant Samples Size from Population Database


Step 2 - Approaches for Defining Global Market Size (Value, Volume* & Price*)

Note*: In applicable scenarios
Step 3 - Data Sources
Primary Research
- Web Analytics
- Survey Reports
- Research Institute
- Latest Research Reports
- Opinion Leaders
Secondary Research
- Annual Reports
- White Paper
- Latest Press Release
- Industry Association
- Paid Database
- Investor Presentations

Step 4 - Data Triangulation
Involves using different sources of information in order to increase the validity of a study
These sources are likely to be stakeholders in a program - participants, other researchers, program staff, other community members, and so on.
Then we put all data in single framework & apply various statistical tools to find out the dynamic on the market.
During the analysis stage, feedback from the stakeholder groups would be compared to determine areas of agreement as well as areas of divergence