

Key Insights
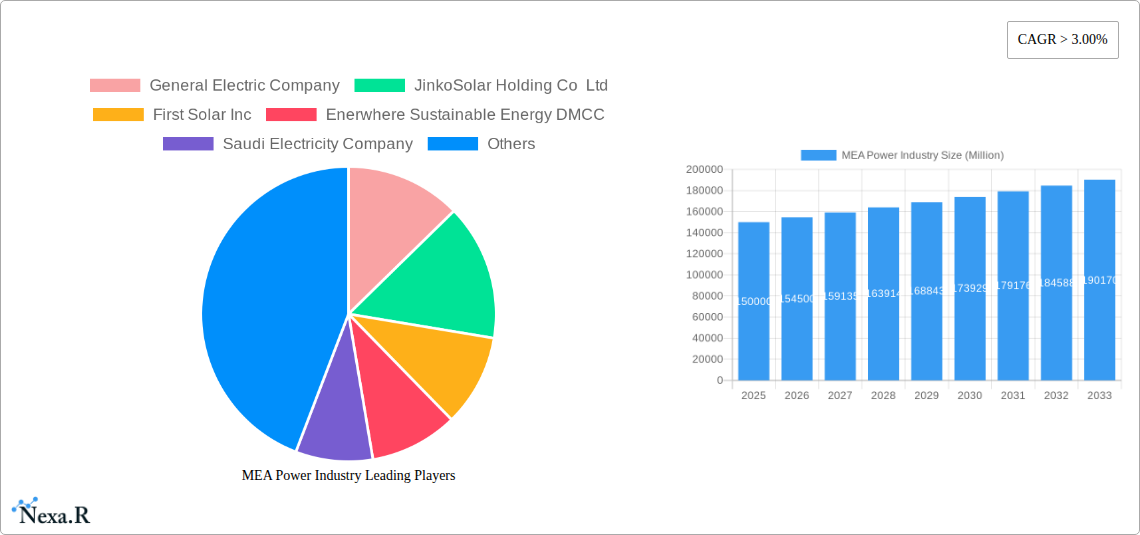
The Middle East and Africa (MEA) power industry is experiencing robust growth, driven by increasing energy demand fueled by population growth, industrialization, and urbanization. The market, valued at an estimated $XX million in 2025, is projected to exhibit a Compound Annual Growth Rate (CAGR) exceeding 3% through 2033. Key drivers include significant investments in renewable energy sources like solar and wind power, spurred by government initiatives to diversify energy portfolios and reduce carbon emissions. Furthermore, large-scale infrastructure projects across the region are creating substantial demand for reliable and efficient power generation. However, the industry faces challenges including the volatile price of fossil fuels, the need for substantial grid upgrades to accommodate renewable energy integration, and potential water scarcity impacting hydroelectric power generation in certain areas. The segment breakdown reveals a significant contribution from thermal power generation, though renewable sources (solar and hydro) are rapidly gaining market share, particularly in countries like the UAE and Saudi Arabia. This shift is propelled by the decreasing cost of renewable energy technologies and supportive government policies. Major players like General Electric, JinkoSolar, and ACWA Power are actively shaping the market landscape through investments in new projects and technological advancements. The geographical distribution shows the UAE, Saudi Arabia, and Egypt as leading markets within the MEA region, but growth opportunities are also evident in other countries as they strive to improve energy infrastructure and access.
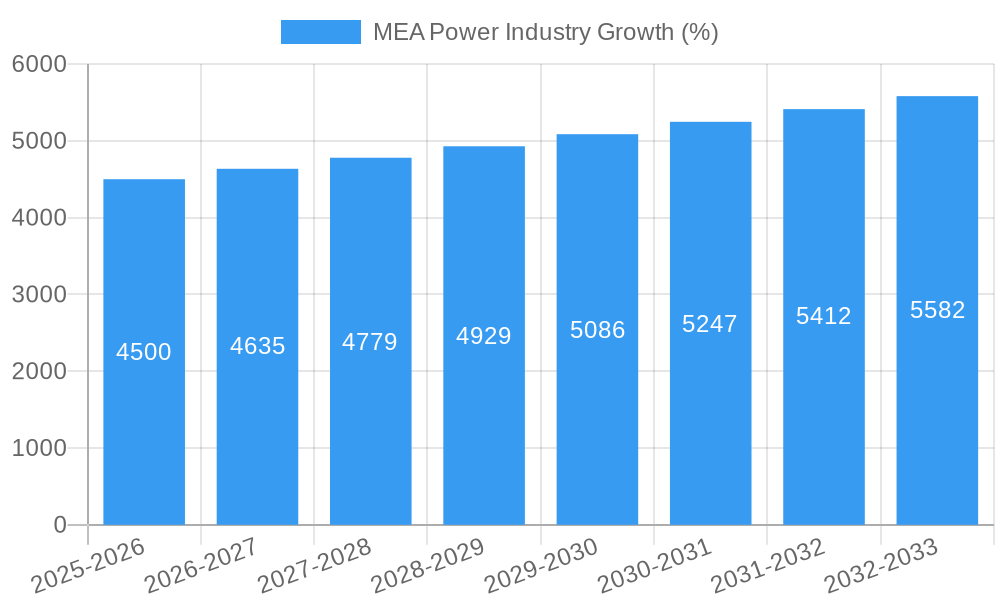
The forecast period (2025-2033) anticipates continued expansion, with growth primarily concentrated in renewable energy segments. However, the pace of growth will depend on various factors including policy support for renewable energy, the successful implementation of grid modernization projects, and continued economic growth within the region. The competitive landscape remains dynamic, with both established international players and regional companies vying for market share. The success of individual companies will hinge on their ability to adapt to changing market conditions, effectively manage risks associated with volatile energy prices and environmental regulations, and innovate to provide cost-effective and sustainable power solutions. Strategic partnerships and technological advancements will be crucial in navigating the evolving landscape of the MEA power industry.
MEA Power Industry Market Report: 2019-2033
This comprehensive report provides a detailed analysis of the Middle East and Africa (MEA) power industry, covering market dynamics, growth trends, dominant players, and future outlook. The study period spans from 2019 to 2033, with 2025 serving as the base and estimated year. The forecast period is 2025-2033, and the historical period encompasses 2019-2024. This report is invaluable for industry professionals, investors, and policymakers seeking to understand and capitalize on the opportunities within this rapidly evolving sector. The report analyzes the parent market (MEA Power Industry) and its various child markets (Generation - Thermal, Renewable, Hydro, Others; and geographic regions: UAE, Saudi Arabia, Egypt, Jordan, Rest of MEA).
MEA Power Industry Market Dynamics & Structure
The MEA power industry is characterized by a complex interplay of market concentration, technological advancements, regulatory frameworks, and competitive dynamics. The market is largely dominated by a few large players, particularly in thermal generation, while the renewable energy sector shows a more fragmented landscape with numerous smaller companies competing alongside established players. Market concentration in thermal generation is estimated at xx%, while renewable energy sources display xx% concentration, reflecting the varied technological and financial entry barriers.
- Market Concentration: xx% in thermal, xx% in renewable (2025).
- Technological Innovation: Strong focus on renewable energy integration (solar, wind, hydro) driving technological improvements in efficiency and cost reduction. Significant investments in smart grids and energy storage solutions are also observed. Barriers to innovation include regulatory uncertainty and lack of standardized infrastructure.
- Regulatory Frameworks: Vary significantly across countries, influencing investment decisions and project timelines. Some countries have supportive policies encouraging renewable energy adoption, while others face regulatory hurdles.
- Competitive Product Substitutes: Increasing competition from renewable sources puts pressure on traditional thermal power generation. Further competition is expected from decentralized energy generation, including residential solar.
- End-User Demographics: High population growth and rapid urbanization in several MEA countries drive increased energy demand, boosting market size.
- M&A Trends: Significant M&A activity is predicted, with larger players consolidating their market positions and entering new segments or regions. Estimated M&A deal volume for 2025 is valued at xx Million.
MEA Power Industry Growth Trends & Insights
The MEA power industry exhibits robust growth driven by increasing energy demand, government initiatives promoting renewable energy integration, and significant investments in new infrastructure projects. The market size for the MEA power industry is expected to reach xx Million by 2025, exhibiting a Compound Annual Growth Rate (CAGR) of xx% during the forecast period. Technological advancements, particularly in renewable energy technologies, are key drivers. The adoption rate of renewable energy sources is increasing steadily, fueled by falling costs and supportive government policies, with a projected market penetration of xx% by 2033. Shifting consumer preferences towards sustainable energy options also contribute to market growth.
Dominant Regions, Countries, or Segments in MEA Power Industry
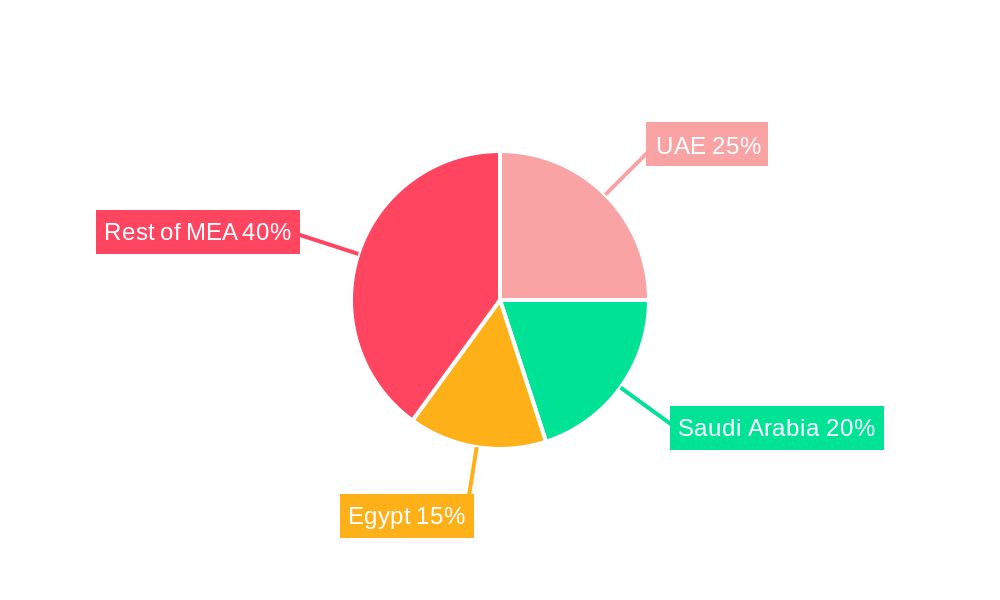
Saudi Arabia and the UAE are the leading markets in the MEA power industry, driven by massive investments in energy infrastructure and ambitious renewable energy targets. Egypt and other North African countries also display high growth potential.
- Saudi Arabia: Dominance in thermal generation with substantial investments in renewable energy projects. Key drivers include economic diversification strategies and Vision 2030 objectives.
- UAE: Strong focus on renewable energy adoption, diversification of energy sources, and substantial investments in solar and nuclear power.
- Egypt: Significant growth driven by population growth, urbanization, and government support for renewable energy projects.
- Jordan: Relatively smaller market but shows significant growth potential due to increasing energy demand and government focus on energy security.
- Rest of MEA: A mix of high growth potential (certain African nations) and slower growth (countries with limited infrastructure and economic constraints).
Market Share (2025): Saudi Arabia (xx%), UAE (xx%), Egypt (xx%), Jordan (xx%), Rest of MEA (xx%).
MEA Power Industry Product Landscape
The MEA power industry encompasses a wide range of products, including conventional thermal power plants, renewable energy systems (solar PV, wind turbines, hydroelectric plants), smart grids, energy storage solutions, and transmission and distribution infrastructure. Technological advancements focus on increasing efficiency, reducing costs, and improving reliability. For example, the adoption of advanced solar PV technologies with higher efficiency and longer lifespans, coupled with energy storage solutions, enhances renewable energy integration. Innovative grid management systems and smart meters improve energy distribution and reduce losses.
Key Drivers, Barriers & Challenges in MEA Power Industry
Key Drivers:
- Increasing energy demand driven by population growth and urbanization.
- Government initiatives promoting renewable energy adoption and energy efficiency.
- Falling costs of renewable energy technologies.
- Investments in new energy infrastructure projects.
Challenges:
- Regulatory uncertainty and inconsistent policies across different countries.
- Limited access to finance for renewable energy projects.
- Infrastructure limitations and grid stability concerns.
- Water scarcity impacting hydro generation in certain regions.
- Geopolitical factors impacting energy security and investment.
Emerging Opportunities in MEA Power Industry
- Growth in distributed generation and off-grid solutions.
- Increasing adoption of smart grids and energy storage technologies.
- Expansion of renewable energy projects in untapped markets across Africa.
- Development of integrated energy systems incorporating multiple renewable energy sources.
- Investments in energy efficiency and demand-side management programs.
Growth Accelerators in the MEA Power Industry Industry
Long-term growth in the MEA power industry will be fueled by a combination of factors, including technological advancements (especially in renewable energy), strategic partnerships between international and local companies, and supportive government policies focused on promoting sustainable energy solutions and economic development. Increased regional cooperation on energy infrastructure and cross-border electricity trade could unlock significant potential.
Key Players Shaping the MEA Power Industry Market
- General Electric Company
- JinkoSolar Holding Co Ltd
- First Solar Inc
- Enerwhere Sustainable Energy DMCC
- Saudi Electricity Company
- Juwi Solar Inc
- Eskom Holdings SOC Ltd
- Wuxi Suntech Power Co Ltd
- Dubai Electricity & Water Authority
- ACWA POWER BARKA SAOG
- Siemens AG
- Canadian Solar Inc
- AGE Technologies JHB (Pty) Limited
Notable Milestones in MEA Power Industry Sector
- 2020: UAE announces ambitious renewable energy targets.
- 2021: Saudi Arabia launches large-scale solar and wind projects.
- 2022: Egypt invests heavily in renewable energy capacity expansion.
- 2023: Several M&A deals consolidate market positions in the renewable energy sector.
- 2024: Significant progress made on smart grid infrastructure development across various countries in the MEA region.
In-Depth MEA Power Industry Market Outlook
The MEA power industry is poised for significant growth in the coming years, driven by a confluence of factors. Continued investments in renewable energy, coupled with advancements in energy storage and grid technologies, will shape the market landscape. The focus on sustainable energy solutions will attract further foreign investments, and regional cooperation on energy infrastructure development will unlock substantial potential. The industry's future trajectory will be defined by the successful integration of renewable resources, grid modernization efforts, and effective regulatory frameworks.
MEA Power Industry Segmentation
-
1. Generation - Source
- 1.1. Thermal
- 1.2. Renewable
- 1.3. Hydro
- 1.4. Others
- 2. Transmission and Distribution
-
3. Geogrpahy
- 3.1. United Arab Emirates
- 3.2. Saudi Arabia
- 3.3. Egypt
- 3.4. Jordan
- 3.5. Rest of Middle-East and Africa
MEA Power Industry Segmentation By Geography
-
1. North America
- 1.1. United States
- 1.2. Canada
- 1.3. Mexico
-
2. South America
- 2.1. Brazil
- 2.2. Argentina
- 2.3. Rest of South America
-
3. Europe
- 3.1. United Kingdom
- 3.2. Germany
- 3.3. France
- 3.4. Italy
- 3.5. Spain
- 3.6. Russia
- 3.7. Benelux
- 3.8. Nordics
- 3.9. Rest of Europe
-
4. Middle East & Africa
- 4.1. Turkey
- 4.2. Israel
- 4.3. GCC
- 4.4. North Africa
- 4.5. South Africa
- 4.6. Rest of Middle East & Africa
-
5. Asia Pacific
- 5.1. China
- 5.2. India
- 5.3. Japan
- 5.4. South Korea
- 5.5. ASEAN
- 5.6. Oceania
- 5.7. Rest of Asia Pacific
MEA Power Industry REPORT HIGHLIGHTS
| Aspects | Details |
|---|---|
| Study Period | 2019-2033 |
| Base Year | 2024 |
| Estimated Year | 2025 |
| Forecast Period | 2025-2033 |
| Historical Period | 2019-2024 |
| Growth Rate | CAGR of > 3.00% from 2019-2033 |
| Segmentation |
|
Table of Contents
- 1. Introduction
- 1.1. Research Scope
- 1.2. Market Segmentation
- 1.3. Research Methodology
- 1.4. Definitions and Assumptions
- 2. Executive Summary
- 2.1. Introduction
- 3. Market Dynamics
- 3.1. Introduction
- 3.2. Market Drivers
- 3.2.1. 4.; Demand for Solar Photovoltaic Installations4.; Growing Investments
- 3.3. Market Restrains
- 3.3.1. 4.; Increasing Wind Energy Installations
- 3.4. Market Trends
- 3.4.1. Thermal Sources to Dominate the Market
- 4. Market Factor Analysis
- 4.1. Porters Five Forces
- 4.2. Supply/Value Chain
- 4.3. PESTEL analysis
- 4.4. Market Entropy
- 4.5. Patent/Trademark Analysis
- 5. Global MEA Power Industry Analysis, Insights and Forecast, 2019-2031
- 5.1. Market Analysis, Insights and Forecast - by Generation - Source
- 5.1.1. Thermal
- 5.1.2. Renewable
- 5.1.3. Hydro
- 5.1.4. Others
- 5.2. Market Analysis, Insights and Forecast - by Transmission and Distribution
- 5.3. Market Analysis, Insights and Forecast - by Geogrpahy
- 5.3.1. United Arab Emirates
- 5.3.2. Saudi Arabia
- 5.3.3. Egypt
- 5.3.4. Jordan
- 5.3.5. Rest of Middle-East and Africa
- 5.4. Market Analysis, Insights and Forecast - by Region
- 5.4.1. North America
- 5.4.2. South America
- 5.4.3. Europe
- 5.4.4. Middle East & Africa
- 5.4.5. Asia Pacific
- 5.1. Market Analysis, Insights and Forecast - by Generation - Source
- 6. North America MEA Power Industry Analysis, Insights and Forecast, 2019-2031
- 6.1. Market Analysis, Insights and Forecast - by Generation - Source
- 6.1.1. Thermal
- 6.1.2. Renewable
- 6.1.3. Hydro
- 6.1.4. Others
- 6.2. Market Analysis, Insights and Forecast - by Transmission and Distribution
- 6.3. Market Analysis, Insights and Forecast - by Geogrpahy
- 6.3.1. United Arab Emirates
- 6.3.2. Saudi Arabia
- 6.3.3. Egypt
- 6.3.4. Jordan
- 6.3.5. Rest of Middle-East and Africa
- 6.1. Market Analysis, Insights and Forecast - by Generation - Source
- 7. South America MEA Power Industry Analysis, Insights and Forecast, 2019-2031
- 7.1. Market Analysis, Insights and Forecast - by Generation - Source
- 7.1.1. Thermal
- 7.1.2. Renewable
- 7.1.3. Hydro
- 7.1.4. Others
- 7.2. Market Analysis, Insights and Forecast - by Transmission and Distribution
- 7.3. Market Analysis, Insights and Forecast - by Geogrpahy
- 7.3.1. United Arab Emirates
- 7.3.2. Saudi Arabia
- 7.3.3. Egypt
- 7.3.4. Jordan
- 7.3.5. Rest of Middle-East and Africa
- 7.1. Market Analysis, Insights and Forecast - by Generation - Source
- 8. Europe MEA Power Industry Analysis, Insights and Forecast, 2019-2031
- 8.1. Market Analysis, Insights and Forecast - by Generation - Source
- 8.1.1. Thermal
- 8.1.2. Renewable
- 8.1.3. Hydro
- 8.1.4. Others
- 8.2. Market Analysis, Insights and Forecast - by Transmission and Distribution
- 8.3. Market Analysis, Insights and Forecast - by Geogrpahy
- 8.3.1. United Arab Emirates
- 8.3.2. Saudi Arabia
- 8.3.3. Egypt
- 8.3.4. Jordan
- 8.3.5. Rest of Middle-East and Africa
- 8.1. Market Analysis, Insights and Forecast - by Generation - Source
- 9. Middle East & Africa MEA Power Industry Analysis, Insights and Forecast, 2019-2031
- 9.1. Market Analysis, Insights and Forecast - by Generation - Source
- 9.1.1. Thermal
- 9.1.2. Renewable
- 9.1.3. Hydro
- 9.1.4. Others
- 9.2. Market Analysis, Insights and Forecast - by Transmission and Distribution
- 9.3. Market Analysis, Insights and Forecast - by Geogrpahy
- 9.3.1. United Arab Emirates
- 9.3.2. Saudi Arabia
- 9.3.3. Egypt
- 9.3.4. Jordan
- 9.3.5. Rest of Middle-East and Africa
- 9.1. Market Analysis, Insights and Forecast - by Generation - Source
- 10. Asia Pacific MEA Power Industry Analysis, Insights and Forecast, 2019-2031
- 10.1. Market Analysis, Insights and Forecast - by Generation - Source
- 10.1.1. Thermal
- 10.1.2. Renewable
- 10.1.3. Hydro
- 10.1.4. Others
- 10.2. Market Analysis, Insights and Forecast - by Transmission and Distribution
- 10.3. Market Analysis, Insights and Forecast - by Geogrpahy
- 10.3.1. United Arab Emirates
- 10.3.2. Saudi Arabia
- 10.3.3. Egypt
- 10.3.4. Jordan
- 10.3.5. Rest of Middle-East and Africa
- 10.1. Market Analysis, Insights and Forecast - by Generation - Source
- 11. North America MEA Power Industry Analysis, Insights and Forecast, 2019-2031
- 11.1. Market Analysis, Insights and Forecast - By Country/Sub-region
- 11.1.1 United States
- 11.1.2 Canada
- 11.1.3 Mexico
- 12. Europe MEA Power Industry Analysis, Insights and Forecast, 2019-2031
- 12.1. Market Analysis, Insights and Forecast - By Country/Sub-region
- 12.1.1 Germany
- 12.1.2 United Kingdom
- 12.1.3 France
- 12.1.4 Spain
- 12.1.5 Italy
- 12.1.6 Spain
- 12.1.7 Belgium
- 12.1.8 Netherland
- 12.1.9 Nordics
- 12.1.10 Rest of Europe
- 13. Asia Pacific MEA Power Industry Analysis, Insights and Forecast, 2019-2031
- 13.1. Market Analysis, Insights and Forecast - By Country/Sub-region
- 13.1.1 China
- 13.1.2 Japan
- 13.1.3 India
- 13.1.4 South Korea
- 13.1.5 Southeast Asia
- 13.1.6 Australia
- 13.1.7 Indonesia
- 13.1.8 Phillipes
- 13.1.9 Singapore
- 13.1.10 Thailandc
- 13.1.11 Rest of Asia Pacific
- 14. South America MEA Power Industry Analysis, Insights and Forecast, 2019-2031
- 14.1. Market Analysis, Insights and Forecast - By Country/Sub-region
- 14.1.1 Brazil
- 14.1.2 Argentina
- 14.1.3 Peru
- 14.1.4 Chile
- 14.1.5 Colombia
- 14.1.6 Ecuador
- 14.1.7 Venezuela
- 14.1.8 Rest of South America
- 15. MEA MEA Power Industry Analysis, Insights and Forecast, 2019-2031
- 15.1. Market Analysis, Insights and Forecast - By Country/Sub-region
- 15.1.1 United Arab Emirates
- 15.1.2 Saudi Arabia
- 15.1.3 South Africa
- 15.1.4 Rest of Middle East and Africa
- 16. Competitive Analysis
- 16.1. Global Market Share Analysis 2024
- 16.2. Company Profiles
- 16.2.1 General Electric Company
- 16.2.1.1. Overview
- 16.2.1.2. Products
- 16.2.1.3. SWOT Analysis
- 16.2.1.4. Recent Developments
- 16.2.1.5. Financials (Based on Availability)
- 16.2.2 JinkoSolar Holding Co Ltd
- 16.2.2.1. Overview
- 16.2.2.2. Products
- 16.2.2.3. SWOT Analysis
- 16.2.2.4. Recent Developments
- 16.2.2.5. Financials (Based on Availability)
- 16.2.3 First Solar Inc
- 16.2.3.1. Overview
- 16.2.3.2. Products
- 16.2.3.3. SWOT Analysis
- 16.2.3.4. Recent Developments
- 16.2.3.5. Financials (Based on Availability)
- 16.2.4 Enerwhere Sustainable Energy DMCC
- 16.2.4.1. Overview
- 16.2.4.2. Products
- 16.2.4.3. SWOT Analysis
- 16.2.4.4. Recent Developments
- 16.2.4.5. Financials (Based on Availability)
- 16.2.5 Saudi Electricity Company
- 16.2.5.1. Overview
- 16.2.5.2. Products
- 16.2.5.3. SWOT Analysis
- 16.2.5.4. Recent Developments
- 16.2.5.5. Financials (Based on Availability)
- 16.2.6 Juwi Solar Inc
- 16.2.6.1. Overview
- 16.2.6.2. Products
- 16.2.6.3. SWOT Analysis
- 16.2.6.4. Recent Developments
- 16.2.6.5. Financials (Based on Availability)
- 16.2.7 Eskom Holdings SOC Ltd
- 16.2.7.1. Overview
- 16.2.7.2. Products
- 16.2.7.3. SWOT Analysis
- 16.2.7.4. Recent Developments
- 16.2.7.5. Financials (Based on Availability)
- 16.2.8 Wuxi Suntech Power Co Ltd
- 16.2.8.1. Overview
- 16.2.8.2. Products
- 16.2.8.3. SWOT Analysis
- 16.2.8.4. Recent Developments
- 16.2.8.5. Financials (Based on Availability)
- 16.2.9 Dubai Electricity & Water Authority
- 16.2.9.1. Overview
- 16.2.9.2. Products
- 16.2.9.3. SWOT Analysis
- 16.2.9.4. Recent Developments
- 16.2.9.5. Financials (Based on Availability)
- 16.2.10 ACWA POWER BARKA SAOG
- 16.2.10.1. Overview
- 16.2.10.2. Products
- 16.2.10.3. SWOT Analysis
- 16.2.10.4. Recent Developments
- 16.2.10.5. Financials (Based on Availability)
- 16.2.11 Siemens AG
- 16.2.11.1. Overview
- 16.2.11.2. Products
- 16.2.11.3. SWOT Analysis
- 16.2.11.4. Recent Developments
- 16.2.11.5. Financials (Based on Availability)
- 16.2.12 Canadian Solar Inc
- 16.2.12.1. Overview
- 16.2.12.2. Products
- 16.2.12.3. SWOT Analysis
- 16.2.12.4. Recent Developments
- 16.2.12.5. Financials (Based on Availability)
- 16.2.13 AGE Technologies JHB (Pty) Limited
- 16.2.13.1. Overview
- 16.2.13.2. Products
- 16.2.13.3. SWOT Analysis
- 16.2.13.4. Recent Developments
- 16.2.13.5. Financials (Based on Availability)
- 16.2.1 General Electric Company
List of Figures
- Figure 1: Global MEA Power Industry Revenue Breakdown (Million, %) by Region 2024 & 2032
- Figure 2: Global MEA Power Industry Volume Breakdown (Gigawatte, %) by Region 2024 & 2032
- Figure 3: North America MEA Power Industry Revenue (Million), by Country 2024 & 2032
- Figure 4: North America MEA Power Industry Volume (Gigawatte), by Country 2024 & 2032
- Figure 5: North America MEA Power Industry Revenue Share (%), by Country 2024 & 2032
- Figure 6: North America MEA Power Industry Volume Share (%), by Country 2024 & 2032
- Figure 7: Europe MEA Power Industry Revenue (Million), by Country 2024 & 2032
- Figure 8: Europe MEA Power Industry Volume (Gigawatte), by Country 2024 & 2032
- Figure 9: Europe MEA Power Industry Revenue Share (%), by Country 2024 & 2032
- Figure 10: Europe MEA Power Industry Volume Share (%), by Country 2024 & 2032
- Figure 11: Asia Pacific MEA Power Industry Revenue (Million), by Country 2024 & 2032
- Figure 12: Asia Pacific MEA Power Industry Volume (Gigawatte), by Country 2024 & 2032
- Figure 13: Asia Pacific MEA Power Industry Revenue Share (%), by Country 2024 & 2032
- Figure 14: Asia Pacific MEA Power Industry Volume Share (%), by Country 2024 & 2032
- Figure 15: South America MEA Power Industry Revenue (Million), by Country 2024 & 2032
- Figure 16: South America MEA Power Industry Volume (Gigawatte), by Country 2024 & 2032
- Figure 17: South America MEA Power Industry Revenue Share (%), by Country 2024 & 2032
- Figure 18: South America MEA Power Industry Volume Share (%), by Country 2024 & 2032
- Figure 19: MEA MEA Power Industry Revenue (Million), by Country 2024 & 2032
- Figure 20: MEA MEA Power Industry Volume (Gigawatte), by Country 2024 & 2032
- Figure 21: MEA MEA Power Industry Revenue Share (%), by Country 2024 & 2032
- Figure 22: MEA MEA Power Industry Volume Share (%), by Country 2024 & 2032
- Figure 23: North America MEA Power Industry Revenue (Million), by Generation - Source 2024 & 2032
- Figure 24: North America MEA Power Industry Volume (Gigawatte), by Generation - Source 2024 & 2032
- Figure 25: North America MEA Power Industry Revenue Share (%), by Generation - Source 2024 & 2032
- Figure 26: North America MEA Power Industry Volume Share (%), by Generation - Source 2024 & 2032
- Figure 27: North America MEA Power Industry Revenue (Million), by Transmission and Distribution 2024 & 2032
- Figure 28: North America MEA Power Industry Volume (Gigawatte), by Transmission and Distribution 2024 & 2032
- Figure 29: North America MEA Power Industry Revenue Share (%), by Transmission and Distribution 2024 & 2032
- Figure 30: North America MEA Power Industry Volume Share (%), by Transmission and Distribution 2024 & 2032
- Figure 31: North America MEA Power Industry Revenue (Million), by Geogrpahy 2024 & 2032
- Figure 32: North America MEA Power Industry Volume (Gigawatte), by Geogrpahy 2024 & 2032
- Figure 33: North America MEA Power Industry Revenue Share (%), by Geogrpahy 2024 & 2032
- Figure 34: North America MEA Power Industry Volume Share (%), by Geogrpahy 2024 & 2032
- Figure 35: North America MEA Power Industry Revenue (Million), by Country 2024 & 2032
- Figure 36: North America MEA Power Industry Volume (Gigawatte), by Country 2024 & 2032
- Figure 37: North America MEA Power Industry Revenue Share (%), by Country 2024 & 2032
- Figure 38: North America MEA Power Industry Volume Share (%), by Country 2024 & 2032
- Figure 39: South America MEA Power Industry Revenue (Million), by Generation - Source 2024 & 2032
- Figure 40: South America MEA Power Industry Volume (Gigawatte), by Generation - Source 2024 & 2032
- Figure 41: South America MEA Power Industry Revenue Share (%), by Generation - Source 2024 & 2032
- Figure 42: South America MEA Power Industry Volume Share (%), by Generation - Source 2024 & 2032
- Figure 43: South America MEA Power Industry Revenue (Million), by Transmission and Distribution 2024 & 2032
- Figure 44: South America MEA Power Industry Volume (Gigawatte), by Transmission and Distribution 2024 & 2032
- Figure 45: South America MEA Power Industry Revenue Share (%), by Transmission and Distribution 2024 & 2032
- Figure 46: South America MEA Power Industry Volume Share (%), by Transmission and Distribution 2024 & 2032
- Figure 47: South America MEA Power Industry Revenue (Million), by Geogrpahy 2024 & 2032
- Figure 48: South America MEA Power Industry Volume (Gigawatte), by Geogrpahy 2024 & 2032
- Figure 49: South America MEA Power Industry Revenue Share (%), by Geogrpahy 2024 & 2032
- Figure 50: South America MEA Power Industry Volume Share (%), by Geogrpahy 2024 & 2032
- Figure 51: South America MEA Power Industry Revenue (Million), by Country 2024 & 2032
- Figure 52: South America MEA Power Industry Volume (Gigawatte), by Country 2024 & 2032
- Figure 53: South America MEA Power Industry Revenue Share (%), by Country 2024 & 2032
- Figure 54: South America MEA Power Industry Volume Share (%), by Country 2024 & 2032
- Figure 55: Europe MEA Power Industry Revenue (Million), by Generation - Source 2024 & 2032
- Figure 56: Europe MEA Power Industry Volume (Gigawatte), by Generation - Source 2024 & 2032
- Figure 57: Europe MEA Power Industry Revenue Share (%), by Generation - Source 2024 & 2032
- Figure 58: Europe MEA Power Industry Volume Share (%), by Generation - Source 2024 & 2032
- Figure 59: Europe MEA Power Industry Revenue (Million), by Transmission and Distribution 2024 & 2032
- Figure 60: Europe MEA Power Industry Volume (Gigawatte), by Transmission and Distribution 2024 & 2032
- Figure 61: Europe MEA Power Industry Revenue Share (%), by Transmission and Distribution 2024 & 2032
- Figure 62: Europe MEA Power Industry Volume Share (%), by Transmission and Distribution 2024 & 2032
- Figure 63: Europe MEA Power Industry Revenue (Million), by Geogrpahy 2024 & 2032
- Figure 64: Europe MEA Power Industry Volume (Gigawatte), by Geogrpahy 2024 & 2032
- Figure 65: Europe MEA Power Industry Revenue Share (%), by Geogrpahy 2024 & 2032
- Figure 66: Europe MEA Power Industry Volume Share (%), by Geogrpahy 2024 & 2032
- Figure 67: Europe MEA Power Industry Revenue (Million), by Country 2024 & 2032
- Figure 68: Europe MEA Power Industry Volume (Gigawatte), by Country 2024 & 2032
- Figure 69: Europe MEA Power Industry Revenue Share (%), by Country 2024 & 2032
- Figure 70: Europe MEA Power Industry Volume Share (%), by Country 2024 & 2032
- Figure 71: Middle East & Africa MEA Power Industry Revenue (Million), by Generation - Source 2024 & 2032
- Figure 72: Middle East & Africa MEA Power Industry Volume (Gigawatte), by Generation - Source 2024 & 2032
- Figure 73: Middle East & Africa MEA Power Industry Revenue Share (%), by Generation - Source 2024 & 2032
- Figure 74: Middle East & Africa MEA Power Industry Volume Share (%), by Generation - Source 2024 & 2032
- Figure 75: Middle East & Africa MEA Power Industry Revenue (Million), by Transmission and Distribution 2024 & 2032
- Figure 76: Middle East & Africa MEA Power Industry Volume (Gigawatte), by Transmission and Distribution 2024 & 2032
- Figure 77: Middle East & Africa MEA Power Industry Revenue Share (%), by Transmission and Distribution 2024 & 2032
- Figure 78: Middle East & Africa MEA Power Industry Volume Share (%), by Transmission and Distribution 2024 & 2032
- Figure 79: Middle East & Africa MEA Power Industry Revenue (Million), by Geogrpahy 2024 & 2032
- Figure 80: Middle East & Africa MEA Power Industry Volume (Gigawatte), by Geogrpahy 2024 & 2032
- Figure 81: Middle East & Africa MEA Power Industry Revenue Share (%), by Geogrpahy 2024 & 2032
- Figure 82: Middle East & Africa MEA Power Industry Volume Share (%), by Geogrpahy 2024 & 2032
- Figure 83: Middle East & Africa MEA Power Industry Revenue (Million), by Country 2024 & 2032
- Figure 84: Middle East & Africa MEA Power Industry Volume (Gigawatte), by Country 2024 & 2032
- Figure 85: Middle East & Africa MEA Power Industry Revenue Share (%), by Country 2024 & 2032
- Figure 86: Middle East & Africa MEA Power Industry Volume Share (%), by Country 2024 & 2032
- Figure 87: Asia Pacific MEA Power Industry Revenue (Million), by Generation - Source 2024 & 2032
- Figure 88: Asia Pacific MEA Power Industry Volume (Gigawatte), by Generation - Source 2024 & 2032
- Figure 89: Asia Pacific MEA Power Industry Revenue Share (%), by Generation - Source 2024 & 2032
- Figure 90: Asia Pacific MEA Power Industry Volume Share (%), by Generation - Source 2024 & 2032
- Figure 91: Asia Pacific MEA Power Industry Revenue (Million), by Transmission and Distribution 2024 & 2032
- Figure 92: Asia Pacific MEA Power Industry Volume (Gigawatte), by Transmission and Distribution 2024 & 2032
- Figure 93: Asia Pacific MEA Power Industry Revenue Share (%), by Transmission and Distribution 2024 & 2032
- Figure 94: Asia Pacific MEA Power Industry Volume Share (%), by Transmission and Distribution 2024 & 2032
- Figure 95: Asia Pacific MEA Power Industry Revenue (Million), by Geogrpahy 2024 & 2032
- Figure 96: Asia Pacific MEA Power Industry Volume (Gigawatte), by Geogrpahy 2024 & 2032
- Figure 97: Asia Pacific MEA Power Industry Revenue Share (%), by Geogrpahy 2024 & 2032
- Figure 98: Asia Pacific MEA Power Industry Volume Share (%), by Geogrpahy 2024 & 2032
- Figure 99: Asia Pacific MEA Power Industry Revenue (Million), by Country 2024 & 2032
- Figure 100: Asia Pacific MEA Power Industry Volume (Gigawatte), by Country 2024 & 2032
- Figure 101: Asia Pacific MEA Power Industry Revenue Share (%), by Country 2024 & 2032
- Figure 102: Asia Pacific MEA Power Industry Volume Share (%), by Country 2024 & 2032
List of Tables
- Table 1: Global MEA Power Industry Revenue Million Forecast, by Region 2019 & 2032
- Table 2: Global MEA Power Industry Volume Gigawatte Forecast, by Region 2019 & 2032
- Table 3: Global MEA Power Industry Revenue Million Forecast, by Generation - Source 2019 & 2032
- Table 4: Global MEA Power Industry Volume Gigawatte Forecast, by Generation - Source 2019 & 2032
- Table 5: Global MEA Power Industry Revenue Million Forecast, by Transmission and Distribution 2019 & 2032
- Table 6: Global MEA Power Industry Volume Gigawatte Forecast, by Transmission and Distribution 2019 & 2032
- Table 7: Global MEA Power Industry Revenue Million Forecast, by Geogrpahy 2019 & 2032
- Table 8: Global MEA Power Industry Volume Gigawatte Forecast, by Geogrpahy 2019 & 2032
- Table 9: Global MEA Power Industry Revenue Million Forecast, by Region 2019 & 2032
- Table 10: Global MEA Power Industry Volume Gigawatte Forecast, by Region 2019 & 2032
- Table 11: Global MEA Power Industry Revenue Million Forecast, by Country 2019 & 2032
- Table 12: Global MEA Power Industry Volume Gigawatte Forecast, by Country 2019 & 2032
- Table 13: United States MEA Power Industry Revenue (Million) Forecast, by Application 2019 & 2032
- Table 14: United States MEA Power Industry Volume (Gigawatte) Forecast, by Application 2019 & 2032
- Table 15: Canada MEA Power Industry Revenue (Million) Forecast, by Application 2019 & 2032
- Table 16: Canada MEA Power Industry Volume (Gigawatte) Forecast, by Application 2019 & 2032
- Table 17: Mexico MEA Power Industry Revenue (Million) Forecast, by Application 2019 & 2032
- Table 18: Mexico MEA Power Industry Volume (Gigawatte) Forecast, by Application 2019 & 2032
- Table 19: Global MEA Power Industry Revenue Million Forecast, by Country 2019 & 2032
- Table 20: Global MEA Power Industry Volume Gigawatte Forecast, by Country 2019 & 2032
- Table 21: Germany MEA Power Industry Revenue (Million) Forecast, by Application 2019 & 2032
- Table 22: Germany MEA Power Industry Volume (Gigawatte) Forecast, by Application 2019 & 2032
- Table 23: United Kingdom MEA Power Industry Revenue (Million) Forecast, by Application 2019 & 2032
- Table 24: United Kingdom MEA Power Industry Volume (Gigawatte) Forecast, by Application 2019 & 2032
- Table 25: France MEA Power Industry Revenue (Million) Forecast, by Application 2019 & 2032
- Table 26: France MEA Power Industry Volume (Gigawatte) Forecast, by Application 2019 & 2032
- Table 27: Spain MEA Power Industry Revenue (Million) Forecast, by Application 2019 & 2032
- Table 28: Spain MEA Power Industry Volume (Gigawatte) Forecast, by Application 2019 & 2032
- Table 29: Italy MEA Power Industry Revenue (Million) Forecast, by Application 2019 & 2032
- Table 30: Italy MEA Power Industry Volume (Gigawatte) Forecast, by Application 2019 & 2032
- Table 31: Spain MEA Power Industry Revenue (Million) Forecast, by Application 2019 & 2032
- Table 32: Spain MEA Power Industry Volume (Gigawatte) Forecast, by Application 2019 & 2032
- Table 33: Belgium MEA Power Industry Revenue (Million) Forecast, by Application 2019 & 2032
- Table 34: Belgium MEA Power Industry Volume (Gigawatte) Forecast, by Application 2019 & 2032
- Table 35: Netherland MEA Power Industry Revenue (Million) Forecast, by Application 2019 & 2032
- Table 36: Netherland MEA Power Industry Volume (Gigawatte) Forecast, by Application 2019 & 2032
- Table 37: Nordics MEA Power Industry Revenue (Million) Forecast, by Application 2019 & 2032
- Table 38: Nordics MEA Power Industry Volume (Gigawatte) Forecast, by Application 2019 & 2032
- Table 39: Rest of Europe MEA Power Industry Revenue (Million) Forecast, by Application 2019 & 2032
- Table 40: Rest of Europe MEA Power Industry Volume (Gigawatte) Forecast, by Application 2019 & 2032
- Table 41: Global MEA Power Industry Revenue Million Forecast, by Country 2019 & 2032
- Table 42: Global MEA Power Industry Volume Gigawatte Forecast, by Country 2019 & 2032
- Table 43: China MEA Power Industry Revenue (Million) Forecast, by Application 2019 & 2032
- Table 44: China MEA Power Industry Volume (Gigawatte) Forecast, by Application 2019 & 2032
- Table 45: Japan MEA Power Industry Revenue (Million) Forecast, by Application 2019 & 2032
- Table 46: Japan MEA Power Industry Volume (Gigawatte) Forecast, by Application 2019 & 2032
- Table 47: India MEA Power Industry Revenue (Million) Forecast, by Application 2019 & 2032
- Table 48: India MEA Power Industry Volume (Gigawatte) Forecast, by Application 2019 & 2032
- Table 49: South Korea MEA Power Industry Revenue (Million) Forecast, by Application 2019 & 2032
- Table 50: South Korea MEA Power Industry Volume (Gigawatte) Forecast, by Application 2019 & 2032
- Table 51: Southeast Asia MEA Power Industry Revenue (Million) Forecast, by Application 2019 & 2032
- Table 52: Southeast Asia MEA Power Industry Volume (Gigawatte) Forecast, by Application 2019 & 2032
- Table 53: Australia MEA Power Industry Revenue (Million) Forecast, by Application 2019 & 2032
- Table 54: Australia MEA Power Industry Volume (Gigawatte) Forecast, by Application 2019 & 2032
- Table 55: Indonesia MEA Power Industry Revenue (Million) Forecast, by Application 2019 & 2032
- Table 56: Indonesia MEA Power Industry Volume (Gigawatte) Forecast, by Application 2019 & 2032
- Table 57: Phillipes MEA Power Industry Revenue (Million) Forecast, by Application 2019 & 2032
- Table 58: Phillipes MEA Power Industry Volume (Gigawatte) Forecast, by Application 2019 & 2032
- Table 59: Singapore MEA Power Industry Revenue (Million) Forecast, by Application 2019 & 2032
- Table 60: Singapore MEA Power Industry Volume (Gigawatte) Forecast, by Application 2019 & 2032
- Table 61: Thailandc MEA Power Industry Revenue (Million) Forecast, by Application 2019 & 2032
- Table 62: Thailandc MEA Power Industry Volume (Gigawatte) Forecast, by Application 2019 & 2032
- Table 63: Rest of Asia Pacific MEA Power Industry Revenue (Million) Forecast, by Application 2019 & 2032
- Table 64: Rest of Asia Pacific MEA Power Industry Volume (Gigawatte) Forecast, by Application 2019 & 2032
- Table 65: Global MEA Power Industry Revenue Million Forecast, by Country 2019 & 2032
- Table 66: Global MEA Power Industry Volume Gigawatte Forecast, by Country 2019 & 2032
- Table 67: Brazil MEA Power Industry Revenue (Million) Forecast, by Application 2019 & 2032
- Table 68: Brazil MEA Power Industry Volume (Gigawatte) Forecast, by Application 2019 & 2032
- Table 69: Argentina MEA Power Industry Revenue (Million) Forecast, by Application 2019 & 2032
- Table 70: Argentina MEA Power Industry Volume (Gigawatte) Forecast, by Application 2019 & 2032
- Table 71: Peru MEA Power Industry Revenue (Million) Forecast, by Application 2019 & 2032
- Table 72: Peru MEA Power Industry Volume (Gigawatte) Forecast, by Application 2019 & 2032
- Table 73: Chile MEA Power Industry Revenue (Million) Forecast, by Application 2019 & 2032
- Table 74: Chile MEA Power Industry Volume (Gigawatte) Forecast, by Application 2019 & 2032
- Table 75: Colombia MEA Power Industry Revenue (Million) Forecast, by Application 2019 & 2032
- Table 76: Colombia MEA Power Industry Volume (Gigawatte) Forecast, by Application 2019 & 2032
- Table 77: Ecuador MEA Power Industry Revenue (Million) Forecast, by Application 2019 & 2032
- Table 78: Ecuador MEA Power Industry Volume (Gigawatte) Forecast, by Application 2019 & 2032
- Table 79: Venezuela MEA Power Industry Revenue (Million) Forecast, by Application 2019 & 2032
- Table 80: Venezuela MEA Power Industry Volume (Gigawatte) Forecast, by Application 2019 & 2032
- Table 81: Rest of South America MEA Power Industry Revenue (Million) Forecast, by Application 2019 & 2032
- Table 82: Rest of South America MEA Power Industry Volume (Gigawatte) Forecast, by Application 2019 & 2032
- Table 83: Global MEA Power Industry Revenue Million Forecast, by Country 2019 & 2032
- Table 84: Global MEA Power Industry Volume Gigawatte Forecast, by Country 2019 & 2032
- Table 85: United Arab Emirates MEA Power Industry Revenue (Million) Forecast, by Application 2019 & 2032
- Table 86: United Arab Emirates MEA Power Industry Volume (Gigawatte) Forecast, by Application 2019 & 2032
- Table 87: Saudi Arabia MEA Power Industry Revenue (Million) Forecast, by Application 2019 & 2032
- Table 88: Saudi Arabia MEA Power Industry Volume (Gigawatte) Forecast, by Application 2019 & 2032
- Table 89: South Africa MEA Power Industry Revenue (Million) Forecast, by Application 2019 & 2032
- Table 90: South Africa MEA Power Industry Volume (Gigawatte) Forecast, by Application 2019 & 2032
- Table 91: Rest of Middle East and Africa MEA Power Industry Revenue (Million) Forecast, by Application 2019 & 2032
- Table 92: Rest of Middle East and Africa MEA Power Industry Volume (Gigawatte) Forecast, by Application 2019 & 2032
- Table 93: Global MEA Power Industry Revenue Million Forecast, by Generation - Source 2019 & 2032
- Table 94: Global MEA Power Industry Volume Gigawatte Forecast, by Generation - Source 2019 & 2032
- Table 95: Global MEA Power Industry Revenue Million Forecast, by Transmission and Distribution 2019 & 2032
- Table 96: Global MEA Power Industry Volume Gigawatte Forecast, by Transmission and Distribution 2019 & 2032
- Table 97: Global MEA Power Industry Revenue Million Forecast, by Geogrpahy 2019 & 2032
- Table 98: Global MEA Power Industry Volume Gigawatte Forecast, by Geogrpahy 2019 & 2032
- Table 99: Global MEA Power Industry Revenue Million Forecast, by Country 2019 & 2032
- Table 100: Global MEA Power Industry Volume Gigawatte Forecast, by Country 2019 & 2032
- Table 101: United States MEA Power Industry Revenue (Million) Forecast, by Application 2019 & 2032
- Table 102: United States MEA Power Industry Volume (Gigawatte) Forecast, by Application 2019 & 2032
- Table 103: Canada MEA Power Industry Revenue (Million) Forecast, by Application 2019 & 2032
- Table 104: Canada MEA Power Industry Volume (Gigawatte) Forecast, by Application 2019 & 2032
- Table 105: Mexico MEA Power Industry Revenue (Million) Forecast, by Application 2019 & 2032
- Table 106: Mexico MEA Power Industry Volume (Gigawatte) Forecast, by Application 2019 & 2032
- Table 107: Global MEA Power Industry Revenue Million Forecast, by Generation - Source 2019 & 2032
- Table 108: Global MEA Power Industry Volume Gigawatte Forecast, by Generation - Source 2019 & 2032
- Table 109: Global MEA Power Industry Revenue Million Forecast, by Transmission and Distribution 2019 & 2032
- Table 110: Global MEA Power Industry Volume Gigawatte Forecast, by Transmission and Distribution 2019 & 2032
- Table 111: Global MEA Power Industry Revenue Million Forecast, by Geogrpahy 2019 & 2032
- Table 112: Global MEA Power Industry Volume Gigawatte Forecast, by Geogrpahy 2019 & 2032
- Table 113: Global MEA Power Industry Revenue Million Forecast, by Country 2019 & 2032
- Table 114: Global MEA Power Industry Volume Gigawatte Forecast, by Country 2019 & 2032
- Table 115: Brazil MEA Power Industry Revenue (Million) Forecast, by Application 2019 & 2032
- Table 116: Brazil MEA Power Industry Volume (Gigawatte) Forecast, by Application 2019 & 2032
- Table 117: Argentina MEA Power Industry Revenue (Million) Forecast, by Application 2019 & 2032
- Table 118: Argentina MEA Power Industry Volume (Gigawatte) Forecast, by Application 2019 & 2032
- Table 119: Rest of South America MEA Power Industry Revenue (Million) Forecast, by Application 2019 & 2032
- Table 120: Rest of South America MEA Power Industry Volume (Gigawatte) Forecast, by Application 2019 & 2032
- Table 121: Global MEA Power Industry Revenue Million Forecast, by Generation - Source 2019 & 2032
- Table 122: Global MEA Power Industry Volume Gigawatte Forecast, by Generation - Source 2019 & 2032
- Table 123: Global MEA Power Industry Revenue Million Forecast, by Transmission and Distribution 2019 & 2032
- Table 124: Global MEA Power Industry Volume Gigawatte Forecast, by Transmission and Distribution 2019 & 2032
- Table 125: Global MEA Power Industry Revenue Million Forecast, by Geogrpahy 2019 & 2032
- Table 126: Global MEA Power Industry Volume Gigawatte Forecast, by Geogrpahy 2019 & 2032
- Table 127: Global MEA Power Industry Revenue Million Forecast, by Country 2019 & 2032
- Table 128: Global MEA Power Industry Volume Gigawatte Forecast, by Country 2019 & 2032
- Table 129: United Kingdom MEA Power Industry Revenue (Million) Forecast, by Application 2019 & 2032
- Table 130: United Kingdom MEA Power Industry Volume (Gigawatte) Forecast, by Application 2019 & 2032
- Table 131: Germany MEA Power Industry Revenue (Million) Forecast, by Application 2019 & 2032
- Table 132: Germany MEA Power Industry Volume (Gigawatte) Forecast, by Application 2019 & 2032
- Table 133: France MEA Power Industry Revenue (Million) Forecast, by Application 2019 & 2032
- Table 134: France MEA Power Industry Volume (Gigawatte) Forecast, by Application 2019 & 2032
- Table 135: Italy MEA Power Industry Revenue (Million) Forecast, by Application 2019 & 2032
- Table 136: Italy MEA Power Industry Volume (Gigawatte) Forecast, by Application 2019 & 2032
- Table 137: Spain MEA Power Industry Revenue (Million) Forecast, by Application 2019 & 2032
- Table 138: Spain MEA Power Industry Volume (Gigawatte) Forecast, by Application 2019 & 2032
- Table 139: Russia MEA Power Industry Revenue (Million) Forecast, by Application 2019 & 2032
- Table 140: Russia MEA Power Industry Volume (Gigawatte) Forecast, by Application 2019 & 2032
- Table 141: Benelux MEA Power Industry Revenue (Million) Forecast, by Application 2019 & 2032
- Table 142: Benelux MEA Power Industry Volume (Gigawatte) Forecast, by Application 2019 & 2032
- Table 143: Nordics MEA Power Industry Revenue (Million) Forecast, by Application 2019 & 2032
- Table 144: Nordics MEA Power Industry Volume (Gigawatte) Forecast, by Application 2019 & 2032
- Table 145: Rest of Europe MEA Power Industry Revenue (Million) Forecast, by Application 2019 & 2032
- Table 146: Rest of Europe MEA Power Industry Volume (Gigawatte) Forecast, by Application 2019 & 2032
- Table 147: Global MEA Power Industry Revenue Million Forecast, by Generation - Source 2019 & 2032
- Table 148: Global MEA Power Industry Volume Gigawatte Forecast, by Generation - Source 2019 & 2032
- Table 149: Global MEA Power Industry Revenue Million Forecast, by Transmission and Distribution 2019 & 2032
- Table 150: Global MEA Power Industry Volume Gigawatte Forecast, by Transmission and Distribution 2019 & 2032
- Table 151: Global MEA Power Industry Revenue Million Forecast, by Geogrpahy 2019 & 2032
- Table 152: Global MEA Power Industry Volume Gigawatte Forecast, by Geogrpahy 2019 & 2032
- Table 153: Global MEA Power Industry Revenue Million Forecast, by Country 2019 & 2032
- Table 154: Global MEA Power Industry Volume Gigawatte Forecast, by Country 2019 & 2032
- Table 155: Turkey MEA Power Industry Revenue (Million) Forecast, by Application 2019 & 2032
- Table 156: Turkey MEA Power Industry Volume (Gigawatte) Forecast, by Application 2019 & 2032
- Table 157: Israel MEA Power Industry Revenue (Million) Forecast, by Application 2019 & 2032
- Table 158: Israel MEA Power Industry Volume (Gigawatte) Forecast, by Application 2019 & 2032
- Table 159: GCC MEA Power Industry Revenue (Million) Forecast, by Application 2019 & 2032
- Table 160: GCC MEA Power Industry Volume (Gigawatte) Forecast, by Application 2019 & 2032
- Table 161: North Africa MEA Power Industry Revenue (Million) Forecast, by Application 2019 & 2032
- Table 162: North Africa MEA Power Industry Volume (Gigawatte) Forecast, by Application 2019 & 2032
- Table 163: South Africa MEA Power Industry Revenue (Million) Forecast, by Application 2019 & 2032
- Table 164: South Africa MEA Power Industry Volume (Gigawatte) Forecast, by Application 2019 & 2032
- Table 165: Rest of Middle East & Africa MEA Power Industry Revenue (Million) Forecast, by Application 2019 & 2032
- Table 166: Rest of Middle East & Africa MEA Power Industry Volume (Gigawatte) Forecast, by Application 2019 & 2032
- Table 167: Global MEA Power Industry Revenue Million Forecast, by Generation - Source 2019 & 2032
- Table 168: Global MEA Power Industry Volume Gigawatte Forecast, by Generation - Source 2019 & 2032
- Table 169: Global MEA Power Industry Revenue Million Forecast, by Transmission and Distribution 2019 & 2032
- Table 170: Global MEA Power Industry Volume Gigawatte Forecast, by Transmission and Distribution 2019 & 2032
- Table 171: Global MEA Power Industry Revenue Million Forecast, by Geogrpahy 2019 & 2032
- Table 172: Global MEA Power Industry Volume Gigawatte Forecast, by Geogrpahy 2019 & 2032
- Table 173: Global MEA Power Industry Revenue Million Forecast, by Country 2019 & 2032
- Table 174: Global MEA Power Industry Volume Gigawatte Forecast, by Country 2019 & 2032
- Table 175: China MEA Power Industry Revenue (Million) Forecast, by Application 2019 & 2032
- Table 176: China MEA Power Industry Volume (Gigawatte) Forecast, by Application 2019 & 2032
- Table 177: India MEA Power Industry Revenue (Million) Forecast, by Application 2019 & 2032
- Table 178: India MEA Power Industry Volume (Gigawatte) Forecast, by Application 2019 & 2032
- Table 179: Japan MEA Power Industry Revenue (Million) Forecast, by Application 2019 & 2032
- Table 180: Japan MEA Power Industry Volume (Gigawatte) Forecast, by Application 2019 & 2032
- Table 181: South Korea MEA Power Industry Revenue (Million) Forecast, by Application 2019 & 2032
- Table 182: South Korea MEA Power Industry Volume (Gigawatte) Forecast, by Application 2019 & 2032
- Table 183: ASEAN MEA Power Industry Revenue (Million) Forecast, by Application 2019 & 2032
- Table 184: ASEAN MEA Power Industry Volume (Gigawatte) Forecast, by Application 2019 & 2032
- Table 185: Oceania MEA Power Industry Revenue (Million) Forecast, by Application 2019 & 2032
- Table 186: Oceania MEA Power Industry Volume (Gigawatte) Forecast, by Application 2019 & 2032
- Table 187: Rest of Asia Pacific MEA Power Industry Revenue (Million) Forecast, by Application 2019 & 2032
- Table 188: Rest of Asia Pacific MEA Power Industry Volume (Gigawatte) Forecast, by Application 2019 & 2032
Frequently Asked Questions
1. What is the projected Compound Annual Growth Rate (CAGR) of the MEA Power Industry?
The projected CAGR is approximately > 3.00%.
2. Which companies are prominent players in the MEA Power Industry?
Key companies in the market include General Electric Company, JinkoSolar Holding Co Ltd, First Solar Inc, Enerwhere Sustainable Energy DMCC, Saudi Electricity Company, Juwi Solar Inc, Eskom Holdings SOC Ltd, Wuxi Suntech Power Co Ltd, Dubai Electricity & Water Authority, ACWA POWER BARKA SAOG, Siemens AG, Canadian Solar Inc, AGE Technologies JHB (Pty) Limited.
3. What are the main segments of the MEA Power Industry?
The market segments include Generation - Source, Transmission and Distribution, Geogrpahy.
4. Can you provide details about the market size?
The market size is estimated to be USD XX Million as of 2022.
5. What are some drivers contributing to market growth?
4.; Demand for Solar Photovoltaic Installations4.; Growing Investments.
6. What are the notable trends driving market growth?
Thermal Sources to Dominate the Market.
7. Are there any restraints impacting market growth?
4.; Increasing Wind Energy Installations.
8. Can you provide examples of recent developments in the market?
N/A
9. What pricing options are available for accessing the report?
Pricing options include single-user, multi-user, and enterprise licenses priced at USD 4750, USD 5250, and USD 8750 respectively.
10. Is the market size provided in terms of value or volume?
The market size is provided in terms of value, measured in Million and volume, measured in Gigawatte.
11. Are there any specific market keywords associated with the report?
Yes, the market keyword associated with the report is "MEA Power Industry," which aids in identifying and referencing the specific market segment covered.
12. How do I determine which pricing option suits my needs best?
The pricing options vary based on user requirements and access needs. Individual users may opt for single-user licenses, while businesses requiring broader access may choose multi-user or enterprise licenses for cost-effective access to the report.
13. Are there any additional resources or data provided in the MEA Power Industry report?
While the report offers comprehensive insights, it's advisable to review the specific contents or supplementary materials provided to ascertain if additional resources or data are available.
14. How can I stay updated on further developments or reports in the MEA Power Industry?
To stay informed about further developments, trends, and reports in the MEA Power Industry, consider subscribing to industry newsletters, following relevant companies and organizations, or regularly checking reputable industry news sources and publications.
Methodology
Step 1 - Identification of Relevant Samples Size from Population Database


Step 2 - Approaches for Defining Global Market Size (Value, Volume* & Price*)

Note*: In applicable scenarios
Step 3 - Data Sources
Primary Research
- Web Analytics
- Survey Reports
- Research Institute
- Latest Research Reports
- Opinion Leaders
Secondary Research
- Annual Reports
- White Paper
- Latest Press Release
- Industry Association
- Paid Database
- Investor Presentations

Step 4 - Data Triangulation
Involves using different sources of information in order to increase the validity of a study
These sources are likely to be stakeholders in a program - participants, other researchers, program staff, other community members, and so on.
Then we put all data in single framework & apply various statistical tools to find out the dynamic on the market.
During the analysis stage, feedback from the stakeholder groups would be compared to determine areas of agreement as well as areas of divergence
