

Key Insights
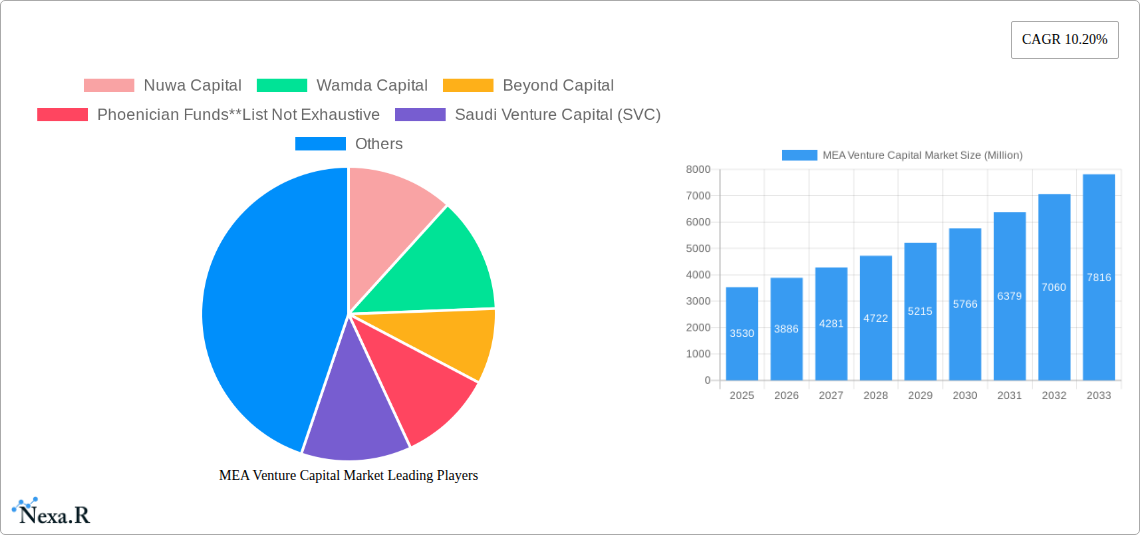
The Middle East and Africa (MEA) venture capital market is experiencing robust growth, projected to reach \$3.53 billion in 2025 and maintain a Compound Annual Growth Rate (CAGR) of 10.20% from 2025 to 2033. This expansion is driven by several key factors. Firstly, a burgeoning entrepreneurial ecosystem, fueled by government initiatives promoting diversification and digital transformation across sectors like technology, fintech, and healthcare in countries such as Saudi Arabia and the UAE, is attracting significant investment. Secondly, the presence of active and increasingly sophisticated local and international venture capital firms like Nuwa Capital, Wamda Capital, and Global Ventures demonstrates investor confidence and provides crucial funding and mentorship. Finally, the region's young and rapidly growing population presents a vast consumer market, creating lucrative opportunities for startups across various sectors including real estate, financial services, food and beverage, and transportation and logistics. However, challenges remain, including regulatory hurdles in some markets and a potential for volatility in global investment flows. The market's segmentation reflects this diversity, with investments spread across numerous industries and investor types, indicating a maturing and diversifying venture capital landscape in the MEA region.
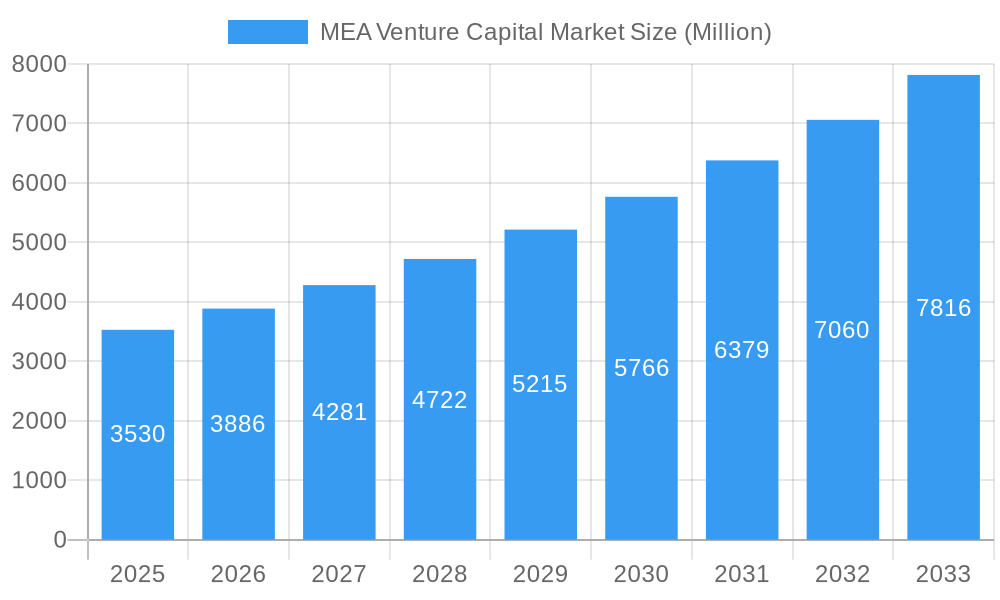
MEA Venture Capital Market Market Size (In Billion)
The forecast for the MEA venture capital market indicates continued strong growth through 2033, exceeding \$8 billion by that year. This sustained expansion will be driven by increasing government support for innovation and the maturation of existing regional players, attracting more international capital and encouraging the establishment of new venture firms. Furthermore, the ongoing digitalization of the MEA region will continue to create compelling investment opportunities across diverse industries. While geopolitical factors and global economic headwinds present potential risks, the underlying growth drivers within the region suggest that the long-term outlook for the MEA venture capital market remains positive and offers substantial opportunities for both investors and entrepreneurs.
MEA Venture Capital Market Company Market Share
MEA Venture Capital Market: A Comprehensive Report (2019-2033)
This comprehensive report provides a detailed analysis of the Middle East and Africa (MEA) Venture Capital market, encompassing market dynamics, growth trends, dominant segments, key players, and future outlook. The study period covers 2019-2033, with 2025 as the base and estimated year. The report is invaluable for venture capitalists, investors, entrepreneurs, and industry analysts seeking to understand and capitalize on opportunities within this dynamic market. We analyze both parent and child markets to give you a complete picture.
Keywords: MEA Venture Capital, Venture Capital Market, Middle East Venture Capital, Africa Venture Capital, Saudi Venture Capital, Private Equity, Investment, Startups, Fintech, Healthcare Investments, Technology Investments, Local Investors, International Investors, Market Size, Market Share, Growth Trends, CAGR, M&A Activity, Nuwa Capital, Wamda Capital, Beyond Capital, Phoenician Funds, Flat6Labs, Saudi Venture Capital Company (SVC), Algebra Ventures, 500 Startups.
MEA Venture Capital Market Dynamics & Structure
The MEA venture capital market is characterized by a complex interplay of factors influencing its structure and growth. Market concentration varies significantly across countries, with some exhibiting dominance by a few large players, while others display a more fragmented landscape. Technological innovation, particularly within fintech and e-commerce, is a major growth driver. However, regulatory frameworks and their implementation across the region remain uneven, posing both challenges and opportunities. The presence of competitive product substitutes and the evolving needs of end-user demographics further shape market dynamics. M&A activity, though not yet extensive compared to more mature markets, is increasing, indicating consolidation and strategic expansion.
- Market Concentration: Highly fragmented in some countries, concentrated in others (e.g., UAE, Saudi Arabia). xx% of the market is controlled by the top 5 players in 2025.
- Technological Innovation: Fintech, e-commerce, and renewable energy are key innovation drivers.
- Regulatory Frameworks: Varying regulations across countries impact investment flows and operational efficiency.
- M&A Trends: Increasing M&A activity reflects market consolidation and strategic expansion, with xx deals recorded in 2024.
- Innovation Barriers: Bureaucracy, lack of funding for early-stage ventures, and talent acquisition challenges hinder innovation.
MEA Venture Capital Market Growth Trends & Insights
The MEA venture capital market has experienced a remarkable surge in recent years, fueled by a potent combination of economic diversification, a burgeoning young population, and a strategic pivot towards digital transformation. This dynamic landscape is attracting significant global and regional investor attention. The market size is projected to reach [Insert Specific Figure Here] Million USD by 2025, exhibiting a robust Compound Annual Growth Rate (CAGR) of [Insert Specific Percentage Here]% during the forecast period (2025-2033). Key drivers include the accelerated adoption of advanced technologies across diverse sectors such as fintech, e-commerce, and healthcare, coupled with evolving consumer behaviors that increasingly favor digital-first solutions and on-demand services. Technological innovations, particularly the widespread adoption of mobile payments and the exponential growth of the e-commerce ecosystem, have been instrumental in accelerating this expansion. Despite navigating regional economic fluctuations and regulatory frameworks, the MEA venture capital market demonstrates exceptional potential for sustained growth, significantly bolstered by proactive governmental initiatives aimed at fostering startup ecosystems and a notable increase in both domestic and international investor appetite for the region's innovative ventures. Market penetration is anticipated to reach [Insert Specific Percentage Here]% by 2033, signifying a deeply embedded venture capital culture.
Dominant Regions, Countries, or Segments in MEA Venture Capital Market
The UAE and Saudi Arabia dominate the MEA venture capital market, driven by strong governmental support for innovation, established financial infrastructure, and a burgeoning tech scene. Within the segment breakdown, the IT and ITeS sector attracts the highest investment, followed by Fintech and Healthcare. International investors are increasingly active, although local investors remain significant contributors. Key drivers for growth include government initiatives promoting entrepreneurship and digital transformation, improving infrastructure and access to funding, and a growing pool of talented entrepreneurs.
- Dominant Regions: UAE and Saudi Arabia account for xx% of the total market value in 2025.
- Leading Industry Segments: IT and ITeS, Fintech, Healthcare.
- Investor Type: While international investors are growing in significance, local investors still hold a substantial market share.
- Key Drivers: Government initiatives, improved infrastructure, growing talent pool, supportive regulatory environment (in some regions).
MEA Venture Capital Market Product Landscape
The MEA venture capital market presents a sophisticated and evolving product and services ecosystem designed to nurture and scale nascent businesses across a spectrum of industries. Offerings range from crucial early-stage seed funding and subsequent rounds like Series A and B funding to more substantial growth equity investments. Beyond traditional capital infusion, there's a growing emphasis on providing comprehensive value-added services. These often include strategic mentoring from seasoned entrepreneurs and industry veterans, curated networking opportunities to forge critical connections, and direct access to specialized industry experts and technical resources. Technological advancements, particularly in disruptive areas like FinTech, Artificial Intelligence (AI), and Blockchain, are not only shaping the types of companies attracting investment but are also driving innovation in the investment strategies themselves, leading to the development of more nuanced and targeted financial instruments and support mechanisms.
Key Drivers, Barriers & Challenges in MEA Venture Capital Market
Key Drivers: Increased government initiatives promoting entrepreneurship, growing tech talent pool, rising consumer adoption of technology, and improving access to funding. Examples include the Saudi Vision 2030 initiative.
Key Barriers and Challenges: Regulatory hurdles and inconsistencies across different countries, a limited access to late-stage funding for scaling ventures, a shortage of experienced venture capitalists, and a lack of standardized industry practices. The impact of these challenges translates into an estimated xx% reduction in investment potential annually.
Emerging Opportunities in MEA Venture Capital Market
Significant untapped opportunities within the MEA venture capital market are emerging in crucial sectors such as renewable energy, driven by the region's abundant solar potential; agritech, addressing food security and efficiency challenges; and edtech, aiming to bridge educational gaps, particularly in underserved African markets. There is immense growth potential in leveraging the pervasive reach of mobile-first technologies to penetrate and serve previously unbanked or underserved populations. Furthermore, expanding investment strategies to encompass diverse regional markets within the broader MEA geography offers substantial upside, capitalizing on unique local demands and entrepreneurial strengths.
Growth Accelerators in the MEA Venture Capital Market Industry
The trajectory of long-term growth in the MEA venture capital market is being powerfully propelled by continuous technological breakthroughs across fields like AI, blockchain, and the Internet of Things (IoT), which are consistently creating novel and high-potential investment avenues. Essential for sustained market expansion is the fostering of strategic partnerships involving governments, private equity firms, corporate venture arms, and international development organizations. Additionally, the implementation of well-defined and targeted government policies that actively promote entrepreneurship, innovation, and ease of doing business within specific high-growth sectors are proving to be critical catalysts for accelerating the entire venture capital ecosystem.
Key Players Shaping the MEA Venture Capital Market Market
- Nuwa Capital
- Wamda Capital
- Beyond Capital
- Phoenician Funds
- Saudi Venture Capital (SVC)
- Falt6Labs Bahrain
- Global ventures
- Vision Ventures
- Algebra Ventures
- 500 Startups
Notable Milestones in MEA Venture Capital Market Sector
- February 2023: Saudi Venture Capital Investment Company launches a USD 1 million income growth fund (SVC Sukuk Fund).
- February 2023: Flat6Labs completes the first close of its USD 20 million 'Startup Seed Fund' in Saudi Arabia, with participation from SVC and the Jada Fund of Funds.
In-Depth MEA Venture Capital Market Market Outlook
The MEA venture capital market is poised for sustained growth, driven by the factors outlined above. Strategic opportunities exist for investors and entrepreneurs alike to capitalize on the increasing adoption of technology, expanding digital economy, and the supportive policy environment in key regions. The future potential of this market is significant, with continued expansion predicted across various sectors and geographies.
MEA Venture Capital Market Segmentation
-
1. Type
- 1.1. Local Investors
- 1.2. International Investors
-
2. Industry
- 2.1. Real Estate
- 2.2. Financial Services
- 2.3. Food & Beverage
- 2.4. Healthcare
- 2.5. Transport and Logistics
- 2.6. IT and ITeS
- 2.7. Education
- 2.8. Other Industries (Energy, etc.)
MEA Venture Capital Market Segmentation By Geography
-
1. North America
- 1.1. United States
- 1.2. Canada
- 1.3. Mexico
-
2. South America
- 2.1. Brazil
- 2.2. Argentina
- 2.3. Rest of South America
-
3. Europe
- 3.1. United Kingdom
- 3.2. Germany
- 3.3. France
- 3.4. Italy
- 3.5. Spain
- 3.6. Russia
- 3.7. Benelux
- 3.8. Nordics
- 3.9. Rest of Europe
-
4. Middle East & Africa
- 4.1. Turkey
- 4.2. Israel
- 4.3. GCC
- 4.4. North Africa
- 4.5. South Africa
- 4.6. Rest of Middle East & Africa
-
5. Asia Pacific
- 5.1. China
- 5.2. India
- 5.3. Japan
- 5.4. South Korea
- 5.5. ASEAN
- 5.6. Oceania
- 5.7. Rest of Asia Pacific
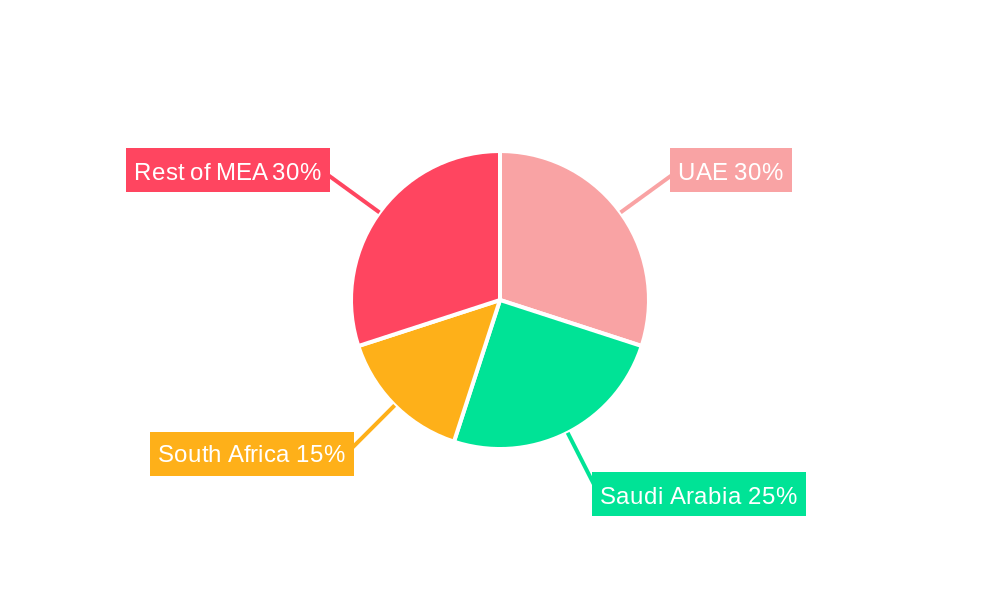
MEA Venture Capital Market Regional Market Share
Geographic Coverage of MEA Venture Capital Market
MEA Venture Capital Market REPORT HIGHLIGHTS
| Aspects | Details |
|---|---|
| Study Period | 2020-2034 |
| Base Year | 2025 |
| Estimated Year | 2026 |
| Forecast Period | 2026-2034 |
| Historical Period | 2020-2025 |
| Growth Rate | CAGR of 10.20% from 2020-2034 |
| Segmentation |
|
Table of Contents
- 1. Introduction
- 1.1. Research Scope
- 1.2. Market Segmentation
- 1.3. Research Objective
- 1.4. Definitions and Assumptions
- 2. Executive Summary
- 2.1. Market Snapshot
- 3. Market Dynamics
- 3.1. Market Drivers
- 3.2. Market Restrains
- 3.3. Market Trends
- 3.4. Market Opportunities
- 4. Market Factor Analysis
- 4.1. Porters Five Forces
- 4.1.1. Bargaining Power of Suppliers
- 4.1.2. Bargaining Power of Buyers
- 4.1.3. Threat of New Entrants
- 4.1.4. Threat of Substitutes
- 4.1.5. Competitive Rivalry
- 4.2. PESTEL analysis
- 4.3. BCG Analysis
- 4.3.1. Stars (High Growth, High Market Share)
- 4.3.2. Cash Cows (Low Growth, High Market Share)
- 4.3.3. Question Mark (High Growth, Low Market Share)
- 4.3.4. Dogs (Low Growth, Low Market Share)
- 4.4. Ansoff Matrix Analysis
- 4.5. Supply Chain Analysis
- 4.6. Regulatory Landscape
- 4.7. Current Market Potential and Opportunity Assessment (TAM–SAM–SOM Framework)
- 4.8. NRP Analyst Note
- 4.1. Porters Five Forces
- 5. Market Analysis, Insights and Forecast 2021-2033
- 5.1. Market Analysis, Insights and Forecast - by Type
- 5.1.1. Local Investors
- 5.1.2. International Investors
- 5.2. Market Analysis, Insights and Forecast - by Industry
- 5.2.1. Real Estate
- 5.2.2. Financial Services
- 5.2.3. Food & Beverage
- 5.2.4. Healthcare
- 5.2.5. Transport and Logistics
- 5.2.6. IT and ITeS
- 5.2.7. Education
- 5.2.8. Other Industries (Energy, etc.)
- 5.3. Market Analysis, Insights and Forecast - by Region
- 5.3.1. North America
- 5.3.2. South America
- 5.3.3. Europe
- 5.3.4. Middle East & Africa
- 5.3.5. Asia Pacific
- 5.1. Market Analysis, Insights and Forecast - by Type
- 6. Global MEA Venture Capital Market Analysis, Insights and Forecast, 2021-2033
- 6.1. Market Analysis, Insights and Forecast - by Type
- 6.1.1. Local Investors
- 6.1.2. International Investors
- 6.2. Market Analysis, Insights and Forecast - by Industry
- 6.2.1. Real Estate
- 6.2.2. Financial Services
- 6.2.3. Food & Beverage
- 6.2.4. Healthcare
- 6.2.5. Transport and Logistics
- 6.2.6. IT and ITeS
- 6.2.7. Education
- 6.2.8. Other Industries (Energy, etc.)
- 6.1. Market Analysis, Insights and Forecast - by Type
- 7. North America MEA Venture Capital Market Analysis, Insights and Forecast, 2020-2032
- 7.1. Market Analysis, Insights and Forecast - by Type
- 7.1.1. Local Investors
- 7.1.2. International Investors
- 7.2. Market Analysis, Insights and Forecast - by Industry
- 7.2.1. Real Estate
- 7.2.2. Financial Services
- 7.2.3. Food & Beverage
- 7.2.4. Healthcare
- 7.2.5. Transport and Logistics
- 7.2.6. IT and ITeS
- 7.2.7. Education
- 7.2.8. Other Industries (Energy, etc.)
- 7.1. Market Analysis, Insights and Forecast - by Type
- 8. South America MEA Venture Capital Market Analysis, Insights and Forecast, 2020-2032
- 8.1. Market Analysis, Insights and Forecast - by Type
- 8.1.1. Local Investors
- 8.1.2. International Investors
- 8.2. Market Analysis, Insights and Forecast - by Industry
- 8.2.1. Real Estate
- 8.2.2. Financial Services
- 8.2.3. Food & Beverage
- 8.2.4. Healthcare
- 8.2.5. Transport and Logistics
- 8.2.6. IT and ITeS
- 8.2.7. Education
- 8.2.8. Other Industries (Energy, etc.)
- 8.1. Market Analysis, Insights and Forecast - by Type
- 9. Europe MEA Venture Capital Market Analysis, Insights and Forecast, 2020-2032
- 9.1. Market Analysis, Insights and Forecast - by Type
- 9.1.1. Local Investors
- 9.1.2. International Investors
- 9.2. Market Analysis, Insights and Forecast - by Industry
- 9.2.1. Real Estate
- 9.2.2. Financial Services
- 9.2.3. Food & Beverage
- 9.2.4. Healthcare
- 9.2.5. Transport and Logistics
- 9.2.6. IT and ITeS
- 9.2.7. Education
- 9.2.8. Other Industries (Energy, etc.)
- 9.1. Market Analysis, Insights and Forecast - by Type
- 10. Middle East & Africa MEA Venture Capital Market Analysis, Insights and Forecast, 2020-2032
- 10.1. Market Analysis, Insights and Forecast - by Type
- 10.1.1. Local Investors
- 10.1.2. International Investors
- 10.2. Market Analysis, Insights and Forecast - by Industry
- 10.2.1. Real Estate
- 10.2.2. Financial Services
- 10.2.3. Food & Beverage
- 10.2.4. Healthcare
- 10.2.5. Transport and Logistics
- 10.2.6. IT and ITeS
- 10.2.7. Education
- 10.2.8. Other Industries (Energy, etc.)
- 10.1. Market Analysis, Insights and Forecast - by Type
- 11. Asia Pacific MEA Venture Capital Market Analysis, Insights and Forecast, 2020-2032
- 11.1. Market Analysis, Insights and Forecast - by Type
- 11.1.1. Local Investors
- 11.1.2. International Investors
- 11.2. Market Analysis, Insights and Forecast - by Industry
- 11.2.1. Real Estate
- 11.2.2. Financial Services
- 11.2.3. Food & Beverage
- 11.2.4. Healthcare
- 11.2.5. Transport and Logistics
- 11.2.6. IT and ITeS
- 11.2.7. Education
- 11.2.8. Other Industries (Energy, etc.)
- 11.1. Market Analysis, Insights and Forecast - by Type
- 12. Competitive Analysis
- 12.1. Company Profiles
- 12.1.1 Nuwa Capital
- 12.1.1.1. Company Overview
- 12.1.1.2. Products
- 12.1.1.3. Company Financials
- 12.1.1.4. SWOT Analysis
- 12.1.2 Wamda Capital
- 12.1.2.1. Company Overview
- 12.1.2.2. Products
- 12.1.2.3. Company Financials
- 12.1.2.4. SWOT Analysis
- 12.1.3 Beyond Capital
- 12.1.3.1. Company Overview
- 12.1.3.2. Products
- 12.1.3.3. Company Financials
- 12.1.3.4. SWOT Analysis
- 12.1.4 Phoenician Funds**List Not Exhaustive
- 12.1.4.1. Company Overview
- 12.1.4.2. Products
- 12.1.4.3. Company Financials
- 12.1.4.4. SWOT Analysis
- 12.1.5 Saudi Venture Capital (SVC)
- 12.1.5.1. Company Overview
- 12.1.5.2. Products
- 12.1.5.3. Company Financials
- 12.1.5.4. SWOT Analysis
- 12.1.6 Falt6Labs Bahrain
- 12.1.6.1. Company Overview
- 12.1.6.2. Products
- 12.1.6.3. Company Financials
- 12.1.6.4. SWOT Analysis
- 12.1.7 Global ventures
- 12.1.7.1. Company Overview
- 12.1.7.2. Products
- 12.1.7.3. Company Financials
- 12.1.7.4. SWOT Analysis
- 12.1.8 Vision Ventures
- 12.1.8.1. Company Overview
- 12.1.8.2. Products
- 12.1.8.3. Company Financials
- 12.1.8.4. SWOT Analysis
- 12.1.9 Algebra Ventures
- 12.1.9.1. Company Overview
- 12.1.9.2. Products
- 12.1.9.3. Company Financials
- 12.1.9.4. SWOT Analysis
- 12.1.10 500 Startups
- 12.1.10.1. Company Overview
- 12.1.10.2. Products
- 12.1.10.3. Company Financials
- 12.1.10.4. SWOT Analysis
- 12.1.1 Nuwa Capital
- 12.2. Market Entropy
- 12.2.1 Company's Key Areas Served
- 12.2.2 Recent Developments
- 12.3. Company Market Share Analysis 2025
- 12.3.1 Top 5 Companies Market Share Analysis
- 12.3.2 Top 3 Companies Market Share Analysis
- 12.4. List of Potential Customers
- 13. Research Methodology
List of Figures
- Figure 1: Global MEA Venture Capital Market Revenue Breakdown (Million, %) by Region 2025 & 2033
- Figure 2: North America MEA Venture Capital Market Revenue (Million), by Type 2025 & 2033
- Figure 3: North America MEA Venture Capital Market Revenue Share (%), by Type 2025 & 2033
- Figure 4: North America MEA Venture Capital Market Revenue (Million), by Industry 2025 & 2033
- Figure 5: North America MEA Venture Capital Market Revenue Share (%), by Industry 2025 & 2033
- Figure 6: North America MEA Venture Capital Market Revenue (Million), by Country 2025 & 2033
- Figure 7: North America MEA Venture Capital Market Revenue Share (%), by Country 2025 & 2033
- Figure 8: South America MEA Venture Capital Market Revenue (Million), by Type 2025 & 2033
- Figure 9: South America MEA Venture Capital Market Revenue Share (%), by Type 2025 & 2033
- Figure 10: South America MEA Venture Capital Market Revenue (Million), by Industry 2025 & 2033
- Figure 11: South America MEA Venture Capital Market Revenue Share (%), by Industry 2025 & 2033
- Figure 12: South America MEA Venture Capital Market Revenue (Million), by Country 2025 & 2033
- Figure 13: South America MEA Venture Capital Market Revenue Share (%), by Country 2025 & 2033
- Figure 14: Europe MEA Venture Capital Market Revenue (Million), by Type 2025 & 2033
- Figure 15: Europe MEA Venture Capital Market Revenue Share (%), by Type 2025 & 2033
- Figure 16: Europe MEA Venture Capital Market Revenue (Million), by Industry 2025 & 2033
- Figure 17: Europe MEA Venture Capital Market Revenue Share (%), by Industry 2025 & 2033
- Figure 18: Europe MEA Venture Capital Market Revenue (Million), by Country 2025 & 2033
- Figure 19: Europe MEA Venture Capital Market Revenue Share (%), by Country 2025 & 2033
- Figure 20: Middle East & Africa MEA Venture Capital Market Revenue (Million), by Type 2025 & 2033
- Figure 21: Middle East & Africa MEA Venture Capital Market Revenue Share (%), by Type 2025 & 2033
- Figure 22: Middle East & Africa MEA Venture Capital Market Revenue (Million), by Industry 2025 & 2033
- Figure 23: Middle East & Africa MEA Venture Capital Market Revenue Share (%), by Industry 2025 & 2033
- Figure 24: Middle East & Africa MEA Venture Capital Market Revenue (Million), by Country 2025 & 2033
- Figure 25: Middle East & Africa MEA Venture Capital Market Revenue Share (%), by Country 2025 & 2033
- Figure 26: Asia Pacific MEA Venture Capital Market Revenue (Million), by Type 2025 & 2033
- Figure 27: Asia Pacific MEA Venture Capital Market Revenue Share (%), by Type 2025 & 2033
- Figure 28: Asia Pacific MEA Venture Capital Market Revenue (Million), by Industry 2025 & 2033
- Figure 29: Asia Pacific MEA Venture Capital Market Revenue Share (%), by Industry 2025 & 2033
- Figure 30: Asia Pacific MEA Venture Capital Market Revenue (Million), by Country 2025 & 2033
- Figure 31: Asia Pacific MEA Venture Capital Market Revenue Share (%), by Country 2025 & 2033
List of Tables
- Table 1: Global MEA Venture Capital Market Revenue Million Forecast, by Type 2020 & 2033
- Table 2: Global MEA Venture Capital Market Revenue Million Forecast, by Industry 2020 & 2033
- Table 3: Global MEA Venture Capital Market Revenue Million Forecast, by Region 2020 & 2033
- Table 4: Global MEA Venture Capital Market Revenue Million Forecast, by Type 2020 & 2033
- Table 5: Global MEA Venture Capital Market Revenue Million Forecast, by Industry 2020 & 2033
- Table 6: Global MEA Venture Capital Market Revenue Million Forecast, by Country 2020 & 2033
- Table 7: United States MEA Venture Capital Market Revenue (Million) Forecast, by Application 2020 & 2033
- Table 8: Canada MEA Venture Capital Market Revenue (Million) Forecast, by Application 2020 & 2033
- Table 9: Mexico MEA Venture Capital Market Revenue (Million) Forecast, by Application 2020 & 2033
- Table 10: Global MEA Venture Capital Market Revenue Million Forecast, by Type 2020 & 2033
- Table 11: Global MEA Venture Capital Market Revenue Million Forecast, by Industry 2020 & 2033
- Table 12: Global MEA Venture Capital Market Revenue Million Forecast, by Country 2020 & 2033
- Table 13: Brazil MEA Venture Capital Market Revenue (Million) Forecast, by Application 2020 & 2033
- Table 14: Argentina MEA Venture Capital Market Revenue (Million) Forecast, by Application 2020 & 2033
- Table 15: Rest of South America MEA Venture Capital Market Revenue (Million) Forecast, by Application 2020 & 2033
- Table 16: Global MEA Venture Capital Market Revenue Million Forecast, by Type 2020 & 2033
- Table 17: Global MEA Venture Capital Market Revenue Million Forecast, by Industry 2020 & 2033
- Table 18: Global MEA Venture Capital Market Revenue Million Forecast, by Country 2020 & 2033
- Table 19: United Kingdom MEA Venture Capital Market Revenue (Million) Forecast, by Application 2020 & 2033
- Table 20: Germany MEA Venture Capital Market Revenue (Million) Forecast, by Application 2020 & 2033
- Table 21: France MEA Venture Capital Market Revenue (Million) Forecast, by Application 2020 & 2033
- Table 22: Italy MEA Venture Capital Market Revenue (Million) Forecast, by Application 2020 & 2033
- Table 23: Spain MEA Venture Capital Market Revenue (Million) Forecast, by Application 2020 & 2033
- Table 24: Russia MEA Venture Capital Market Revenue (Million) Forecast, by Application 2020 & 2033
- Table 25: Benelux MEA Venture Capital Market Revenue (Million) Forecast, by Application 2020 & 2033
- Table 26: Nordics MEA Venture Capital Market Revenue (Million) Forecast, by Application 2020 & 2033
- Table 27: Rest of Europe MEA Venture Capital Market Revenue (Million) Forecast, by Application 2020 & 2033
- Table 28: Global MEA Venture Capital Market Revenue Million Forecast, by Type 2020 & 2033
- Table 29: Global MEA Venture Capital Market Revenue Million Forecast, by Industry 2020 & 2033
- Table 30: Global MEA Venture Capital Market Revenue Million Forecast, by Country 2020 & 2033
- Table 31: Turkey MEA Venture Capital Market Revenue (Million) Forecast, by Application 2020 & 2033
- Table 32: Israel MEA Venture Capital Market Revenue (Million) Forecast, by Application 2020 & 2033
- Table 33: GCC MEA Venture Capital Market Revenue (Million) Forecast, by Application 2020 & 2033
- Table 34: North Africa MEA Venture Capital Market Revenue (Million) Forecast, by Application 2020 & 2033
- Table 35: South Africa MEA Venture Capital Market Revenue (Million) Forecast, by Application 2020 & 2033
- Table 36: Rest of Middle East & Africa MEA Venture Capital Market Revenue (Million) Forecast, by Application 2020 & 2033
- Table 37: Global MEA Venture Capital Market Revenue Million Forecast, by Type 2020 & 2033
- Table 38: Global MEA Venture Capital Market Revenue Million Forecast, by Industry 2020 & 2033
- Table 39: Global MEA Venture Capital Market Revenue Million Forecast, by Country 2020 & 2033
- Table 40: China MEA Venture Capital Market Revenue (Million) Forecast, by Application 2020 & 2033
- Table 41: India MEA Venture Capital Market Revenue (Million) Forecast, by Application 2020 & 2033
- Table 42: Japan MEA Venture Capital Market Revenue (Million) Forecast, by Application 2020 & 2033
- Table 43: South Korea MEA Venture Capital Market Revenue (Million) Forecast, by Application 2020 & 2033
- Table 44: ASEAN MEA Venture Capital Market Revenue (Million) Forecast, by Application 2020 & 2033
- Table 45: Oceania MEA Venture Capital Market Revenue (Million) Forecast, by Application 2020 & 2033
- Table 46: Rest of Asia Pacific MEA Venture Capital Market Revenue (Million) Forecast, by Application 2020 & 2033
Frequently Asked Questions
1. What is the projected Compound Annual Growth Rate (CAGR) of the MEA Venture Capital Market?
The projected CAGR is approximately 10.20%.
2. Which companies are prominent players in the MEA Venture Capital Market?
Key companies in the market include Nuwa Capital, Wamda Capital, Beyond Capital, Phoenician Funds**List Not Exhaustive, Saudi Venture Capital (SVC), Falt6Labs Bahrain, Global ventures, Vision Ventures, Algebra Ventures, 500 Startups.
3. What are the main segments of the MEA Venture Capital Market?
The market segments include Type, Industry.
4. Can you provide details about the market size?
The market size is estimated to be USD 3.53 Million as of 2022.
5. What are some drivers contributing to market growth?
Leading Share of Passenger Vehicles in Car Sales; Quick Processing of Loan through Digital Banking.
6. What are the notable trends driving market growth?
The United Arab Emirates Attracts Higher Investments in the region.
7. Are there any restraints impacting market growth?
Rising Interest Rates Affecting New Auto Buyers Demand for Loan.
8. Can you provide examples of recent developments in the market?
February 2023: Saudi Venture Capital Investment Company launches a USD 1 million income growth fund. The Company launched a close-ended income and capital growth fund - SVC Sukuk Fund.
9. What pricing options are available for accessing the report?
Pricing options include single-user, multi-user, and enterprise licenses priced at USD 4750, USD 4950, and USD 6800 respectively.
10. Is the market size provided in terms of value or volume?
The market size is provided in terms of value, measured in Million.
11. Are there any specific market keywords associated with the report?
Yes, the market keyword associated with the report is "MEA Venture Capital Market," which aids in identifying and referencing the specific market segment covered.
12. How do I determine which pricing option suits my needs best?
The pricing options vary based on user requirements and access needs. Individual users may opt for single-user licenses, while businesses requiring broader access may choose multi-user or enterprise licenses for cost-effective access to the report.
13. Are there any additional resources or data provided in the MEA Venture Capital Market report?
While the report offers comprehensive insights, it's advisable to review the specific contents or supplementary materials provided to ascertain if additional resources or data are available.
14. How can I stay updated on further developments or reports in the MEA Venture Capital Market?
To stay informed about further developments, trends, and reports in the MEA Venture Capital Market, consider subscribing to industry newsletters, following relevant companies and organizations, or regularly checking reputable industry news sources and publications.
Methodology
Step 1 - Identification of Relevant Samples Size from Population Database


Step 2 - Approaches for Defining Global Market Size (Value, Volume* & Price*)

Note*: In applicable scenarios
Step 3 - Data Sources
Primary Research
- Web Analytics
- Survey Reports
- Research Institute
- Latest Research Reports
- Opinion Leaders
Secondary Research
- Annual Reports
- White Paper
- Latest Press Release
- Industry Association
- Paid Database
- Investor Presentations

Step 4 - Data Triangulation
Involves using different sources of information in order to increase the validity of a study
These sources are likely to be stakeholders in a program - participants, other researchers, program staff, other community members, and so on.
Then we put all data in single framework & apply various statistical tools to find out the dynamic on the market.
During the analysis stage, feedback from the stakeholder groups would be compared to determine areas of agreement as well as areas of divergence