

Key Insights
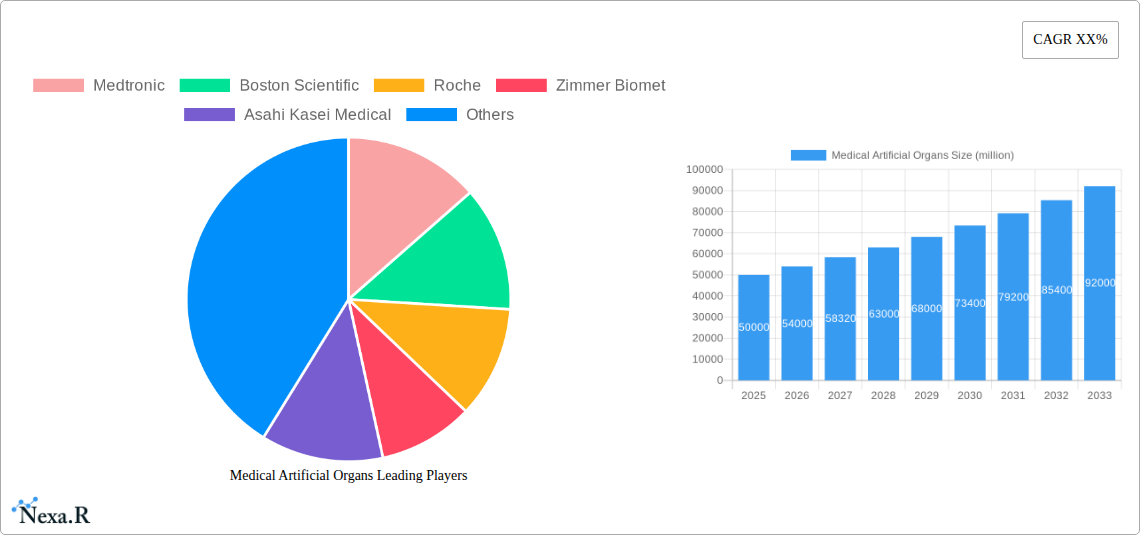
The global medical artificial organs market is experiencing robust growth, driven by increasing prevalence of chronic diseases requiring organ replacement, advancements in biomaterials and surgical techniques, and rising geriatric population. The market, estimated at $50 billion in 2025, is projected to witness a Compound Annual Growth Rate (CAGR) of 8% from 2025 to 2033, reaching approximately $95 billion by 2033. Key drivers include technological innovations leading to improved biocompatibility, durability, and functionality of artificial organs, as well as increased investment in research and development by leading medical device companies. Furthermore, the growing acceptance of minimally invasive surgical procedures and rising demand for personalized medicine are contributing to market expansion. However, high costs associated with artificial organs, stringent regulatory approvals, and potential risks of rejection or complications remain as key restraints.
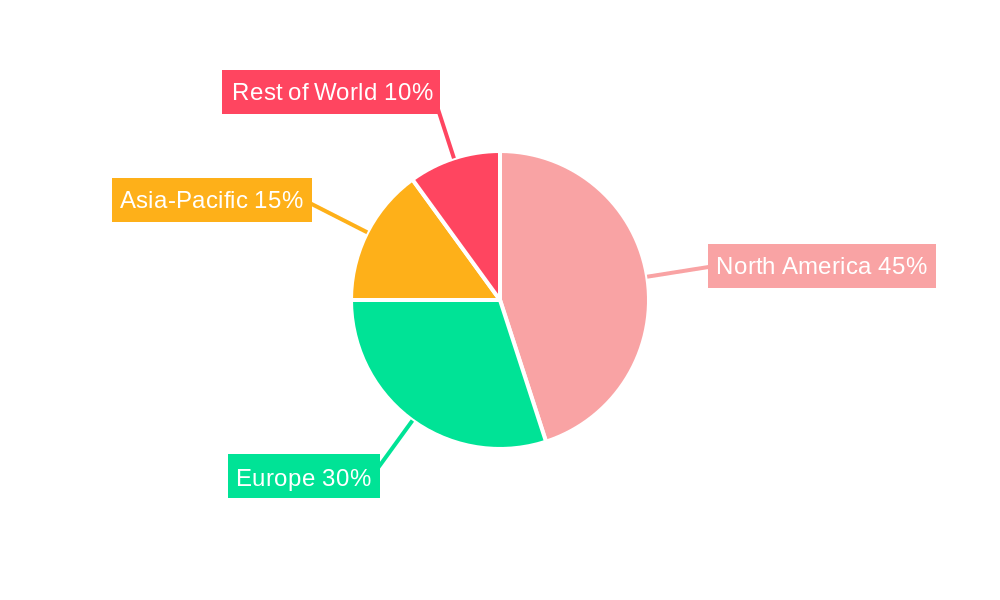
Market segmentation reveals significant opportunities within specific organ types, such as artificial hearts, kidneys, and livers. Companies like Medtronic, Boston Scientific, Roche, and Zimmer Biomet are key players, continuously investing in developing innovative products and expanding their market reach through strategic partnerships and acquisitions. Regional variations exist, with North America and Europe currently dominating the market due to advanced healthcare infrastructure and high adoption rates. However, Asia-Pacific is emerging as a rapidly growing market, driven by increasing healthcare expenditure and rising awareness about the benefits of artificial organ transplantation. Future market growth will be significantly shaped by the ongoing development of bioengineered organs, personalized medicine approaches, and improved access to advanced healthcare in developing nations.
Medical Artificial Organs Market Report: 2019-2033
This comprehensive report provides a detailed analysis of the Medical Artificial Organs market, projecting robust growth from 2025 to 2033. It covers key segments, competitive landscapes, technological advancements, and regional variations, providing actionable insights for industry professionals, investors, and stakeholders. The report leverages extensive data analysis and expert forecasts, covering the historical period (2019-2024), the base year (2025), and the forecast period (2025-2033). The total market size in 2025 is estimated at $xx billion.
Keywords: Medical Artificial Organs, Artificial Organs Market, Medical Devices Market, Bioartificial Organs, Artificial Heart, Artificial Kidney, Artificial Liver, Medtronic, Boston Scientific, Roche, Market Size, Market Share, Market Growth, CAGR, Market Analysis, Industry Trends, Competitive Landscape, Regulatory Landscape.
Medical Artificial Organs Market Dynamics & Structure
The Medical Artificial Organs market exhibits a moderately concentrated structure, dominated by a handful of multinational corporations like Medtronic, Boston Scientific, and Roche. However, smaller specialized players are emerging, introducing innovative solutions. Technological innovation is a crucial driver, with ongoing R&D efforts focused on biocompatibility, miniaturization, and improved functionality. Stringent regulatory frameworks, particularly concerning safety and efficacy, significantly influence market dynamics. The market faces competition from alternative therapies and evolving treatment paradigms. The end-user demographic comprises a growing aging population with chronic diseases, necessitating organ replacement therapies. M&A activity has been moderate, with strategic acquisitions aimed at expanding product portfolios and market reach.
- Market Concentration: Moderately concentrated, with top 5 players holding xx% market share in 2025.
- Technological Drivers: Bioprinting, nanotechnology, advanced materials, AI-driven diagnostics.
- Regulatory Frameworks: Stringent approvals (e.g., FDA, EMA) impacting time to market and cost.
- Competitive Substitutes: Dialysis, organ transplantation, pharmaceutical interventions.
- M&A Activity: xx deals recorded between 2019-2024, with an average deal value of $xx million.
- Innovation Barriers: High R&D costs, stringent regulatory hurdles, ethical considerations.
Medical Artificial Organs Growth Trends & Insights
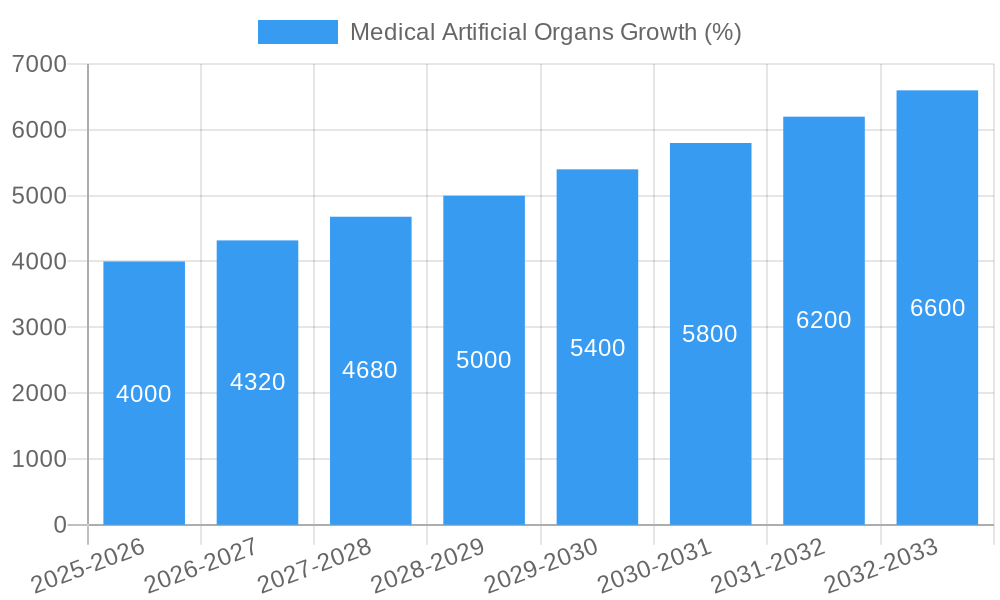
The Medical Artificial Organs market is poised for significant expansion, driven by increasing prevalence of chronic diseases, technological advancements, and rising healthcare expenditure. The market is projected to experience a CAGR of xx% from 2025 to 2033, reaching an estimated size of $xx billion by 2033. Adoption rates are influenced by factors such as improved device performance, reduced costs, and increased patient awareness. Technological disruptions, like the integration of AI and personalized medicine, are reshaping the landscape. Consumer behavior is shifting towards minimally invasive procedures and improved patient outcomes. Market penetration is expected to increase significantly in developing economies due to rising disposable income and improved healthcare infrastructure. Specific segment growth rates vary; for example, the artificial heart segment is predicted to grow at a CAGR of xx%, while artificial kidney is at xx%.
Dominant Regions, Countries, or Segments in Medical Artificial Organs
North America currently holds the largest market share, driven by high healthcare expenditure, advanced healthcare infrastructure, and a significant patient pool. However, Asia Pacific is projected to witness the fastest growth due to rapidly expanding healthcare infrastructure, increasing prevalence of chronic diseases, and growing disposable incomes. Within North America, the US dominates, owing to its robust healthcare system and high adoption rates of advanced medical devices. Specific segments, such as artificial heart valves and pacemakers, also experience heightened demand in developed regions, while developing regions are witnessing a surge in demand for artificial kidneys.
- North America: High healthcare expenditure, advanced infrastructure, high adoption rates.
- Europe: Well-established healthcare systems, strong regulatory framework, significant market size.
- Asia Pacific: Rapid growth driven by increasing healthcare expenditure and prevalence of chronic diseases.
- Rest of the World: Moderate growth potential, opportunities in emerging markets.
Medical Artificial Organs Product Landscape
The Medical Artificial Organs market encompasses a diverse range of products, including artificial hearts, kidneys, livers, lungs, and related components. Innovations focus on biocompatible materials, miniaturization, improved durability, and enhanced functionality. Key advancements include the development of bioartificial organs, incorporating living cells for improved integration and performance. The unique selling propositions often revolve around improved patient outcomes, minimized invasiveness, and enhanced longevity.
Key Drivers, Barriers & Challenges in Medical Artificial Organs
Key Drivers:
- Increasing prevalence of chronic diseases requiring organ replacement.
- Technological advancements improving device performance and longevity.
- Rising healthcare expenditure and insurance coverage.
- Growing geriatric population.
Key Challenges & Restraints:
- High manufacturing costs and pricing pressures.
- Stringent regulatory approvals and compliance requirements.
- Limited reimbursement coverage in some regions.
- Potential risks associated with device implantation and long-term usage.
- Supply chain disruptions impacting material availability and production.
Emerging Opportunities in Medical Artificial Organs
- Development of bio-artificial organs leveraging stem cell technology.
- Personalized medicine and organ fabrication.
- Expansion into emerging markets with unmet medical needs.
- Integration of AI and machine learning for improved diagnosis and treatment.
- Development of minimally invasive implantation techniques.
Growth Accelerators in the Medical Artificial Organs Industry
Technological breakthroughs, strategic collaborations, and market expansion strategies are key growth accelerators. Advancements in biomaterials and manufacturing techniques are lowering costs and enhancing device performance. Strategic partnerships between medical device companies and research institutions foster innovation. Expanding into underserved markets in developing economies provides significant growth opportunities.
Key Players Shaping the Medical Artificial Organs Market
- Medtronic
- Boston Scientific
- Roche
- Zimmer Biomet
- Asahi Kasei Medical
- Baxter International
- Abiomed
- Berlin Heart
- Thoratec
- Gambro AB
- Jarvik Heart
Notable Milestones in Medical Artificial Organs Sector
- 2020: FDA approval of a new generation of artificial heart valve.
- 2022: Launch of a bio-printed kidney prototype by a major research institute.
- 2023: Merger between two key players in the artificial liver segment resulting in expanded market reach.
- 2024: Successful clinical trials of a new biocompatible material for artificial organs.
In-Depth Medical Artificial Organs Market Outlook
The Medical Artificial Organs market anticipates continued robust growth, driven by technological advancements, increasing prevalence of chronic diseases, and expanding healthcare infrastructure globally. Strategic partnerships, focused R&D investments, and expansion into emerging markets represent significant opportunities for market players. The forecast period will witness significant innovation in bio-artificial organs and personalized medicine, enhancing patient outcomes and further driving market expansion.
Medical Artificial Organs Segmentation
-
1. Application
- 1.1. Hospitals
- 1.2. Clinical Research Institutions
- 1.3. Others
-
2. Types
- 2.1. Artificial Throat
- 2.2. Artificial Skin
- 2.3. Artificial Cornea
Medical Artificial Organs Segmentation By Geography
-
1. North America
- 1.1. United States
- 1.2. Canada
- 1.3. Mexico
-
2. South America
- 2.1. Brazil
- 2.2. Argentina
- 2.3. Rest of South America
-
3. Europe
- 3.1. United Kingdom
- 3.2. Germany
- 3.3. France
- 3.4. Italy
- 3.5. Spain
- 3.6. Russia
- 3.7. Benelux
- 3.8. Nordics
- 3.9. Rest of Europe
-
4. Middle East & Africa
- 4.1. Turkey
- 4.2. Israel
- 4.3. GCC
- 4.4. North Africa
- 4.5. South Africa
- 4.6. Rest of Middle East & Africa
-
5. Asia Pacific
- 5.1. China
- 5.2. India
- 5.3. Japan
- 5.4. South Korea
- 5.5. ASEAN
- 5.6. Oceania
- 5.7. Rest of Asia Pacific
Medical Artificial Organs REPORT HIGHLIGHTS
| Aspects | Details |
|---|---|
| Study Period | 2019-2033 |
| Base Year | 2024 |
| Estimated Year | 2025 |
| Forecast Period | 2025-2033 |
| Historical Period | 2019-2024 |
| Growth Rate | CAGR of XX% from 2019-2033 |
| Segmentation |
|
Table of Contents
- 1. Introduction
- 1.1. Research Scope
- 1.2. Market Segmentation
- 1.3. Research Methodology
- 1.4. Definitions and Assumptions
- 2. Executive Summary
- 2.1. Introduction
- 3. Market Dynamics
- 3.1. Introduction
- 3.2. Market Drivers
- 3.3. Market Restrains
- 3.4. Market Trends
- 4. Market Factor Analysis
- 4.1. Porters Five Forces
- 4.2. Supply/Value Chain
- 4.3. PESTEL analysis
- 4.4. Market Entropy
- 4.5. Patent/Trademark Analysis
- 5. Global Medical Artificial Organs Analysis, Insights and Forecast, 2019-2031
- 5.1. Market Analysis, Insights and Forecast - by Application
- 5.1.1. Hospitals
- 5.1.2. Clinical Research Institutions
- 5.1.3. Others
- 5.2. Market Analysis, Insights and Forecast - by Types
- 5.2.1. Artificial Throat
- 5.2.2. Artificial Skin
- 5.2.3. Artificial Cornea
- 5.3. Market Analysis, Insights and Forecast - by Region
- 5.3.1. North America
- 5.3.2. South America
- 5.3.3. Europe
- 5.3.4. Middle East & Africa
- 5.3.5. Asia Pacific
- 5.1. Market Analysis, Insights and Forecast - by Application
- 6. North America Medical Artificial Organs Analysis, Insights and Forecast, 2019-2031
- 6.1. Market Analysis, Insights and Forecast - by Application
- 6.1.1. Hospitals
- 6.1.2. Clinical Research Institutions
- 6.1.3. Others
- 6.2. Market Analysis, Insights and Forecast - by Types
- 6.2.1. Artificial Throat
- 6.2.2. Artificial Skin
- 6.2.3. Artificial Cornea
- 6.1. Market Analysis, Insights and Forecast - by Application
- 7. South America Medical Artificial Organs Analysis, Insights and Forecast, 2019-2031
- 7.1. Market Analysis, Insights and Forecast - by Application
- 7.1.1. Hospitals
- 7.1.2. Clinical Research Institutions
- 7.1.3. Others
- 7.2. Market Analysis, Insights and Forecast - by Types
- 7.2.1. Artificial Throat
- 7.2.2. Artificial Skin
- 7.2.3. Artificial Cornea
- 7.1. Market Analysis, Insights and Forecast - by Application
- 8. Europe Medical Artificial Organs Analysis, Insights and Forecast, 2019-2031
- 8.1. Market Analysis, Insights and Forecast - by Application
- 8.1.1. Hospitals
- 8.1.2. Clinical Research Institutions
- 8.1.3. Others
- 8.2. Market Analysis, Insights and Forecast - by Types
- 8.2.1. Artificial Throat
- 8.2.2. Artificial Skin
- 8.2.3. Artificial Cornea
- 8.1. Market Analysis, Insights and Forecast - by Application
- 9. Middle East & Africa Medical Artificial Organs Analysis, Insights and Forecast, 2019-2031
- 9.1. Market Analysis, Insights and Forecast - by Application
- 9.1.1. Hospitals
- 9.1.2. Clinical Research Institutions
- 9.1.3. Others
- 9.2. Market Analysis, Insights and Forecast - by Types
- 9.2.1. Artificial Throat
- 9.2.2. Artificial Skin
- 9.2.3. Artificial Cornea
- 9.1. Market Analysis, Insights and Forecast - by Application
- 10. Asia Pacific Medical Artificial Organs Analysis, Insights and Forecast, 2019-2031
- 10.1. Market Analysis, Insights and Forecast - by Application
- 10.1.1. Hospitals
- 10.1.2. Clinical Research Institutions
- 10.1.3. Others
- 10.2. Market Analysis, Insights and Forecast - by Types
- 10.2.1. Artificial Throat
- 10.2.2. Artificial Skin
- 10.2.3. Artificial Cornea
- 10.1. Market Analysis, Insights and Forecast - by Application
- 11. Competitive Analysis
- 11.1. Global Market Share Analysis 2024
- 11.2. Company Profiles
- 11.2.1 Medtronic
- 11.2.1.1. Overview
- 11.2.1.2. Products
- 11.2.1.3. SWOT Analysis
- 11.2.1.4. Recent Developments
- 11.2.1.5. Financials (Based on Availability)
- 11.2.2 Boston Scientific
- 11.2.2.1. Overview
- 11.2.2.2. Products
- 11.2.2.3. SWOT Analysis
- 11.2.2.4. Recent Developments
- 11.2.2.5. Financials (Based on Availability)
- 11.2.3 Roche
- 11.2.3.1. Overview
- 11.2.3.2. Products
- 11.2.3.3. SWOT Analysis
- 11.2.3.4. Recent Developments
- 11.2.3.5. Financials (Based on Availability)
- 11.2.4 Zimmer Biomet
- 11.2.4.1. Overview
- 11.2.4.2. Products
- 11.2.4.3. SWOT Analysis
- 11.2.4.4. Recent Developments
- 11.2.4.5. Financials (Based on Availability)
- 11.2.5 Asahi Kasei Medical
- 11.2.5.1. Overview
- 11.2.5.2. Products
- 11.2.5.3. SWOT Analysis
- 11.2.5.4. Recent Developments
- 11.2.5.5. Financials (Based on Availability)
- 11.2.6 Baxter International
- 11.2.6.1. Overview
- 11.2.6.2. Products
- 11.2.6.3. SWOT Analysis
- 11.2.6.4. Recent Developments
- 11.2.6.5. Financials (Based on Availability)
- 11.2.7 Abiomed
- 11.2.7.1. Overview
- 11.2.7.2. Products
- 11.2.7.3. SWOT Analysis
- 11.2.7.4. Recent Developments
- 11.2.7.5. Financials (Based on Availability)
- 11.2.8 Berlin Heart
- 11.2.8.1. Overview
- 11.2.8.2. Products
- 11.2.8.3. SWOT Analysis
- 11.2.8.4. Recent Developments
- 11.2.8.5. Financials (Based on Availability)
- 11.2.9 Thoratec
- 11.2.9.1. Overview
- 11.2.9.2. Products
- 11.2.9.3. SWOT Analysis
- 11.2.9.4. Recent Developments
- 11.2.9.5. Financials (Based on Availability)
- 11.2.10 Gambro AB
- 11.2.10.1. Overview
- 11.2.10.2. Products
- 11.2.10.3. SWOT Analysis
- 11.2.10.4. Recent Developments
- 11.2.10.5. Financials (Based on Availability)
- 11.2.11 Jarvik Heart
- 11.2.11.1. Overview
- 11.2.11.2. Products
- 11.2.11.3. SWOT Analysis
- 11.2.11.4. Recent Developments
- 11.2.11.5. Financials (Based on Availability)
- 11.2.1 Medtronic
List of Figures
- Figure 1: Global Medical Artificial Organs Revenue Breakdown (million, %) by Region 2024 & 2032
- Figure 2: Global Medical Artificial Organs Volume Breakdown (K, %) by Region 2024 & 2032
- Figure 3: North America Medical Artificial Organs Revenue (million), by Application 2024 & 2032
- Figure 4: North America Medical Artificial Organs Volume (K), by Application 2024 & 2032
- Figure 5: North America Medical Artificial Organs Revenue Share (%), by Application 2024 & 2032
- Figure 6: North America Medical Artificial Organs Volume Share (%), by Application 2024 & 2032
- Figure 7: North America Medical Artificial Organs Revenue (million), by Types 2024 & 2032
- Figure 8: North America Medical Artificial Organs Volume (K), by Types 2024 & 2032
- Figure 9: North America Medical Artificial Organs Revenue Share (%), by Types 2024 & 2032
- Figure 10: North America Medical Artificial Organs Volume Share (%), by Types 2024 & 2032
- Figure 11: North America Medical Artificial Organs Revenue (million), by Country 2024 & 2032
- Figure 12: North America Medical Artificial Organs Volume (K), by Country 2024 & 2032
- Figure 13: North America Medical Artificial Organs Revenue Share (%), by Country 2024 & 2032
- Figure 14: North America Medical Artificial Organs Volume Share (%), by Country 2024 & 2032
- Figure 15: South America Medical Artificial Organs Revenue (million), by Application 2024 & 2032
- Figure 16: South America Medical Artificial Organs Volume (K), by Application 2024 & 2032
- Figure 17: South America Medical Artificial Organs Revenue Share (%), by Application 2024 & 2032
- Figure 18: South America Medical Artificial Organs Volume Share (%), by Application 2024 & 2032
- Figure 19: South America Medical Artificial Organs Revenue (million), by Types 2024 & 2032
- Figure 20: South America Medical Artificial Organs Volume (K), by Types 2024 & 2032
- Figure 21: South America Medical Artificial Organs Revenue Share (%), by Types 2024 & 2032
- Figure 22: South America Medical Artificial Organs Volume Share (%), by Types 2024 & 2032
- Figure 23: South America Medical Artificial Organs Revenue (million), by Country 2024 & 2032
- Figure 24: South America Medical Artificial Organs Volume (K), by Country 2024 & 2032
- Figure 25: South America Medical Artificial Organs Revenue Share (%), by Country 2024 & 2032
- Figure 26: South America Medical Artificial Organs Volume Share (%), by Country 2024 & 2032
- Figure 27: Europe Medical Artificial Organs Revenue (million), by Application 2024 & 2032
- Figure 28: Europe Medical Artificial Organs Volume (K), by Application 2024 & 2032
- Figure 29: Europe Medical Artificial Organs Revenue Share (%), by Application 2024 & 2032
- Figure 30: Europe Medical Artificial Organs Volume Share (%), by Application 2024 & 2032
- Figure 31: Europe Medical Artificial Organs Revenue (million), by Types 2024 & 2032
- Figure 32: Europe Medical Artificial Organs Volume (K), by Types 2024 & 2032
- Figure 33: Europe Medical Artificial Organs Revenue Share (%), by Types 2024 & 2032
- Figure 34: Europe Medical Artificial Organs Volume Share (%), by Types 2024 & 2032
- Figure 35: Europe Medical Artificial Organs Revenue (million), by Country 2024 & 2032
- Figure 36: Europe Medical Artificial Organs Volume (K), by Country 2024 & 2032
- Figure 37: Europe Medical Artificial Organs Revenue Share (%), by Country 2024 & 2032
- Figure 38: Europe Medical Artificial Organs Volume Share (%), by Country 2024 & 2032
- Figure 39: Middle East & Africa Medical Artificial Organs Revenue (million), by Application 2024 & 2032
- Figure 40: Middle East & Africa Medical Artificial Organs Volume (K), by Application 2024 & 2032
- Figure 41: Middle East & Africa Medical Artificial Organs Revenue Share (%), by Application 2024 & 2032
- Figure 42: Middle East & Africa Medical Artificial Organs Volume Share (%), by Application 2024 & 2032
- Figure 43: Middle East & Africa Medical Artificial Organs Revenue (million), by Types 2024 & 2032
- Figure 44: Middle East & Africa Medical Artificial Organs Volume (K), by Types 2024 & 2032
- Figure 45: Middle East & Africa Medical Artificial Organs Revenue Share (%), by Types 2024 & 2032
- Figure 46: Middle East & Africa Medical Artificial Organs Volume Share (%), by Types 2024 & 2032
- Figure 47: Middle East & Africa Medical Artificial Organs Revenue (million), by Country 2024 & 2032
- Figure 48: Middle East & Africa Medical Artificial Organs Volume (K), by Country 2024 & 2032
- Figure 49: Middle East & Africa Medical Artificial Organs Revenue Share (%), by Country 2024 & 2032
- Figure 50: Middle East & Africa Medical Artificial Organs Volume Share (%), by Country 2024 & 2032
- Figure 51: Asia Pacific Medical Artificial Organs Revenue (million), by Application 2024 & 2032
- Figure 52: Asia Pacific Medical Artificial Organs Volume (K), by Application 2024 & 2032
- Figure 53: Asia Pacific Medical Artificial Organs Revenue Share (%), by Application 2024 & 2032
- Figure 54: Asia Pacific Medical Artificial Organs Volume Share (%), by Application 2024 & 2032
- Figure 55: Asia Pacific Medical Artificial Organs Revenue (million), by Types 2024 & 2032
- Figure 56: Asia Pacific Medical Artificial Organs Volume (K), by Types 2024 & 2032
- Figure 57: Asia Pacific Medical Artificial Organs Revenue Share (%), by Types 2024 & 2032
- Figure 58: Asia Pacific Medical Artificial Organs Volume Share (%), by Types 2024 & 2032
- Figure 59: Asia Pacific Medical Artificial Organs Revenue (million), by Country 2024 & 2032
- Figure 60: Asia Pacific Medical Artificial Organs Volume (K), by Country 2024 & 2032
- Figure 61: Asia Pacific Medical Artificial Organs Revenue Share (%), by Country 2024 & 2032
- Figure 62: Asia Pacific Medical Artificial Organs Volume Share (%), by Country 2024 & 2032
List of Tables
- Table 1: Global Medical Artificial Organs Revenue million Forecast, by Region 2019 & 2032
- Table 2: Global Medical Artificial Organs Volume K Forecast, by Region 2019 & 2032
- Table 3: Global Medical Artificial Organs Revenue million Forecast, by Application 2019 & 2032
- Table 4: Global Medical Artificial Organs Volume K Forecast, by Application 2019 & 2032
- Table 5: Global Medical Artificial Organs Revenue million Forecast, by Types 2019 & 2032
- Table 6: Global Medical Artificial Organs Volume K Forecast, by Types 2019 & 2032
- Table 7: Global Medical Artificial Organs Revenue million Forecast, by Region 2019 & 2032
- Table 8: Global Medical Artificial Organs Volume K Forecast, by Region 2019 & 2032
- Table 9: Global Medical Artificial Organs Revenue million Forecast, by Application 2019 & 2032
- Table 10: Global Medical Artificial Organs Volume K Forecast, by Application 2019 & 2032
- Table 11: Global Medical Artificial Organs Revenue million Forecast, by Types 2019 & 2032
- Table 12: Global Medical Artificial Organs Volume K Forecast, by Types 2019 & 2032
- Table 13: Global Medical Artificial Organs Revenue million Forecast, by Country 2019 & 2032
- Table 14: Global Medical Artificial Organs Volume K Forecast, by Country 2019 & 2032
- Table 15: United States Medical Artificial Organs Revenue (million) Forecast, by Application 2019 & 2032
- Table 16: United States Medical Artificial Organs Volume (K) Forecast, by Application 2019 & 2032
- Table 17: Canada Medical Artificial Organs Revenue (million) Forecast, by Application 2019 & 2032
- Table 18: Canada Medical Artificial Organs Volume (K) Forecast, by Application 2019 & 2032
- Table 19: Mexico Medical Artificial Organs Revenue (million) Forecast, by Application 2019 & 2032
- Table 20: Mexico Medical Artificial Organs Volume (K) Forecast, by Application 2019 & 2032
- Table 21: Global Medical Artificial Organs Revenue million Forecast, by Application 2019 & 2032
- Table 22: Global Medical Artificial Organs Volume K Forecast, by Application 2019 & 2032
- Table 23: Global Medical Artificial Organs Revenue million Forecast, by Types 2019 & 2032
- Table 24: Global Medical Artificial Organs Volume K Forecast, by Types 2019 & 2032
- Table 25: Global Medical Artificial Organs Revenue million Forecast, by Country 2019 & 2032
- Table 26: Global Medical Artificial Organs Volume K Forecast, by Country 2019 & 2032
- Table 27: Brazil Medical Artificial Organs Revenue (million) Forecast, by Application 2019 & 2032
- Table 28: Brazil Medical Artificial Organs Volume (K) Forecast, by Application 2019 & 2032
- Table 29: Argentina Medical Artificial Organs Revenue (million) Forecast, by Application 2019 & 2032
- Table 30: Argentina Medical Artificial Organs Volume (K) Forecast, by Application 2019 & 2032
- Table 31: Rest of South America Medical Artificial Organs Revenue (million) Forecast, by Application 2019 & 2032
- Table 32: Rest of South America Medical Artificial Organs Volume (K) Forecast, by Application 2019 & 2032
- Table 33: Global Medical Artificial Organs Revenue million Forecast, by Application 2019 & 2032
- Table 34: Global Medical Artificial Organs Volume K Forecast, by Application 2019 & 2032
- Table 35: Global Medical Artificial Organs Revenue million Forecast, by Types 2019 & 2032
- Table 36: Global Medical Artificial Organs Volume K Forecast, by Types 2019 & 2032
- Table 37: Global Medical Artificial Organs Revenue million Forecast, by Country 2019 & 2032
- Table 38: Global Medical Artificial Organs Volume K Forecast, by Country 2019 & 2032
- Table 39: United Kingdom Medical Artificial Organs Revenue (million) Forecast, by Application 2019 & 2032
- Table 40: United Kingdom Medical Artificial Organs Volume (K) Forecast, by Application 2019 & 2032
- Table 41: Germany Medical Artificial Organs Revenue (million) Forecast, by Application 2019 & 2032
- Table 42: Germany Medical Artificial Organs Volume (K) Forecast, by Application 2019 & 2032
- Table 43: France Medical Artificial Organs Revenue (million) Forecast, by Application 2019 & 2032
- Table 44: France Medical Artificial Organs Volume (K) Forecast, by Application 2019 & 2032
- Table 45: Italy Medical Artificial Organs Revenue (million) Forecast, by Application 2019 & 2032
- Table 46: Italy Medical Artificial Organs Volume (K) Forecast, by Application 2019 & 2032
- Table 47: Spain Medical Artificial Organs Revenue (million) Forecast, by Application 2019 & 2032
- Table 48: Spain Medical Artificial Organs Volume (K) Forecast, by Application 2019 & 2032
- Table 49: Russia Medical Artificial Organs Revenue (million) Forecast, by Application 2019 & 2032
- Table 50: Russia Medical Artificial Organs Volume (K) Forecast, by Application 2019 & 2032
- Table 51: Benelux Medical Artificial Organs Revenue (million) Forecast, by Application 2019 & 2032
- Table 52: Benelux Medical Artificial Organs Volume (K) Forecast, by Application 2019 & 2032
- Table 53: Nordics Medical Artificial Organs Revenue (million) Forecast, by Application 2019 & 2032
- Table 54: Nordics Medical Artificial Organs Volume (K) Forecast, by Application 2019 & 2032
- Table 55: Rest of Europe Medical Artificial Organs Revenue (million) Forecast, by Application 2019 & 2032
- Table 56: Rest of Europe Medical Artificial Organs Volume (K) Forecast, by Application 2019 & 2032
- Table 57: Global Medical Artificial Organs Revenue million Forecast, by Application 2019 & 2032
- Table 58: Global Medical Artificial Organs Volume K Forecast, by Application 2019 & 2032
- Table 59: Global Medical Artificial Organs Revenue million Forecast, by Types 2019 & 2032
- Table 60: Global Medical Artificial Organs Volume K Forecast, by Types 2019 & 2032
- Table 61: Global Medical Artificial Organs Revenue million Forecast, by Country 2019 & 2032
- Table 62: Global Medical Artificial Organs Volume K Forecast, by Country 2019 & 2032
- Table 63: Turkey Medical Artificial Organs Revenue (million) Forecast, by Application 2019 & 2032
- Table 64: Turkey Medical Artificial Organs Volume (K) Forecast, by Application 2019 & 2032
- Table 65: Israel Medical Artificial Organs Revenue (million) Forecast, by Application 2019 & 2032
- Table 66: Israel Medical Artificial Organs Volume (K) Forecast, by Application 2019 & 2032
- Table 67: GCC Medical Artificial Organs Revenue (million) Forecast, by Application 2019 & 2032
- Table 68: GCC Medical Artificial Organs Volume (K) Forecast, by Application 2019 & 2032
- Table 69: North Africa Medical Artificial Organs Revenue (million) Forecast, by Application 2019 & 2032
- Table 70: North Africa Medical Artificial Organs Volume (K) Forecast, by Application 2019 & 2032
- Table 71: South Africa Medical Artificial Organs Revenue (million) Forecast, by Application 2019 & 2032
- Table 72: South Africa Medical Artificial Organs Volume (K) Forecast, by Application 2019 & 2032
- Table 73: Rest of Middle East & Africa Medical Artificial Organs Revenue (million) Forecast, by Application 2019 & 2032
- Table 74: Rest of Middle East & Africa Medical Artificial Organs Volume (K) Forecast, by Application 2019 & 2032
- Table 75: Global Medical Artificial Organs Revenue million Forecast, by Application 2019 & 2032
- Table 76: Global Medical Artificial Organs Volume K Forecast, by Application 2019 & 2032
- Table 77: Global Medical Artificial Organs Revenue million Forecast, by Types 2019 & 2032
- Table 78: Global Medical Artificial Organs Volume K Forecast, by Types 2019 & 2032
- Table 79: Global Medical Artificial Organs Revenue million Forecast, by Country 2019 & 2032
- Table 80: Global Medical Artificial Organs Volume K Forecast, by Country 2019 & 2032
- Table 81: China Medical Artificial Organs Revenue (million) Forecast, by Application 2019 & 2032
- Table 82: China Medical Artificial Organs Volume (K) Forecast, by Application 2019 & 2032
- Table 83: India Medical Artificial Organs Revenue (million) Forecast, by Application 2019 & 2032
- Table 84: India Medical Artificial Organs Volume (K) Forecast, by Application 2019 & 2032
- Table 85: Japan Medical Artificial Organs Revenue (million) Forecast, by Application 2019 & 2032
- Table 86: Japan Medical Artificial Organs Volume (K) Forecast, by Application 2019 & 2032
- Table 87: South Korea Medical Artificial Organs Revenue (million) Forecast, by Application 2019 & 2032
- Table 88: South Korea Medical Artificial Organs Volume (K) Forecast, by Application 2019 & 2032
- Table 89: ASEAN Medical Artificial Organs Revenue (million) Forecast, by Application 2019 & 2032
- Table 90: ASEAN Medical Artificial Organs Volume (K) Forecast, by Application 2019 & 2032
- Table 91: Oceania Medical Artificial Organs Revenue (million) Forecast, by Application 2019 & 2032
- Table 92: Oceania Medical Artificial Organs Volume (K) Forecast, by Application 2019 & 2032
- Table 93: Rest of Asia Pacific Medical Artificial Organs Revenue (million) Forecast, by Application 2019 & 2032
- Table 94: Rest of Asia Pacific Medical Artificial Organs Volume (K) Forecast, by Application 2019 & 2032
Frequently Asked Questions
1. What is the projected Compound Annual Growth Rate (CAGR) of the Medical Artificial Organs?
The projected CAGR is approximately XX%.
2. Which companies are prominent players in the Medical Artificial Organs?
Key companies in the market include Medtronic, Boston Scientific, Roche, Zimmer Biomet, Asahi Kasei Medical, Baxter International, Abiomed, Berlin Heart, Thoratec, Gambro AB, Jarvik Heart.
3. What are the main segments of the Medical Artificial Organs?
The market segments include Application, Types.
4. Can you provide details about the market size?
The market size is estimated to be USD XXX million as of 2022.
5. What are some drivers contributing to market growth?
N/A
6. What are the notable trends driving market growth?
N/A
7. Are there any restraints impacting market growth?
N/A
8. Can you provide examples of recent developments in the market?
N/A
9. What pricing options are available for accessing the report?
Pricing options include single-user, multi-user, and enterprise licenses priced at USD 3950.00, USD 5925.00, and USD 7900.00 respectively.
10. Is the market size provided in terms of value or volume?
The market size is provided in terms of value, measured in million and volume, measured in K.
11. Are there any specific market keywords associated with the report?
Yes, the market keyword associated with the report is "Medical Artificial Organs," which aids in identifying and referencing the specific market segment covered.
12. How do I determine which pricing option suits my needs best?
The pricing options vary based on user requirements and access needs. Individual users may opt for single-user licenses, while businesses requiring broader access may choose multi-user or enterprise licenses for cost-effective access to the report.
13. Are there any additional resources or data provided in the Medical Artificial Organs report?
While the report offers comprehensive insights, it's advisable to review the specific contents or supplementary materials provided to ascertain if additional resources or data are available.
14. How can I stay updated on further developments or reports in the Medical Artificial Organs?
To stay informed about further developments, trends, and reports in the Medical Artificial Organs, consider subscribing to industry newsletters, following relevant companies and organizations, or regularly checking reputable industry news sources and publications.
Methodology
Step 1 - Identification of Relevant Samples Size from Population Database


Step 2 - Approaches for Defining Global Market Size (Value, Volume* & Price*)

Note*: In applicable scenarios
Step 3 - Data Sources
Primary Research
- Web Analytics
- Survey Reports
- Research Institute
- Latest Research Reports
- Opinion Leaders
Secondary Research
- Annual Reports
- White Paper
- Latest Press Release
- Industry Association
- Paid Database
- Investor Presentations

Step 4 - Data Triangulation
Involves using different sources of information in order to increase the validity of a study
These sources are likely to be stakeholders in a program - participants, other researchers, program staff, other community members, and so on.
Then we put all data in single framework & apply various statistical tools to find out the dynamic on the market.
During the analysis stage, feedback from the stakeholder groups would be compared to determine areas of agreement as well as areas of divergence
