

Key Insights
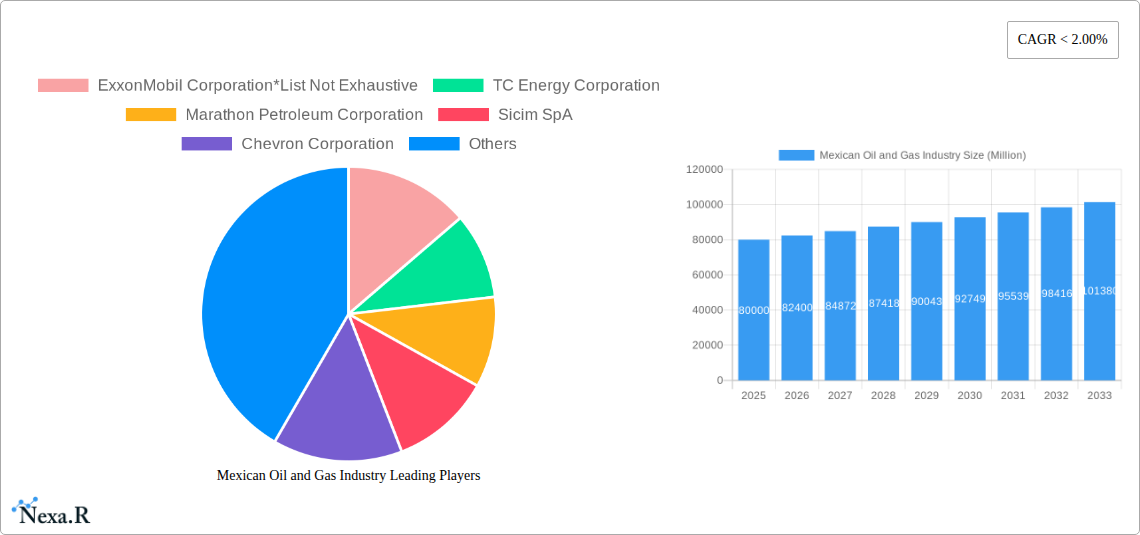
The Mexican oil and gas industry, while historically significant, is undergoing a period of transformation. The industry's size in 2025 is estimated at $80 billion USD, reflecting a complex interplay of factors. While the country boasts substantial reserves, particularly in the prolific Gulf of Mexico, production has fluctuated in recent years due to challenges including aging infrastructure, bureaucratic hurdles, and evolving government policy concerning energy sector privatization. Nevertheless, a moderate Compound Annual Growth Rate (CAGR) of 3% is projected from 2025-2033, driven by increasing domestic demand, potential for foreign investment, and ongoing efforts to modernize the energy sector. This growth, however, is likely to be uneven, with some sectors experiencing faster growth than others. For instance, while exploration and production may see modest increases, the downstream sector, including refining and petrochemicals, could benefit from targeted investments and growing industrialization.
The forecast for the Mexican oil and gas industry hinges on several critical factors. The success of ongoing reforms aimed at improving regulatory efficiency and attracting private capital will significantly influence its trajectory. Furthermore, global oil prices and shifts in demand will play a crucial role in shaping the sector's outlook. Environmental concerns are also gaining traction, necessitating a transition towards cleaner energy sources and more sustainable practices. Successfully navigating these complexities will be key to unlocking the full potential of the Mexican oil and gas industry and ensuring its sustainable growth in the coming decade. The government's commitment to energy independence and its strategy to balance national interests with international collaborations will also play a decisive role in the sector's future.
Mexican Oil and Gas Industry Market Report: 2019-2033
This comprehensive report provides an in-depth analysis of the Mexican oil and gas industry, covering market dynamics, growth trends, key players, and future outlook. With a focus on upstream, midstream, and downstream segments, and encompassing crude oil, natural gas, and petrochemicals, this report is an essential resource for industry professionals, investors, and strategic decision-makers. The study period spans 2019-2033, with a base year of 2025 and a forecast period of 2025-2033.
Mexican Oil and Gas Industry Market Dynamics & Structure
This section analyzes the competitive landscape of the Mexican oil and gas market, examining market concentration, technological innovation, regulatory frameworks, and M&A activity. We delve into the interplay of these factors to provide a comprehensive understanding of the market structure. The analysis considers parent markets (energy sector) and child markets (petrochemicals, natural gas pipelines).
- Market Concentration: Pemex maintains a significant market share (xx%), however, the presence of international players like ExxonMobil and Chevron indicates a moderately consolidated market. The increasing participation of private companies is gradually changing the competitive dynamics.
- Technological Innovation: The industry is witnessing increased adoption of digital technologies like IoT and AI for improved efficiency and reduced operational costs. However, regulatory hurdles and infrastructure limitations hinder rapid technological advancements.
- Regulatory Framework: Mexico's energy sector reforms have opened the market to greater private investment. However, regulatory uncertainty and permitting processes remain challenges.
- Competitive Product Substitutes: Renewable energy sources present growing competition, particularly for electricity generation. The industry is responding by diversifying into cleaner energy solutions.
- End-User Demographics: The primary end-users are industrial sectors, power generation, and transportation. Changes in consumer behavior and industrial demand drive shifts in product demand.
- M&A Trends: The past five years have seen xx million USD in M&A deals, with a focus on midstream and downstream assets. Strategic acquisitions and partnerships are reshaping the market landscape.
Mexican Oil and Gas Industry Growth Trends & Insights
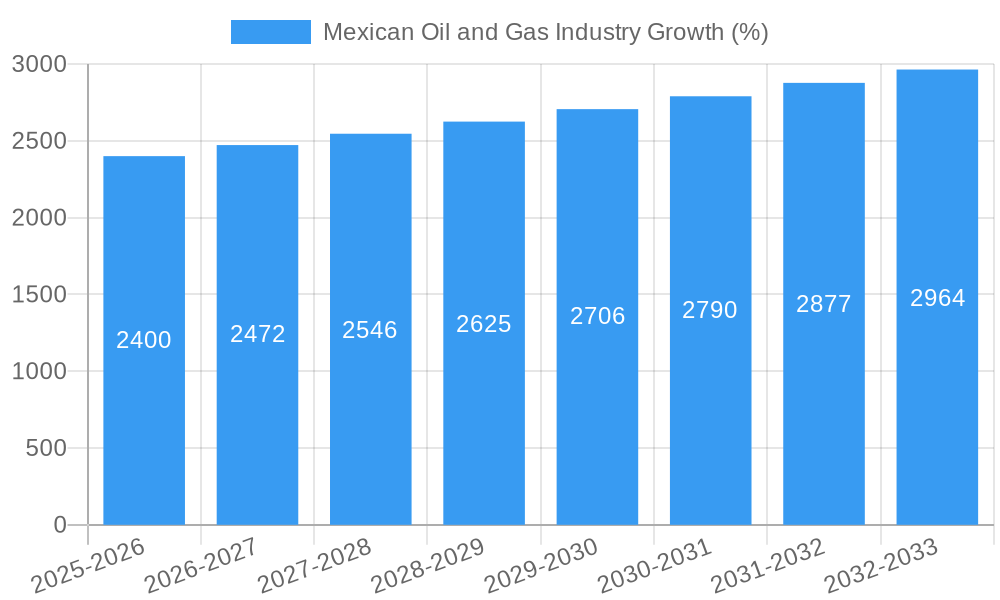
This section provides a detailed analysis of the Mexican oil and gas market's historical and projected growth, using quantitative metrics and qualitative observations. The analysis draws upon various data sources and incorporates expert insights to accurately predict future market trends. The Compound Annual Growth Rate (CAGR) for the forecast period (2025-2033) is estimated at xx%.
- Market size evolution (Million USD): 2019 (xx), 2020 (xx), 2021 (xx), 2022 (xx), 2023 (xx), 2024 (xx), 2025 (xx), 2033 (xx).
- Adoption rates of new technologies: The report details the adoption rates of digital technologies across various segments.
- Technological disruptions: The analysis outlines the impact of technological disruptions and its influence on the competitive landscape.
- Consumer behavior shifts: The report examines changing consumer preferences and their impact on demand for different oil and gas products.
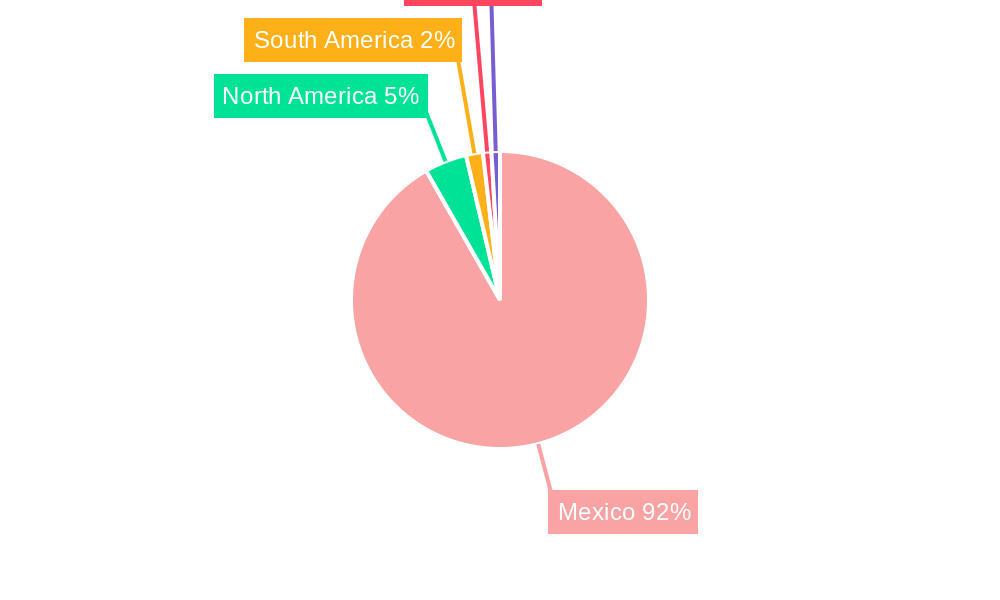
Dominant Regions, Countries, or Segments in Mexican Oil and Gas Industry
This section identifies the leading regions, countries, and segments within the Mexican oil and gas industry that are driving market growth. The analysis considers upstream, midstream, and downstream segments and the key products (Crude Oil, Natural Gas, Petrochemicals).
- Upstream: The Gulf of Mexico remains a dominant region for crude oil extraction. Investment in deepwater exploration and production drives growth.
- Midstream: The development of new pipelines and storage facilities, particularly natural gas infrastructure, is crucial.
- Downstream: The petrochemical segment is showing significant growth potential, driven by increasing demand from the plastics industry.
- Key Drivers:
- Favorable government policies promoting private sector participation.
- Infrastructure development, particularly pipeline expansion.
- Growing domestic demand for oil and gas products.
Mexican Oil and Gas Industry Product Landscape
The Mexican oil and gas industry offers a diverse range of products, including crude oil, natural gas, and various petrochemicals. Innovation focuses on enhancing efficiency, reducing environmental impact, and improving product quality. Technological advancements in refining processes and petrochemical production are leading to the development of new and improved products, with specific emphasis on higher-value-added petrochemicals.
Key Drivers, Barriers & Challenges in Mexican Oil and Gas Industry
This section examines the factors driving growth and the challenges hindering progress in the Mexican oil and gas industry.
Key Drivers:
- Increasing domestic demand for energy.
- Government initiatives to attract foreign investment.
- Technological advancements improving efficiency and reducing costs.
Key Challenges:
- Infrastructure limitations, particularly in pipeline networks.
- Regulatory uncertainty and bureaucratic hurdles.
- Security concerns impacting operations in certain regions.
- Competition from renewable energy sources. The impact is estimated to reduce market growth by xx% by 2033.
Emerging Opportunities in Mexican Oil and Gas Industry
The Mexican oil and gas industry offers several emerging opportunities. These include exploration and production in under-explored regions, expansion of the petrochemical sector, and increased investment in cleaner energy solutions like natural gas and potentially, carbon capture and storage. The industry is also adapting to evolving consumer preferences and focusing on sustainability initiatives.
Growth Accelerators in the Mexican Oil and Gas Industry
Long-term growth in the Mexican oil and gas industry will be driven by continued investment in infrastructure, technological innovation, and strategic partnerships to attract more private investment. Successful implementation of government policies aimed at promoting energy security and diversification will also significantly influence the pace of future growth.
Key Players Shaping the Mexican Oil and Gas Industry Market
- ExxonMobil Corporation
- TC Energy Corporation
- Marathon Petroleum Corporation
- Sicim SpA
- Chevron Corporation
- Saipem SpA
- Citla Energy
- TotalEnergies SE
- Royal Dutch Shell PLC
- Petroleos Mexicanos (Pemex)
- BP PLC
- Sempra Energy
Notable Milestones in Mexican Oil and Gas Industry Sector
- January 2021: Braskem Idesa partially restored operations at the Etileno XXI petrochemical complex after a natural gas supply disruption.
- August 2021: Mexico's state power utility partnered with TC Energy Corp. to develop a natural gas pipeline in the south.
In-Depth Mexican Oil and Gas Industry Market Outlook
The future of the Mexican oil and gas industry hinges on successful infrastructure development, attracting further investment, and effectively managing environmental concerns. The industry is poised for growth, driven by robust domestic demand and strategic partnerships. However, navigating regulatory challenges and addressing the growing concerns about carbon emissions will be crucial for long-term success. The continued adoption of sustainable practices and technological innovation will unlock significant future market potential.
Mexican Oil and Gas Industry Segmentation
- 1. Upstream (Exploration and Production)
- 2. Midstream (Pipeline and LNG Terminals)
- 3. Downstre
Mexican Oil and Gas Industry Segmentation By Geography
-
1. North America
- 1.1. United States
- 1.2. Canada
- 1.3. Mexico
-
2. South America
- 2.1. Brazil
- 2.2. Argentina
- 2.3. Rest of South America
-
3. Europe
- 3.1. United Kingdom
- 3.2. Germany
- 3.3. France
- 3.4. Italy
- 3.5. Spain
- 3.6. Russia
- 3.7. Benelux
- 3.8. Nordics
- 3.9. Rest of Europe
-
4. Middle East & Africa
- 4.1. Turkey
- 4.2. Israel
- 4.3. GCC
- 4.4. North Africa
- 4.5. South Africa
- 4.6. Rest of Middle East & Africa
-
5. Asia Pacific
- 5.1. China
- 5.2. India
- 5.3. Japan
- 5.4. South Korea
- 5.5. ASEAN
- 5.6. Oceania
- 5.7. Rest of Asia Pacific
Mexican Oil and Gas Industry REPORT HIGHLIGHTS
| Aspects | Details |
|---|---|
| Study Period | 2019-2033 |
| Base Year | 2024 |
| Estimated Year | 2025 |
| Forecast Period | 2025-2033 |
| Historical Period | 2019-2024 |
| Growth Rate | CAGR of < 2.00% from 2019-2033 |
| Segmentation |
|
Table of Contents
- 1. Introduction
- 1.1. Research Scope
- 1.2. Market Segmentation
- 1.3. Research Methodology
- 1.4. Definitions and Assumptions
- 2. Executive Summary
- 2.1. Introduction
- 3. Market Dynamics
- 3.1. Introduction
- 3.2. Market Drivers
- 3.2.1 4.; Recovering Number of Air Passengers
- 3.2.2 on Account of the Cheaper Airfare in Recent Times4.; Increasing Disposable Income of Population
- 3.3. Market Restrains
- 3.3.1. 4.; High Share of Fossil-Fuel-Based Aviation Fuels in South American Countries
- 3.4. Market Trends
- 3.4.1. Upstream Segment Expected to Witness Significant Growth
- 4. Market Factor Analysis
- 4.1. Porters Five Forces
- 4.2. Supply/Value Chain
- 4.3. PESTEL analysis
- 4.4. Market Entropy
- 4.5. Patent/Trademark Analysis
- 5. Global Mexican Oil and Gas Industry Analysis, Insights and Forecast, 2019-2031
- 5.1. Market Analysis, Insights and Forecast - by Upstream (Exploration and Production)
- 5.2. Market Analysis, Insights and Forecast - by Midstream (Pipeline and LNG Terminals)
- 5.3. Market Analysis, Insights and Forecast - by Downstre
- 5.4. Market Analysis, Insights and Forecast - by Region
- 5.4.1. North America
- 5.4.2. South America
- 5.4.3. Europe
- 5.4.4. Middle East & Africa
- 5.4.5. Asia Pacific
- 5.1. Market Analysis, Insights and Forecast - by Upstream (Exploration and Production)
- 6. North America Mexican Oil and Gas Industry Analysis, Insights and Forecast, 2019-2031
- 6.1. Market Analysis, Insights and Forecast - by Upstream (Exploration and Production)
- 6.2. Market Analysis, Insights and Forecast - by Midstream (Pipeline and LNG Terminals)
- 6.3. Market Analysis, Insights and Forecast - by Downstre
- 6.1. Market Analysis, Insights and Forecast - by Upstream (Exploration and Production)
- 7. South America Mexican Oil and Gas Industry Analysis, Insights and Forecast, 2019-2031
- 7.1. Market Analysis, Insights and Forecast - by Upstream (Exploration and Production)
- 7.2. Market Analysis, Insights and Forecast - by Midstream (Pipeline and LNG Terminals)
- 7.3. Market Analysis, Insights and Forecast - by Downstre
- 7.1. Market Analysis, Insights and Forecast - by Upstream (Exploration and Production)
- 8. Europe Mexican Oil and Gas Industry Analysis, Insights and Forecast, 2019-2031
- 8.1. Market Analysis, Insights and Forecast - by Upstream (Exploration and Production)
- 8.2. Market Analysis, Insights and Forecast - by Midstream (Pipeline and LNG Terminals)
- 8.3. Market Analysis, Insights and Forecast - by Downstre
- 8.1. Market Analysis, Insights and Forecast - by Upstream (Exploration and Production)
- 9. Middle East & Africa Mexican Oil and Gas Industry Analysis, Insights and Forecast, 2019-2031
- 9.1. Market Analysis, Insights and Forecast - by Upstream (Exploration and Production)
- 9.2. Market Analysis, Insights and Forecast - by Midstream (Pipeline and LNG Terminals)
- 9.3. Market Analysis, Insights and Forecast - by Downstre
- 9.1. Market Analysis, Insights and Forecast - by Upstream (Exploration and Production)
- 10. Asia Pacific Mexican Oil and Gas Industry Analysis, Insights and Forecast, 2019-2031
- 10.1. Market Analysis, Insights and Forecast - by Upstream (Exploration and Production)
- 10.2. Market Analysis, Insights and Forecast - by Midstream (Pipeline and LNG Terminals)
- 10.3. Market Analysis, Insights and Forecast - by Downstre
- 10.1. Market Analysis, Insights and Forecast - by Upstream (Exploration and Production)
- 11. Brazil Mexican Oil and Gas Industry Analysis, Insights and Forecast, 2019-2031
- 12. Argentina Mexican Oil and Gas Industry Analysis, Insights and Forecast, 2019-2031
- 13. Rest of South America Mexican Oil and Gas Industry Analysis, Insights and Forecast, 2019-2031
- 14. Competitive Analysis
- 14.1. Global Market Share Analysis 2024
- 14.2. Company Profiles
- 14.2.1 ExxonMobil Corporation*List Not Exhaustive
- 14.2.1.1. Overview
- 14.2.1.2. Products
- 14.2.1.3. SWOT Analysis
- 14.2.1.4. Recent Developments
- 14.2.1.5. Financials (Based on Availability)
- 14.2.2 TC Energy Corporation
- 14.2.2.1. Overview
- 14.2.2.2. Products
- 14.2.2.3. SWOT Analysis
- 14.2.2.4. Recent Developments
- 14.2.2.5. Financials (Based on Availability)
- 14.2.3 Marathon Petroleum Corporation
- 14.2.3.1. Overview
- 14.2.3.2. Products
- 14.2.3.3. SWOT Analysis
- 14.2.3.4. Recent Developments
- 14.2.3.5. Financials (Based on Availability)
- 14.2.4 Sicim SpA
- 14.2.4.1. Overview
- 14.2.4.2. Products
- 14.2.4.3. SWOT Analysis
- 14.2.4.4. Recent Developments
- 14.2.4.5. Financials (Based on Availability)
- 14.2.5 Chevron Corporation
- 14.2.5.1. Overview
- 14.2.5.2. Products
- 14.2.5.3. SWOT Analysis
- 14.2.5.4. Recent Developments
- 14.2.5.5. Financials (Based on Availability)
- 14.2.6 Saipem SpA
- 14.2.6.1. Overview
- 14.2.6.2. Products
- 14.2.6.3. SWOT Analysis
- 14.2.6.4. Recent Developments
- 14.2.6.5. Financials (Based on Availability)
- 14.2.7 Citla Energy
- 14.2.7.1. Overview
- 14.2.7.2. Products
- 14.2.7.3. SWOT Analysis
- 14.2.7.4. Recent Developments
- 14.2.7.5. Financials (Based on Availability)
- 14.2.8 TotalEnergies SE
- 14.2.8.1. Overview
- 14.2.8.2. Products
- 14.2.8.3. SWOT Analysis
- 14.2.8.4. Recent Developments
- 14.2.8.5. Financials (Based on Availability)
- 14.2.9 Royal Dutch Shell PLC
- 14.2.9.1. Overview
- 14.2.9.2. Products
- 14.2.9.3. SWOT Analysis
- 14.2.9.4. Recent Developments
- 14.2.9.5. Financials (Based on Availability)
- 14.2.10 Petroleos Mexicanos (Pemex)
- 14.2.10.1. Overview
- 14.2.10.2. Products
- 14.2.10.3. SWOT Analysis
- 14.2.10.4. Recent Developments
- 14.2.10.5. Financials (Based on Availability)
- 14.2.11 BP PLC
- 14.2.11.1. Overview
- 14.2.11.2. Products
- 14.2.11.3. SWOT Analysis
- 14.2.11.4. Recent Developments
- 14.2.11.5. Financials (Based on Availability)
- 14.2.12 Sempra Energy
- 14.2.12.1. Overview
- 14.2.12.2. Products
- 14.2.12.3. SWOT Analysis
- 14.2.12.4. Recent Developments
- 14.2.12.5. Financials (Based on Availability)
- 14.2.1 ExxonMobil Corporation*List Not Exhaustive
List of Figures
- Figure 1: Global Mexican Oil and Gas Industry Revenue Breakdown (Million, %) by Region 2024 & 2032
- Figure 2: South America Mexican Oil and Gas Industry Revenue (Million), by Country 2024 & 2032
- Figure 3: South America Mexican Oil and Gas Industry Revenue Share (%), by Country 2024 & 2032
- Figure 4: North America Mexican Oil and Gas Industry Revenue (Million), by Upstream (Exploration and Production) 2024 & 2032
- Figure 5: North America Mexican Oil and Gas Industry Revenue Share (%), by Upstream (Exploration and Production) 2024 & 2032
- Figure 6: North America Mexican Oil and Gas Industry Revenue (Million), by Midstream (Pipeline and LNG Terminals) 2024 & 2032
- Figure 7: North America Mexican Oil and Gas Industry Revenue Share (%), by Midstream (Pipeline and LNG Terminals) 2024 & 2032
- Figure 8: North America Mexican Oil and Gas Industry Revenue (Million), by Downstre 2024 & 2032
- Figure 9: North America Mexican Oil and Gas Industry Revenue Share (%), by Downstre 2024 & 2032
- Figure 10: North America Mexican Oil and Gas Industry Revenue (Million), by Country 2024 & 2032
- Figure 11: North America Mexican Oil and Gas Industry Revenue Share (%), by Country 2024 & 2032
- Figure 12: South America Mexican Oil and Gas Industry Revenue (Million), by Upstream (Exploration and Production) 2024 & 2032
- Figure 13: South America Mexican Oil and Gas Industry Revenue Share (%), by Upstream (Exploration and Production) 2024 & 2032
- Figure 14: South America Mexican Oil and Gas Industry Revenue (Million), by Midstream (Pipeline and LNG Terminals) 2024 & 2032
- Figure 15: South America Mexican Oil and Gas Industry Revenue Share (%), by Midstream (Pipeline and LNG Terminals) 2024 & 2032
- Figure 16: South America Mexican Oil and Gas Industry Revenue (Million), by Downstre 2024 & 2032
- Figure 17: South America Mexican Oil and Gas Industry Revenue Share (%), by Downstre 2024 & 2032
- Figure 18: South America Mexican Oil and Gas Industry Revenue (Million), by Country 2024 & 2032
- Figure 19: South America Mexican Oil and Gas Industry Revenue Share (%), by Country 2024 & 2032
- Figure 20: Europe Mexican Oil and Gas Industry Revenue (Million), by Upstream (Exploration and Production) 2024 & 2032
- Figure 21: Europe Mexican Oil and Gas Industry Revenue Share (%), by Upstream (Exploration and Production) 2024 & 2032
- Figure 22: Europe Mexican Oil and Gas Industry Revenue (Million), by Midstream (Pipeline and LNG Terminals) 2024 & 2032
- Figure 23: Europe Mexican Oil and Gas Industry Revenue Share (%), by Midstream (Pipeline and LNG Terminals) 2024 & 2032
- Figure 24: Europe Mexican Oil and Gas Industry Revenue (Million), by Downstre 2024 & 2032
- Figure 25: Europe Mexican Oil and Gas Industry Revenue Share (%), by Downstre 2024 & 2032
- Figure 26: Europe Mexican Oil and Gas Industry Revenue (Million), by Country 2024 & 2032
- Figure 27: Europe Mexican Oil and Gas Industry Revenue Share (%), by Country 2024 & 2032
- Figure 28: Middle East & Africa Mexican Oil and Gas Industry Revenue (Million), by Upstream (Exploration and Production) 2024 & 2032
- Figure 29: Middle East & Africa Mexican Oil and Gas Industry Revenue Share (%), by Upstream (Exploration and Production) 2024 & 2032
- Figure 30: Middle East & Africa Mexican Oil and Gas Industry Revenue (Million), by Midstream (Pipeline and LNG Terminals) 2024 & 2032
- Figure 31: Middle East & Africa Mexican Oil and Gas Industry Revenue Share (%), by Midstream (Pipeline and LNG Terminals) 2024 & 2032
- Figure 32: Middle East & Africa Mexican Oil and Gas Industry Revenue (Million), by Downstre 2024 & 2032
- Figure 33: Middle East & Africa Mexican Oil and Gas Industry Revenue Share (%), by Downstre 2024 & 2032
- Figure 34: Middle East & Africa Mexican Oil and Gas Industry Revenue (Million), by Country 2024 & 2032
- Figure 35: Middle East & Africa Mexican Oil and Gas Industry Revenue Share (%), by Country 2024 & 2032
- Figure 36: Asia Pacific Mexican Oil and Gas Industry Revenue (Million), by Upstream (Exploration and Production) 2024 & 2032
- Figure 37: Asia Pacific Mexican Oil and Gas Industry Revenue Share (%), by Upstream (Exploration and Production) 2024 & 2032
- Figure 38: Asia Pacific Mexican Oil and Gas Industry Revenue (Million), by Midstream (Pipeline and LNG Terminals) 2024 & 2032
- Figure 39: Asia Pacific Mexican Oil and Gas Industry Revenue Share (%), by Midstream (Pipeline and LNG Terminals) 2024 & 2032
- Figure 40: Asia Pacific Mexican Oil and Gas Industry Revenue (Million), by Downstre 2024 & 2032
- Figure 41: Asia Pacific Mexican Oil and Gas Industry Revenue Share (%), by Downstre 2024 & 2032
- Figure 42: Asia Pacific Mexican Oil and Gas Industry Revenue (Million), by Country 2024 & 2032
- Figure 43: Asia Pacific Mexican Oil and Gas Industry Revenue Share (%), by Country 2024 & 2032
List of Tables
- Table 1: Global Mexican Oil and Gas Industry Revenue Million Forecast, by Region 2019 & 2032
- Table 2: Global Mexican Oil and Gas Industry Revenue Million Forecast, by Upstream (Exploration and Production) 2019 & 2032
- Table 3: Global Mexican Oil and Gas Industry Revenue Million Forecast, by Midstream (Pipeline and LNG Terminals) 2019 & 2032
- Table 4: Global Mexican Oil and Gas Industry Revenue Million Forecast, by Downstre 2019 & 2032
- Table 5: Global Mexican Oil and Gas Industry Revenue Million Forecast, by Region 2019 & 2032
- Table 6: Global Mexican Oil and Gas Industry Revenue Million Forecast, by Country 2019 & 2032
- Table 7: Brazil Mexican Oil and Gas Industry Revenue (Million) Forecast, by Application 2019 & 2032
- Table 8: Argentina Mexican Oil and Gas Industry Revenue (Million) Forecast, by Application 2019 & 2032
- Table 9: Rest of South America Mexican Oil and Gas Industry Revenue (Million) Forecast, by Application 2019 & 2032
- Table 10: Global Mexican Oil and Gas Industry Revenue Million Forecast, by Upstream (Exploration and Production) 2019 & 2032
- Table 11: Global Mexican Oil and Gas Industry Revenue Million Forecast, by Midstream (Pipeline and LNG Terminals) 2019 & 2032
- Table 12: Global Mexican Oil and Gas Industry Revenue Million Forecast, by Downstre 2019 & 2032
- Table 13: Global Mexican Oil and Gas Industry Revenue Million Forecast, by Country 2019 & 2032
- Table 14: United States Mexican Oil and Gas Industry Revenue (Million) Forecast, by Application 2019 & 2032
- Table 15: Canada Mexican Oil and Gas Industry Revenue (Million) Forecast, by Application 2019 & 2032
- Table 16: Mexico Mexican Oil and Gas Industry Revenue (Million) Forecast, by Application 2019 & 2032
- Table 17: Global Mexican Oil and Gas Industry Revenue Million Forecast, by Upstream (Exploration and Production) 2019 & 2032
- Table 18: Global Mexican Oil and Gas Industry Revenue Million Forecast, by Midstream (Pipeline and LNG Terminals) 2019 & 2032
- Table 19: Global Mexican Oil and Gas Industry Revenue Million Forecast, by Downstre 2019 & 2032
- Table 20: Global Mexican Oil and Gas Industry Revenue Million Forecast, by Country 2019 & 2032
- Table 21: Brazil Mexican Oil and Gas Industry Revenue (Million) Forecast, by Application 2019 & 2032
- Table 22: Argentina Mexican Oil and Gas Industry Revenue (Million) Forecast, by Application 2019 & 2032
- Table 23: Rest of South America Mexican Oil and Gas Industry Revenue (Million) Forecast, by Application 2019 & 2032
- Table 24: Global Mexican Oil and Gas Industry Revenue Million Forecast, by Upstream (Exploration and Production) 2019 & 2032
- Table 25: Global Mexican Oil and Gas Industry Revenue Million Forecast, by Midstream (Pipeline and LNG Terminals) 2019 & 2032
- Table 26: Global Mexican Oil and Gas Industry Revenue Million Forecast, by Downstre 2019 & 2032
- Table 27: Global Mexican Oil and Gas Industry Revenue Million Forecast, by Country 2019 & 2032
- Table 28: United Kingdom Mexican Oil and Gas Industry Revenue (Million) Forecast, by Application 2019 & 2032
- Table 29: Germany Mexican Oil and Gas Industry Revenue (Million) Forecast, by Application 2019 & 2032
- Table 30: France Mexican Oil and Gas Industry Revenue (Million) Forecast, by Application 2019 & 2032
- Table 31: Italy Mexican Oil and Gas Industry Revenue (Million) Forecast, by Application 2019 & 2032
- Table 32: Spain Mexican Oil and Gas Industry Revenue (Million) Forecast, by Application 2019 & 2032
- Table 33: Russia Mexican Oil and Gas Industry Revenue (Million) Forecast, by Application 2019 & 2032
- Table 34: Benelux Mexican Oil and Gas Industry Revenue (Million) Forecast, by Application 2019 & 2032
- Table 35: Nordics Mexican Oil and Gas Industry Revenue (Million) Forecast, by Application 2019 & 2032
- Table 36: Rest of Europe Mexican Oil and Gas Industry Revenue (Million) Forecast, by Application 2019 & 2032
- Table 37: Global Mexican Oil and Gas Industry Revenue Million Forecast, by Upstream (Exploration and Production) 2019 & 2032
- Table 38: Global Mexican Oil and Gas Industry Revenue Million Forecast, by Midstream (Pipeline and LNG Terminals) 2019 & 2032
- Table 39: Global Mexican Oil and Gas Industry Revenue Million Forecast, by Downstre 2019 & 2032
- Table 40: Global Mexican Oil and Gas Industry Revenue Million Forecast, by Country 2019 & 2032
- Table 41: Turkey Mexican Oil and Gas Industry Revenue (Million) Forecast, by Application 2019 & 2032
- Table 42: Israel Mexican Oil and Gas Industry Revenue (Million) Forecast, by Application 2019 & 2032
- Table 43: GCC Mexican Oil and Gas Industry Revenue (Million) Forecast, by Application 2019 & 2032
- Table 44: North Africa Mexican Oil and Gas Industry Revenue (Million) Forecast, by Application 2019 & 2032
- Table 45: South Africa Mexican Oil and Gas Industry Revenue (Million) Forecast, by Application 2019 & 2032
- Table 46: Rest of Middle East & Africa Mexican Oil and Gas Industry Revenue (Million) Forecast, by Application 2019 & 2032
- Table 47: Global Mexican Oil and Gas Industry Revenue Million Forecast, by Upstream (Exploration and Production) 2019 & 2032
- Table 48: Global Mexican Oil and Gas Industry Revenue Million Forecast, by Midstream (Pipeline and LNG Terminals) 2019 & 2032
- Table 49: Global Mexican Oil and Gas Industry Revenue Million Forecast, by Downstre 2019 & 2032
- Table 50: Global Mexican Oil and Gas Industry Revenue Million Forecast, by Country 2019 & 2032
- Table 51: China Mexican Oil and Gas Industry Revenue (Million) Forecast, by Application 2019 & 2032
- Table 52: India Mexican Oil and Gas Industry Revenue (Million) Forecast, by Application 2019 & 2032
- Table 53: Japan Mexican Oil and Gas Industry Revenue (Million) Forecast, by Application 2019 & 2032
- Table 54: South Korea Mexican Oil and Gas Industry Revenue (Million) Forecast, by Application 2019 & 2032
- Table 55: ASEAN Mexican Oil and Gas Industry Revenue (Million) Forecast, by Application 2019 & 2032
- Table 56: Oceania Mexican Oil and Gas Industry Revenue (Million) Forecast, by Application 2019 & 2032
- Table 57: Rest of Asia Pacific Mexican Oil and Gas Industry Revenue (Million) Forecast, by Application 2019 & 2032
Frequently Asked Questions
1. What is the projected Compound Annual Growth Rate (CAGR) of the Mexican Oil and Gas Industry?
The projected CAGR is approximately < 2.00%.
2. Which companies are prominent players in the Mexican Oil and Gas Industry?
Key companies in the market include ExxonMobil Corporation*List Not Exhaustive, TC Energy Corporation, Marathon Petroleum Corporation, Sicim SpA, Chevron Corporation, Saipem SpA, Citla Energy, TotalEnergies SE, Royal Dutch Shell PLC, Petroleos Mexicanos (Pemex), BP PLC, Sempra Energy.
3. What are the main segments of the Mexican Oil and Gas Industry?
The market segments include Upstream (Exploration and Production), Midstream (Pipeline and LNG Terminals), Downstre.
4. Can you provide details about the market size?
The market size is estimated to be USD XX Million as of 2022.
5. What are some drivers contributing to market growth?
4.; Recovering Number of Air Passengers. on Account of the Cheaper Airfare in Recent Times4.; Increasing Disposable Income of Population.
6. What are the notable trends driving market growth?
Upstream Segment Expected to Witness Significant Growth.
7. Are there any restraints impacting market growth?
4.; High Share of Fossil-Fuel-Based Aviation Fuels in South American Countries.
8. Can you provide examples of recent developments in the market?
In January 2021, Braskem Idesa announced that it had partially restored the operations at Etileno XXI polyethylene petrochemical complex, which was shut down in December 2020 due to natural gas supply cut by Cengas, a major natural gas system operator of Mexico. Braskem further stated that it had restarted operations in an experimental business model, complying with all the safety standards to reduce the impact on Mexico's plastics industry supply chain.
9. What pricing options are available for accessing the report?
Pricing options include single-user, multi-user, and enterprise licenses priced at USD 3800, USD 4500, and USD 5800 respectively.
10. Is the market size provided in terms of value or volume?
The market size is provided in terms of value, measured in Million.
11. Are there any specific market keywords associated with the report?
Yes, the market keyword associated with the report is "Mexican Oil and Gas Industry," which aids in identifying and referencing the specific market segment covered.
12. How do I determine which pricing option suits my needs best?
The pricing options vary based on user requirements and access needs. Individual users may opt for single-user licenses, while businesses requiring broader access may choose multi-user or enterprise licenses for cost-effective access to the report.
13. Are there any additional resources or data provided in the Mexican Oil and Gas Industry report?
While the report offers comprehensive insights, it's advisable to review the specific contents or supplementary materials provided to ascertain if additional resources or data are available.
14. How can I stay updated on further developments or reports in the Mexican Oil and Gas Industry?
To stay informed about further developments, trends, and reports in the Mexican Oil and Gas Industry, consider subscribing to industry newsletters, following relevant companies and organizations, or regularly checking reputable industry news sources and publications.
Methodology
Step 1 - Identification of Relevant Samples Size from Population Database


Step 2 - Approaches for Defining Global Market Size (Value, Volume* & Price*)

Note*: In applicable scenarios
Step 3 - Data Sources
Primary Research
- Web Analytics
- Survey Reports
- Research Institute
- Latest Research Reports
- Opinion Leaders
Secondary Research
- Annual Reports
- White Paper
- Latest Press Release
- Industry Association
- Paid Database
- Investor Presentations

Step 4 - Data Triangulation
Involves using different sources of information in order to increase the validity of a study
These sources are likely to be stakeholders in a program - participants, other researchers, program staff, other community members, and so on.
Then we put all data in single framework & apply various statistical tools to find out the dynamic on the market.
During the analysis stage, feedback from the stakeholder groups would be compared to determine areas of agreement as well as areas of divergence
