

Key Insights
The global mHealth Apps market is poised for substantial expansion, projected to reach an estimated $137,970 million by 2025. This impressive growth trajectory is fueled by a remarkable Compound Annual Growth Rate (CAGR) of 18.4% over the forecast period of 2025-2033. A confluence of factors is driving this surge, including the increasing penetration of smartphones and wearable devices, a growing awareness among individuals regarding proactive health management, and the escalating prevalence of chronic diseases globally. The convenience and accessibility offered by mHealth apps in monitoring health, facilitating remote patient care, and providing personalized health insights are resonating strongly with consumers and healthcare providers alike. Furthermore, advancements in mobile technology, including AI and IoT integration, are continually enhancing the functionality and efficacy of these applications, paving the way for more sophisticated and impactful health interventions.

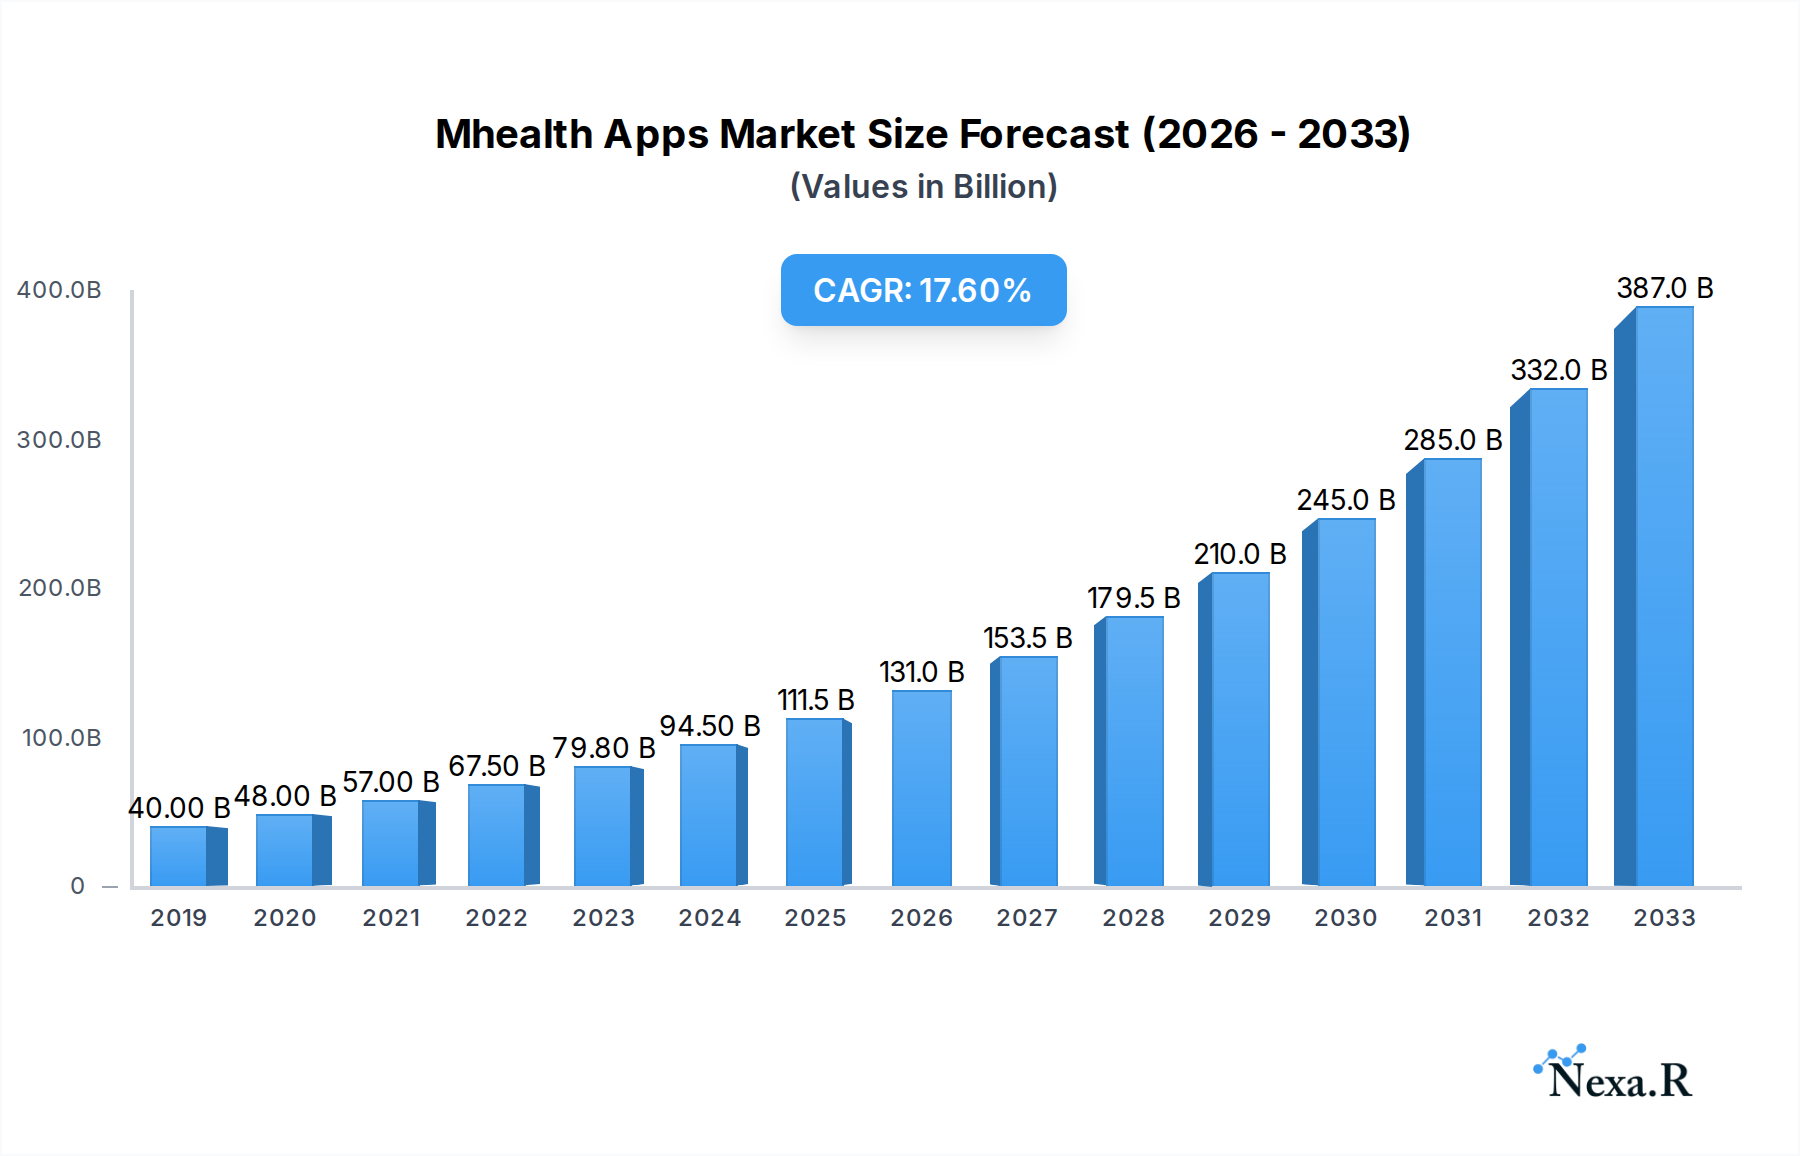
Mhealth Apps Market Size (In Billion)
The mHealth Apps market is segmented across diverse applications and types, reflecting the broad spectrum of healthcare needs addressed. Key application segments include Android, Apple, and Others, with a significant focus on fitness, lifestyle management, nutrition & diet, women's health, and medication adherence. The involvement of healthcare providers and payers in integrating mHealth solutions into their service offerings further bolsters market growth. Specialized segments like disease management are also witnessing robust adoption. Major industry players such as Abbott Laboratories, Johnson and Johnson, and Pfizer are actively investing in research and development to introduce innovative mHealth solutions, contributing to the competitive landscape and driving market evolution. Regionally, North America and Europe currently lead the market, driven by advanced healthcare infrastructure and high adoption rates of digital health technologies, while the Asia Pacific region is emerging as a significant growth hub due to its large, increasingly health-conscious population and rapid digital transformation.
Mhealth Apps Company Market Share
Mhealth Apps: A Comprehensive Market Analysis and Future Outlook (2019-2033)
This in-depth report provides a definitive analysis of the global Mhealth Apps market, offering critical insights into its structure, dynamics, growth trajectories, and future potential. Covering the period from 2019 to 2033, with a base and estimated year of 2025, this report is an essential resource for industry professionals seeking to navigate the evolving landscape of mobile health solutions.
Mhealth Apps Market Dynamics & Structure
The Mhealth Apps market is characterized by a moderately concentrated structure, with key players actively investing in research and development to drive technological innovation. The proliferation of smartphones and wearable devices, coupled with increasing health consciousness among consumers, serves as a primary driver. Regulatory frameworks, while evolving, are largely supportive of digital health solutions, though data privacy and security remain critical considerations. Competitive product substitutes, including traditional healthcare services and other digital wellness tools, necessitate continuous innovation and feature enhancement from Mhealth app providers. End-user demographics are expanding, encompassing a broad spectrum from tech-savvy millennials to an aging population seeking convenient health management. Mergers and acquisitions (M&A) trends indicate strategic consolidation and expansion of service offerings.
- Market Concentration: Dominated by a mix of established tech giants and specialized digital health firms.
- Technological Innovation Drivers: AI/ML for personalized insights, wearables integration, telehealth capabilities, big data analytics.
- Regulatory Frameworks: HIPAA, GDPR, and region-specific digital health guidelines shape market entry and operation.
- Competitive Product Substitutes: Traditional healthcare, wearables without companion apps, general wellness platforms.
- End-User Demographics: Growing adoption across age groups, with a focus on chronic disease management and preventative care.
- M&A Trends: Significant consolidation driven by the desire to acquire user bases, technology, and talent. Deal volumes are projected to rise by 15% in the next two years.
Mhealth Apps Growth Trends & Insights
The global Mhealth Apps market is poised for substantial growth, driven by a confluence of technological advancements, increasing healthcare awareness, and the widespread adoption of mobile devices. The market size, which reached an estimated $62,000 million in 2024, is projected to expand to $155,000 million by 2033, exhibiting a robust Compound Annual Growth Rate (CAGR) of 10.5% during the forecast period (2025–2033). Adoption rates are accelerating, propelled by the increasing prevalence of chronic diseases and a growing preference for remote and personalized healthcare solutions. Technological disruptions, such as the integration of artificial intelligence (AI) and machine learning (ML) for predictive analytics and personalized recommendations, are transforming the user experience. Consumer behavior shifts towards proactive health management and self-care are further fueling demand for accessible and user-friendly Mhealth applications. The penetration of Mhealth apps is expected to reach 70% of smartphone users by 2030, indicating a significant shift in how individuals engage with their health.
- Market Size Evolution: From approximately $55,000 million in 2019 to an estimated $62,000 million in 2024, with a projected surge to $155,000 million by 2033.
- Adoption Rates: Steadily increasing, driven by greater digital literacy and the perceived value of convenient health monitoring.
- Technological Disruptions: AI/ML for personalized insights, advanced sensor integration in wearables, blockchain for data security, and virtual reality for therapeutic applications.
- Consumer Behavior Shifts: Increased demand for preventative care, chronic disease management tools, mental wellness support, and personalized health coaching.
- Market Penetration: Expected to climb from approximately 45% in 2024 to over 70% of smartphone users by 2030.
- CAGR: Averaging 10.5% from 2025–2033, highlighting a significant growth phase.
Dominant Regions, Countries, or Segments in Mhealth Apps
North America, particularly the United States, currently dominates the Mhealth Apps market, driven by a highly developed digital infrastructure, a large digitally-savvy population, and substantial investment in healthcare technology. The Application: Apple segment exhibits strong traction due to the premium device ecosystem and robust app store, coupled with a user base that often prioritizes health and wellness. Within the Type segments, Disease Management applications are experiencing phenomenal growth, fueled by the rising global burden of chronic illnesses such as diabetes, cardiovascular diseases, and respiratory conditions. Healthcare providers and payers are increasingly integrating these solutions into their care pathways, recognizing their potential to improve patient outcomes and reduce healthcare costs. The Parent Market in North America, encompassing all healthcare-related technologies, provides a fertile ground for Mhealth app expansion, with the Child Market of specialized Mhealth solutions witnessing rapid innovation.
- Dominant Region: North America, with a market share exceeding 35%.
- Dominant Country: United States, representing over 80% of the North American Mhealth market.
- Dominant Application Segment: Apple, accounting for approximately 45% of app downloads and usage, followed closely by Android.
- Dominant Type Segment: Disease Management, projected to grow at a CAGR of 12% during the forecast period.
- Key Drivers in Dominant Segments:
- North America: High disposable income, government initiatives for digital health, strong R&D investment.
- United States: Advanced healthcare system, widespread adoption of wearables, reimbursement policies favoring digital health.
- Apple: User trust in privacy, integrated health features (Apple HealthKit), strong loyalty.
- Disease Management: Escalating chronic disease rates, demand for remote patient monitoring, personalized treatment plans.
- Market Share & Growth Potential: The Disease Management segment is expected to capture over 30% of the total Mhealth app market by 2030, with significant growth potential in managing conditions like diabetes and hypertension.
Mhealth Apps Product Landscape
The Mhealth Apps product landscape is a dynamic ecosystem of innovative solutions catering to diverse health needs. These applications leverage advanced technologies such as AI for personalized coaching, wearable sensor integration for real-time data capture, and telehealth functionalities for remote consultations. Performance metrics are increasingly focused on user engagement, clinical efficacy, and measurable health outcomes. Unique selling propositions often lie in specialized functionalities like AI-driven diagnostic support, gamified adherence programs, or seamless integration with electronic health records (EHRs). Technological advancements are continuously pushing the boundaries, enabling more sophisticated data analysis and predictive capabilities, thereby enhancing user experience and delivering tangible health benefits.
Key Drivers, Barriers & Challenges in Mhealth Apps
Key Drivers: The Mhealth Apps market is propelled by the escalating global burden of chronic diseases, increasing health consciousness among consumers, and the widespread adoption of smartphones and wearable devices. Government initiatives promoting digital health, coupled with advancements in AI and machine learning for personalized health insights, further accelerate growth. The demand for remote patient monitoring and telehealth services, especially post-pandemic, has also been a significant catalyst.
Key Barriers & Challenges: Data privacy and security concerns remain a significant hurdle, alongside stringent regulatory frameworks in certain regions. Interoperability issues between different Mhealth apps and existing healthcare systems pose a challenge. High development costs, the need for continuous updates to keep pace with technological advancements, and ensuring sustained user engagement beyond initial downloads are also critical restraints. The digital divide, limiting access for certain demographics, also presents a barrier.
- Quantifiable Impacts: Regulatory compliance can add 10-15% to development costs. User churn rates can exceed 50% within the first six months if engagement strategies are weak.
Emerging Opportunities in Mhealth Apps
Emerging opportunities in the Mhealth Apps sector are abundant, driven by evolving consumer preferences and technological breakthroughs. The growing demand for mental health support presents a significant untapped market, with apps focusing on mindfulness, cognitive behavioral therapy (CBT), and virtual counseling gaining traction. Personalized preventative care solutions, leveraging predictive analytics to identify health risks before they manifest, are also a rapidly expanding area. Furthermore, the integration of Mhealth apps with smart home devices for comprehensive health monitoring and the development of AI-powered virtual health assistants offer substantial potential for market expansion. The increasing focus on women's health and specialized conditions is also creating niche opportunities.
Growth Accelerators in the Mhealth Apps Industry
Long-term growth in the Mhealth Apps industry is being significantly accelerated by continuous technological breakthroughs, particularly in AI, wearable sensor technology, and data analytics. Strategic partnerships between Mhealth app developers, healthcare providers, pharmaceutical companies, and insurance payers are crucial for expanding reach, enhancing credibility, and integrating digital solutions into broader healthcare ecosystems. Market expansion strategies, including localization for diverse cultural and linguistic needs and the development of affordable Mhealth solutions for emerging economies, are also key growth accelerators. The increasing focus on value-based healthcare models, where patient outcomes are prioritized, further incentivizes the adoption and development of effective Mhealth solutions.
Key Players Shaping the Mhealth Apps Market
- Abbott Laboratories
- Johnson and Johnson
- AstraZeneca PLC
- F. Hoffmann-La Roche Ltd.
- Novartis AG
- Bristol-Myers Squibb Company
- GlaxoSmithKline plc
- Merck and Co., Inc.
- Pfizer, Inc.
- Sanofi
Notable Milestones in Mhealth Apps Sector
- 2019: Increased integration of AI and ML in Mhealth apps for personalized health recommendations.
- 2020: Surge in demand for telehealth and remote patient monitoring apps due to the COVID-19 pandemic.
- 2021: Expansion of mental wellness and mindfulness apps, reflecting growing awareness of mental health importance.
- 2022: Enhanced focus on data security and privacy compliance with evolving global regulations.
- 2023: Greater adoption by healthcare providers and payers, with evidence of improved patient outcomes and cost savings.
- 2024: Advancements in wearable technology leading to more sophisticated health tracking and diagnostic capabilities.
In-Depth Mhealth Apps Market Outlook
The Mhealth Apps market is set for continued robust growth, driven by an optimistic future outlook. Key growth accelerators, including the integration of advanced AI for predictive diagnostics, the expansion of chronic disease management platforms, and the increasing adoption of wearable technology, will fuel market expansion. Strategic partnerships with healthcare institutions and pharmaceutical giants will further solidify the role of Mhealth in mainstream healthcare delivery. Emerging opportunities in personalized wellness, mental health support, and preventive care will unlock new revenue streams and user bases. The market's trajectory indicates a future where Mhealth apps are not just supplementary tools but integral components of a connected, proactive, and patient-centric healthcare system.
Mhealth Apps Segmentation
-
1. Application
- 1.1. Android
- 1.2. Apple
- 1.3. Others
-
2. Type
- 2.1. Fitness
- 2.2. Lifestyle Management
- 2.3. Nutrition & Diet
- 2.4. Women's Health
- 2.5. Medication Adherence
- 2.6. Healthcare Providers/Payers
- 2.7. Disease Management
- 2.8. Others
Mhealth Apps Segmentation By Geography
-
1. North America
- 1.1. United States
- 1.2. Canada
- 1.3. Mexico
-
2. South America
- 2.1. Brazil
- 2.2. Argentina
- 2.3. Rest of South America
-
3. Europe
- 3.1. United Kingdom
- 3.2. Germany
- 3.3. France
- 3.4. Italy
- 3.5. Spain
- 3.6. Russia
- 3.7. Benelux
- 3.8. Nordics
- 3.9. Rest of Europe
-
4. Middle East & Africa
- 4.1. Turkey
- 4.2. Israel
- 4.3. GCC
- 4.4. North Africa
- 4.5. South Africa
- 4.6. Rest of Middle East & Africa
-
5. Asia Pacific
- 5.1. China
- 5.2. India
- 5.3. Japan
- 5.4. South Korea
- 5.5. ASEAN
- 5.6. Oceania
- 5.7. Rest of Asia Pacific
Mhealth Apps Regional Market Share
Geographic Coverage of Mhealth Apps
Mhealth Apps REPORT HIGHLIGHTS
| Aspects | Details |
|---|---|
| Study Period | 2020-2034 |
| Base Year | 2025 |
| Estimated Year | 2026 |
| Forecast Period | 2026-2034 |
| Historical Period | 2020-2025 |
| Growth Rate | CAGR of 18.4% from 2020-2034 |
| Segmentation |
|
Table of Contents
- 1. Introduction
- 1.1. Research Scope
- 1.2. Market Segmentation
- 1.3. Research Methodology
- 1.4. Definitions and Assumptions
- 2. Executive Summary
- 2.1. Introduction
- 3. Market Dynamics
- 3.1. Introduction
- 3.2. Market Drivers
- 3.3. Market Restrains
- 3.4. Market Trends
- 4. Market Factor Analysis
- 4.1. Porters Five Forces
- 4.2. Supply/Value Chain
- 4.3. PESTEL analysis
- 4.4. Market Entropy
- 4.5. Patent/Trademark Analysis
- 5. Global Mhealth Apps Analysis, Insights and Forecast, 2020-2032
- 5.1. Market Analysis, Insights and Forecast - by Application
- 5.1.1. Android
- 5.1.2. Apple
- 5.1.3. Others
- 5.2. Market Analysis, Insights and Forecast - by Type
- 5.2.1. Fitness
- 5.2.2. Lifestyle Management
- 5.2.3. Nutrition & Diet
- 5.2.4. Women's Health
- 5.2.5. Medication Adherence
- 5.2.6. Healthcare Providers/Payers
- 5.2.7. Disease Management
- 5.2.8. Others
- 5.3. Market Analysis, Insights and Forecast - by Region
- 5.3.1. North America
- 5.3.2. South America
- 5.3.3. Europe
- 5.3.4. Middle East & Africa
- 5.3.5. Asia Pacific
- 5.1. Market Analysis, Insights and Forecast - by Application
- 6. North America Mhealth Apps Analysis, Insights and Forecast, 2020-2032
- 6.1. Market Analysis, Insights and Forecast - by Application
- 6.1.1. Android
- 6.1.2. Apple
- 6.1.3. Others
- 6.2. Market Analysis, Insights and Forecast - by Type
- 6.2.1. Fitness
- 6.2.2. Lifestyle Management
- 6.2.3. Nutrition & Diet
- 6.2.4. Women's Health
- 6.2.5. Medication Adherence
- 6.2.6. Healthcare Providers/Payers
- 6.2.7. Disease Management
- 6.2.8. Others
- 6.1. Market Analysis, Insights and Forecast - by Application
- 7. South America Mhealth Apps Analysis, Insights and Forecast, 2020-2032
- 7.1. Market Analysis, Insights and Forecast - by Application
- 7.1.1. Android
- 7.1.2. Apple
- 7.1.3. Others
- 7.2. Market Analysis, Insights and Forecast - by Type
- 7.2.1. Fitness
- 7.2.2. Lifestyle Management
- 7.2.3. Nutrition & Diet
- 7.2.4. Women's Health
- 7.2.5. Medication Adherence
- 7.2.6. Healthcare Providers/Payers
- 7.2.7. Disease Management
- 7.2.8. Others
- 7.1. Market Analysis, Insights and Forecast - by Application
- 8. Europe Mhealth Apps Analysis, Insights and Forecast, 2020-2032
- 8.1. Market Analysis, Insights and Forecast - by Application
- 8.1.1. Android
- 8.1.2. Apple
- 8.1.3. Others
- 8.2. Market Analysis, Insights and Forecast - by Type
- 8.2.1. Fitness
- 8.2.2. Lifestyle Management
- 8.2.3. Nutrition & Diet
- 8.2.4. Women's Health
- 8.2.5. Medication Adherence
- 8.2.6. Healthcare Providers/Payers
- 8.2.7. Disease Management
- 8.2.8. Others
- 8.1. Market Analysis, Insights and Forecast - by Application
- 9. Middle East & Africa Mhealth Apps Analysis, Insights and Forecast, 2020-2032
- 9.1. Market Analysis, Insights and Forecast - by Application
- 9.1.1. Android
- 9.1.2. Apple
- 9.1.3. Others
- 9.2. Market Analysis, Insights and Forecast - by Type
- 9.2.1. Fitness
- 9.2.2. Lifestyle Management
- 9.2.3. Nutrition & Diet
- 9.2.4. Women's Health
- 9.2.5. Medication Adherence
- 9.2.6. Healthcare Providers/Payers
- 9.2.7. Disease Management
- 9.2.8. Others
- 9.1. Market Analysis, Insights and Forecast - by Application
- 10. Asia Pacific Mhealth Apps Analysis, Insights and Forecast, 2020-2032
- 10.1. Market Analysis, Insights and Forecast - by Application
- 10.1.1. Android
- 10.1.2. Apple
- 10.1.3. Others
- 10.2. Market Analysis, Insights and Forecast - by Type
- 10.2.1. Fitness
- 10.2.2. Lifestyle Management
- 10.2.3. Nutrition & Diet
- 10.2.4. Women's Health
- 10.2.5. Medication Adherence
- 10.2.6. Healthcare Providers/Payers
- 10.2.7. Disease Management
- 10.2.8. Others
- 10.1. Market Analysis, Insights and Forecast - by Application
- 11. Competitive Analysis
- 11.1. Global Market Share Analysis 2025
- 11.2. Company Profiles
- 11.2.1 Abbott Laboratories
- 11.2.1.1. Overview
- 11.2.1.2. Products
- 11.2.1.3. SWOT Analysis
- 11.2.1.4. Recent Developments
- 11.2.1.5. Financials (Based on Availability)
- 11.2.2 Johnson and Johnson
- 11.2.2.1. Overview
- 11.2.2.2. Products
- 11.2.2.3. SWOT Analysis
- 11.2.2.4. Recent Developments
- 11.2.2.5. Financials (Based on Availability)
- 11.2.3 AstraZeneca PLC
- 11.2.3.1. Overview
- 11.2.3.2. Products
- 11.2.3.3. SWOT Analysis
- 11.2.3.4. Recent Developments
- 11.2.3.5. Financials (Based on Availability)
- 11.2.4 F. Hoffmann-La Roche Ltd.
- 11.2.4.1. Overview
- 11.2.4.2. Products
- 11.2.4.3. SWOT Analysis
- 11.2.4.4. Recent Developments
- 11.2.4.5. Financials (Based on Availability)
- 11.2.5 Novartis AG
- 11.2.5.1. Overview
- 11.2.5.2. Products
- 11.2.5.3. SWOT Analysis
- 11.2.5.4. Recent Developments
- 11.2.5.5. Financials (Based on Availability)
- 11.2.6 Bristol-Myers Squibb Company
- 11.2.6.1. Overview
- 11.2.6.2. Products
- 11.2.6.3. SWOT Analysis
- 11.2.6.4. Recent Developments
- 11.2.6.5. Financials (Based on Availability)
- 11.2.7 GlaxoSmithKline plc
- 11.2.7.1. Overview
- 11.2.7.2. Products
- 11.2.7.3. SWOT Analysis
- 11.2.7.4. Recent Developments
- 11.2.7.5. Financials (Based on Availability)
- 11.2.8 Merck and Co. Inc.
- 11.2.8.1. Overview
- 11.2.8.2. Products
- 11.2.8.3. SWOT Analysis
- 11.2.8.4. Recent Developments
- 11.2.8.5. Financials (Based on Availability)
- 11.2.9 Pfizer Inc.
- 11.2.9.1. Overview
- 11.2.9.2. Products
- 11.2.9.3. SWOT Analysis
- 11.2.9.4. Recent Developments
- 11.2.9.5. Financials (Based on Availability)
- 11.2.10 Sanofi
- 11.2.10.1. Overview
- 11.2.10.2. Products
- 11.2.10.3. SWOT Analysis
- 11.2.10.4. Recent Developments
- 11.2.10.5. Financials (Based on Availability)
- 11.2.1 Abbott Laboratories
List of Figures
- Figure 1: Global Mhealth Apps Revenue Breakdown (million, %) by Region 2025 & 2033
- Figure 2: North America Mhealth Apps Revenue (million), by Application 2025 & 2033
- Figure 3: North America Mhealth Apps Revenue Share (%), by Application 2025 & 2033
- Figure 4: North America Mhealth Apps Revenue (million), by Type 2025 & 2033
- Figure 5: North America Mhealth Apps Revenue Share (%), by Type 2025 & 2033
- Figure 6: North America Mhealth Apps Revenue (million), by Country 2025 & 2033
- Figure 7: North America Mhealth Apps Revenue Share (%), by Country 2025 & 2033
- Figure 8: South America Mhealth Apps Revenue (million), by Application 2025 & 2033
- Figure 9: South America Mhealth Apps Revenue Share (%), by Application 2025 & 2033
- Figure 10: South America Mhealth Apps Revenue (million), by Type 2025 & 2033
- Figure 11: South America Mhealth Apps Revenue Share (%), by Type 2025 & 2033
- Figure 12: South America Mhealth Apps Revenue (million), by Country 2025 & 2033
- Figure 13: South America Mhealth Apps Revenue Share (%), by Country 2025 & 2033
- Figure 14: Europe Mhealth Apps Revenue (million), by Application 2025 & 2033
- Figure 15: Europe Mhealth Apps Revenue Share (%), by Application 2025 & 2033
- Figure 16: Europe Mhealth Apps Revenue (million), by Type 2025 & 2033
- Figure 17: Europe Mhealth Apps Revenue Share (%), by Type 2025 & 2033
- Figure 18: Europe Mhealth Apps Revenue (million), by Country 2025 & 2033
- Figure 19: Europe Mhealth Apps Revenue Share (%), by Country 2025 & 2033
- Figure 20: Middle East & Africa Mhealth Apps Revenue (million), by Application 2025 & 2033
- Figure 21: Middle East & Africa Mhealth Apps Revenue Share (%), by Application 2025 & 2033
- Figure 22: Middle East & Africa Mhealth Apps Revenue (million), by Type 2025 & 2033
- Figure 23: Middle East & Africa Mhealth Apps Revenue Share (%), by Type 2025 & 2033
- Figure 24: Middle East & Africa Mhealth Apps Revenue (million), by Country 2025 & 2033
- Figure 25: Middle East & Africa Mhealth Apps Revenue Share (%), by Country 2025 & 2033
- Figure 26: Asia Pacific Mhealth Apps Revenue (million), by Application 2025 & 2033
- Figure 27: Asia Pacific Mhealth Apps Revenue Share (%), by Application 2025 & 2033
- Figure 28: Asia Pacific Mhealth Apps Revenue (million), by Type 2025 & 2033
- Figure 29: Asia Pacific Mhealth Apps Revenue Share (%), by Type 2025 & 2033
- Figure 30: Asia Pacific Mhealth Apps Revenue (million), by Country 2025 & 2033
- Figure 31: Asia Pacific Mhealth Apps Revenue Share (%), by Country 2025 & 2033
List of Tables
- Table 1: Global Mhealth Apps Revenue million Forecast, by Application 2020 & 2033
- Table 2: Global Mhealth Apps Revenue million Forecast, by Type 2020 & 2033
- Table 3: Global Mhealth Apps Revenue million Forecast, by Region 2020 & 2033
- Table 4: Global Mhealth Apps Revenue million Forecast, by Application 2020 & 2033
- Table 5: Global Mhealth Apps Revenue million Forecast, by Type 2020 & 2033
- Table 6: Global Mhealth Apps Revenue million Forecast, by Country 2020 & 2033
- Table 7: United States Mhealth Apps Revenue (million) Forecast, by Application 2020 & 2033
- Table 8: Canada Mhealth Apps Revenue (million) Forecast, by Application 2020 & 2033
- Table 9: Mexico Mhealth Apps Revenue (million) Forecast, by Application 2020 & 2033
- Table 10: Global Mhealth Apps Revenue million Forecast, by Application 2020 & 2033
- Table 11: Global Mhealth Apps Revenue million Forecast, by Type 2020 & 2033
- Table 12: Global Mhealth Apps Revenue million Forecast, by Country 2020 & 2033
- Table 13: Brazil Mhealth Apps Revenue (million) Forecast, by Application 2020 & 2033
- Table 14: Argentina Mhealth Apps Revenue (million) Forecast, by Application 2020 & 2033
- Table 15: Rest of South America Mhealth Apps Revenue (million) Forecast, by Application 2020 & 2033
- Table 16: Global Mhealth Apps Revenue million Forecast, by Application 2020 & 2033
- Table 17: Global Mhealth Apps Revenue million Forecast, by Type 2020 & 2033
- Table 18: Global Mhealth Apps Revenue million Forecast, by Country 2020 & 2033
- Table 19: United Kingdom Mhealth Apps Revenue (million) Forecast, by Application 2020 & 2033
- Table 20: Germany Mhealth Apps Revenue (million) Forecast, by Application 2020 & 2033
- Table 21: France Mhealth Apps Revenue (million) Forecast, by Application 2020 & 2033
- Table 22: Italy Mhealth Apps Revenue (million) Forecast, by Application 2020 & 2033
- Table 23: Spain Mhealth Apps Revenue (million) Forecast, by Application 2020 & 2033
- Table 24: Russia Mhealth Apps Revenue (million) Forecast, by Application 2020 & 2033
- Table 25: Benelux Mhealth Apps Revenue (million) Forecast, by Application 2020 & 2033
- Table 26: Nordics Mhealth Apps Revenue (million) Forecast, by Application 2020 & 2033
- Table 27: Rest of Europe Mhealth Apps Revenue (million) Forecast, by Application 2020 & 2033
- Table 28: Global Mhealth Apps Revenue million Forecast, by Application 2020 & 2033
- Table 29: Global Mhealth Apps Revenue million Forecast, by Type 2020 & 2033
- Table 30: Global Mhealth Apps Revenue million Forecast, by Country 2020 & 2033
- Table 31: Turkey Mhealth Apps Revenue (million) Forecast, by Application 2020 & 2033
- Table 32: Israel Mhealth Apps Revenue (million) Forecast, by Application 2020 & 2033
- Table 33: GCC Mhealth Apps Revenue (million) Forecast, by Application 2020 & 2033
- Table 34: North Africa Mhealth Apps Revenue (million) Forecast, by Application 2020 & 2033
- Table 35: South Africa Mhealth Apps Revenue (million) Forecast, by Application 2020 & 2033
- Table 36: Rest of Middle East & Africa Mhealth Apps Revenue (million) Forecast, by Application 2020 & 2033
- Table 37: Global Mhealth Apps Revenue million Forecast, by Application 2020 & 2033
- Table 38: Global Mhealth Apps Revenue million Forecast, by Type 2020 & 2033
- Table 39: Global Mhealth Apps Revenue million Forecast, by Country 2020 & 2033
- Table 40: China Mhealth Apps Revenue (million) Forecast, by Application 2020 & 2033
- Table 41: India Mhealth Apps Revenue (million) Forecast, by Application 2020 & 2033
- Table 42: Japan Mhealth Apps Revenue (million) Forecast, by Application 2020 & 2033
- Table 43: South Korea Mhealth Apps Revenue (million) Forecast, by Application 2020 & 2033
- Table 44: ASEAN Mhealth Apps Revenue (million) Forecast, by Application 2020 & 2033
- Table 45: Oceania Mhealth Apps Revenue (million) Forecast, by Application 2020 & 2033
- Table 46: Rest of Asia Pacific Mhealth Apps Revenue (million) Forecast, by Application 2020 & 2033
Frequently Asked Questions
1. What is the projected Compound Annual Growth Rate (CAGR) of the Mhealth Apps?
The projected CAGR is approximately 18.4%.
2. Which companies are prominent players in the Mhealth Apps?
Key companies in the market include Abbott Laboratories, Johnson and Johnson, AstraZeneca PLC, F. Hoffmann-La Roche Ltd., Novartis AG, Bristol-Myers Squibb Company, GlaxoSmithKline plc, Merck and Co., Inc., Pfizer, Inc., Sanofi.
3. What are the main segments of the Mhealth Apps?
The market segments include Application, Type.
4. Can you provide details about the market size?
The market size is estimated to be USD 137970 million as of 2022.
5. What are some drivers contributing to market growth?
N/A
6. What are the notable trends driving market growth?
N/A
7. Are there any restraints impacting market growth?
N/A
8. Can you provide examples of recent developments in the market?
N/A
9. What pricing options are available for accessing the report?
Pricing options include single-user, multi-user, and enterprise licenses priced at USD 2900.00, USD 4350.00, and USD 5800.00 respectively.
10. Is the market size provided in terms of value or volume?
The market size is provided in terms of value, measured in million.
11. Are there any specific market keywords associated with the report?
Yes, the market keyword associated with the report is "Mhealth Apps," which aids in identifying and referencing the specific market segment covered.
12. How do I determine which pricing option suits my needs best?
The pricing options vary based on user requirements and access needs. Individual users may opt for single-user licenses, while businesses requiring broader access may choose multi-user or enterprise licenses for cost-effective access to the report.
13. Are there any additional resources or data provided in the Mhealth Apps report?
While the report offers comprehensive insights, it's advisable to review the specific contents or supplementary materials provided to ascertain if additional resources or data are available.
14. How can I stay updated on further developments or reports in the Mhealth Apps?
To stay informed about further developments, trends, and reports in the Mhealth Apps, consider subscribing to industry newsletters, following relevant companies and organizations, or regularly checking reputable industry news sources and publications.
Methodology
Step 1 - Identification of Relevant Samples Size from Population Database


Step 2 - Approaches for Defining Global Market Size (Value, Volume* & Price*)

Note*: In applicable scenarios
Step 3 - Data Sources
Primary Research
- Web Analytics
- Survey Reports
- Research Institute
- Latest Research Reports
- Opinion Leaders
Secondary Research
- Annual Reports
- White Paper
- Latest Press Release
- Industry Association
- Paid Database
- Investor Presentations

Step 4 - Data Triangulation
Involves using different sources of information in order to increase the validity of a study
These sources are likely to be stakeholders in a program - participants, other researchers, program staff, other community members, and so on.
Then we put all data in single framework & apply various statistical tools to find out the dynamic on the market.
During the analysis stage, feedback from the stakeholder groups would be compared to determine areas of agreement as well as areas of divergence