

Key Insights
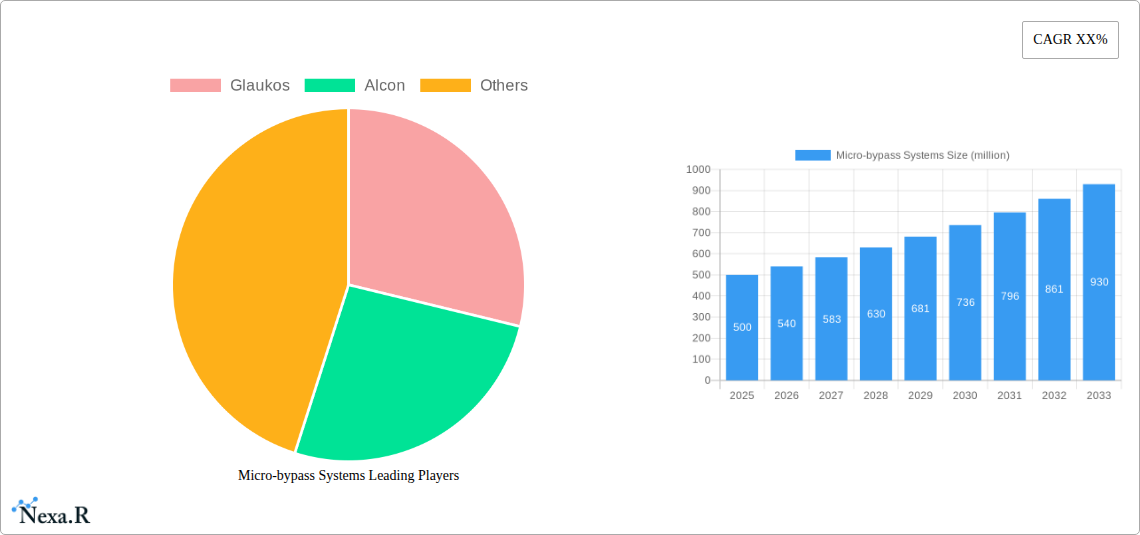
The global micro-bypass systems market is experiencing robust growth, driven by the increasing prevalence of glaucoma and the rising demand for minimally invasive surgical procedures. The market, estimated at $500 million in 2025, is projected to exhibit a compound annual growth rate (CAGR) of 8% from 2025 to 2033, reaching approximately $950 million by 2033. This growth is fueled by several key factors, including technological advancements leading to improved device efficacy and safety profiles, an aging global population with a higher incidence of glaucoma, and increasing awareness among ophthalmologists about the benefits of micro-bypass procedures compared to traditional glaucoma surgeries. Key players like Glaukos and Alcon are actively contributing to market expansion through continuous innovation and strategic partnerships. However, the market faces some challenges, such as the relatively high cost of procedures, the availability of alternative treatment options, and potential reimbursement hurdles in certain healthcare systems. Despite these challenges, the market is poised for significant growth, driven by the unmet clinical need for effective glaucoma management and the increasing adoption of minimally invasive surgical techniques.
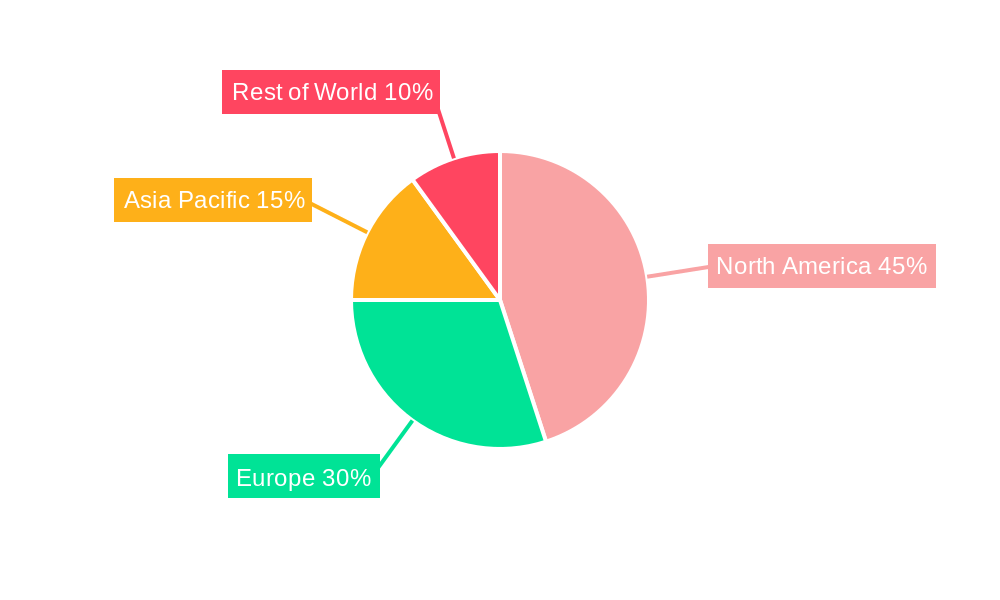
The market segmentation reveals a strong preference for certain types of micro-bypass systems depending on regional healthcare infrastructure and physician preferences. North America currently holds the largest market share, benefiting from advanced medical infrastructure and early adoption of new technologies. However, developing regions in Asia and Latin America are expected to witness significant growth in the coming years, driven by rising healthcare expenditure and increasing awareness of glaucoma management options. The continued expansion of minimally invasive surgery and the development of more advanced micro-bypass systems with enhanced efficacy and reduced invasiveness will further drive market growth. The competitive landscape features a mix of established players and emerging companies, leading to ongoing innovation and price competition, which ultimately benefits patients and healthcare systems.
Micro-bypass Systems Market Report: 2019-2033
This comprehensive report provides a detailed analysis of the global Micro-bypass Systems market, offering invaluable insights for industry professionals, investors, and strategic decision-makers. The study covers the period from 2019 to 2033, with a focus on the forecast period from 2025 to 2033, using 2025 as the base year and estimated year. The report leverages extensive primary and secondary research to deliver actionable intelligence across key market segments, including a granular examination of leading players like Glaukos and Alcon. This analysis incorporates crucial market sizing and forecasting, trend identification, and competitive landscape assessment, allowing stakeholders to navigate the complexities of this dynamic sector effectively.
Micro-bypass Systems Market Dynamics & Structure
The global Micro-bypass Systems market, valued at $xx million in 2024, is characterized by moderate concentration, with key players like Glaukos and Alcon holding significant market share. Technological innovation, particularly in minimally invasive surgical techniques and biocompatible materials, is a primary growth driver. Stringent regulatory frameworks, including those governing medical device approvals, influence market entry and product development. The market faces competition from alternative glaucoma treatment methods, impacting adoption rates. End-user demographics, primarily aging populations with increased prevalence of glaucoma, significantly influence demand. Consolidation through mergers and acquisitions (M&A) activities is observed, with xx M&A deals recorded between 2019 and 2024.
- Market Concentration: Moderately concentrated, with Glaukos and Alcon holding significant shares (xx% and xx%, respectively, estimated 2025).
- Technological Innovation: Focus on miniaturization, improved biocompatibility, and enhanced surgical precision.
- Regulatory Framework: Stringent approvals processes (e.g., FDA, CE Mark) impacting time-to-market and cost.
- Competitive Substitutes: Traditional glaucoma surgeries, medications, and other minimally invasive procedures.
- End-User Demographics: Aging population and rising glaucoma prevalence driving demand.
- M&A Activity: xx M&A deals between 2019 and 2024, indicating industry consolidation.
Micro-bypass Systems Growth Trends & Insights
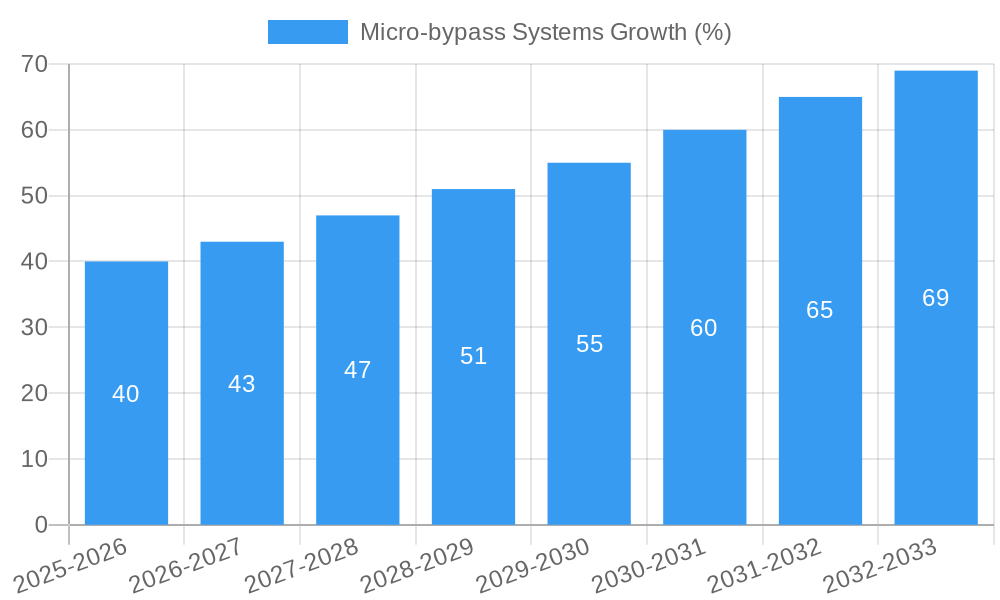
The Micro-bypass Systems market exhibits a steady growth trajectory, driven by increasing awareness of glaucoma, technological advancements, and favorable reimbursement policies in key regions. The market size is projected to reach $xx million by 2033, exhibiting a CAGR of xx% during the forecast period. Adoption rates are influenced by factors such as surgeon experience, patient suitability, and the availability of advanced technologies. Technological disruptions, such as the introduction of innovative surgical tools and improved imaging techniques, are accelerating market growth. Shifts in consumer behavior towards minimally invasive procedures are further contributing to market expansion. Market penetration is expected to increase from xx% in 2025 to xx% by 2033.
Dominant Regions, Countries, or Segments in Micro-bypass Systems
North America currently dominates the Micro-bypass Systems market, driven by high glaucoma prevalence, robust healthcare infrastructure, and early adoption of advanced technologies. Europe and Asia-Pacific are also witnessing significant growth, albeit at a slower pace compared to North America.
- North America: High prevalence of glaucoma, well-established healthcare infrastructure, and high healthcare expenditure.
- Europe: Growing awareness of minimally invasive procedures and increasing investments in healthcare technology.
- Asia-Pacific: Rising disposable incomes, increasing prevalence of glaucoma, and expanding healthcare sector.
The specific country level market shares for North America and Europe are xx% and xx% respectively. This high percentage showcases the current leading regions and their contributions to the market.
Micro-bypass Systems Product Landscape
Micro-bypass systems encompass a range of devices designed to improve aqueous humor outflow and reduce intraocular pressure. These devices vary in design, materials, and implantation techniques, offering surgeons and patients a choice based on individual needs. Key product innovations focus on improved biocompatibility, reduced invasiveness, and enhanced long-term efficacy. Unique selling propositions often include simplified surgical procedures, minimal recovery time, and better patient outcomes.
Key Drivers, Barriers & Challenges in Micro-bypass Systems
Key Drivers:
- Rising prevalence of glaucoma globally.
- Technological advancements leading to improved device efficacy and safety.
- Favorable reimbursement policies in several countries.
- Growing surgeon awareness and adoption of minimally invasive procedures.
Challenges & Restraints:
- High initial cost of devices limiting accessibility in certain regions.
- Stringent regulatory requirements leading to lengthy approval processes.
- Potential long-term complications associated with some devices.
- Competition from alternative glaucoma treatments. This competition is estimated to reduce market growth by approximately xx% by 2033.
Emerging Opportunities in Micro-bypass Systems
- Expansion into underserved markets, particularly in developing countries.
- Development of next-generation devices with enhanced features and functionalities.
- Focus on personalized medicine and tailored treatment approaches.
- Exploration of novel materials and manufacturing techniques to reduce costs and improve device performance.
Growth Accelerators in the Micro-bypass Systems Industry
Strategic partnerships between device manufacturers and healthcare providers are accelerating market growth by improving access to cutting-edge technologies and enhancing patient outcomes. Technological breakthroughs in materials science and surgical techniques are further driving innovation and market expansion. Focus on expanding into new geographic regions and enhancing product portfolios is also contributing to long-term growth.
Key Players Shaping the Micro-bypass Systems Market
Notable Milestones in Micro-bypass Systems Sector
- 2020: Glaukos receives FDA approval for a new micro-bypass device.
- 2022: Alcon launches a new generation of micro-bypass system with improved features.
- 2023: A significant clinical trial demonstrates the superior efficacy of a novel micro-bypass technology.
- 2024: A major strategic alliance is formed between two key players to accelerate innovation.
In-Depth Micro-bypass Systems Market Outlook
The Micro-bypass Systems market is poised for significant growth over the next decade, driven by a confluence of factors including technological advancements, increasing disease prevalence, and favorable regulatory environments. Strategic investments in research and development, coupled with focused marketing efforts, will be crucial for success in this competitive market. The potential for personalized medicine and innovative applications will further shape the future landscape of this dynamic sector.
Micro-bypass Systems Segmentation
-
1. Application
- 1.1. Hospital Outpatients
- 1.2. Clinics
- 1.3. Others
-
2. Types
- 2.1. Metal
- 2.2. Polymer
Micro-bypass Systems Segmentation By Geography
-
1. North America
- 1.1. United States
- 1.2. Canada
- 1.3. Mexico
-
2. South America
- 2.1. Brazil
- 2.2. Argentina
- 2.3. Rest of South America
-
3. Europe
- 3.1. United Kingdom
- 3.2. Germany
- 3.3. France
- 3.4. Italy
- 3.5. Spain
- 3.6. Russia
- 3.7. Benelux
- 3.8. Nordics
- 3.9. Rest of Europe
-
4. Middle East & Africa
- 4.1. Turkey
- 4.2. Israel
- 4.3. GCC
- 4.4. North Africa
- 4.5. South Africa
- 4.6. Rest of Middle East & Africa
-
5. Asia Pacific
- 5.1. China
- 5.2. India
- 5.3. Japan
- 5.4. South Korea
- 5.5. ASEAN
- 5.6. Oceania
- 5.7. Rest of Asia Pacific
Micro-bypass Systems REPORT HIGHLIGHTS
| Aspects | Details |
|---|---|
| Study Period | 2019-2033 |
| Base Year | 2024 |
| Estimated Year | 2025 |
| Forecast Period | 2025-2033 |
| Historical Period | 2019-2024 |
| Growth Rate | CAGR of XX% from 2019-2033 |
| Segmentation |
|
Table of Contents
- 1. Introduction
- 1.1. Research Scope
- 1.2. Market Segmentation
- 1.3. Research Methodology
- 1.4. Definitions and Assumptions
- 2. Executive Summary
- 2.1. Introduction
- 3. Market Dynamics
- 3.1. Introduction
- 3.2. Market Drivers
- 3.3. Market Restrains
- 3.4. Market Trends
- 4. Market Factor Analysis
- 4.1. Porters Five Forces
- 4.2. Supply/Value Chain
- 4.3. PESTEL analysis
- 4.4. Market Entropy
- 4.5. Patent/Trademark Analysis
- 5. Global Micro-bypass Systems Analysis, Insights and Forecast, 2019-2031
- 5.1. Market Analysis, Insights and Forecast - by Application
- 5.1.1. Hospital Outpatients
- 5.1.2. Clinics
- 5.1.3. Others
- 5.2. Market Analysis, Insights and Forecast - by Types
- 5.2.1. Metal
- 5.2.2. Polymer
- 5.3. Market Analysis, Insights and Forecast - by Region
- 5.3.1. North America
- 5.3.2. South America
- 5.3.3. Europe
- 5.3.4. Middle East & Africa
- 5.3.5. Asia Pacific
- 5.1. Market Analysis, Insights and Forecast - by Application
- 6. North America Micro-bypass Systems Analysis, Insights and Forecast, 2019-2031
- 6.1. Market Analysis, Insights and Forecast - by Application
- 6.1.1. Hospital Outpatients
- 6.1.2. Clinics
- 6.1.3. Others
- 6.2. Market Analysis, Insights and Forecast - by Types
- 6.2.1. Metal
- 6.2.2. Polymer
- 6.1. Market Analysis, Insights and Forecast - by Application
- 7. South America Micro-bypass Systems Analysis, Insights and Forecast, 2019-2031
- 7.1. Market Analysis, Insights and Forecast - by Application
- 7.1.1. Hospital Outpatients
- 7.1.2. Clinics
- 7.1.3. Others
- 7.2. Market Analysis, Insights and Forecast - by Types
- 7.2.1. Metal
- 7.2.2. Polymer
- 7.1. Market Analysis, Insights and Forecast - by Application
- 8. Europe Micro-bypass Systems Analysis, Insights and Forecast, 2019-2031
- 8.1. Market Analysis, Insights and Forecast - by Application
- 8.1.1. Hospital Outpatients
- 8.1.2. Clinics
- 8.1.3. Others
- 8.2. Market Analysis, Insights and Forecast - by Types
- 8.2.1. Metal
- 8.2.2. Polymer
- 8.1. Market Analysis, Insights and Forecast - by Application
- 9. Middle East & Africa Micro-bypass Systems Analysis, Insights and Forecast, 2019-2031
- 9.1. Market Analysis, Insights and Forecast - by Application
- 9.1.1. Hospital Outpatients
- 9.1.2. Clinics
- 9.1.3. Others
- 9.2. Market Analysis, Insights and Forecast - by Types
- 9.2.1. Metal
- 9.2.2. Polymer
- 9.1. Market Analysis, Insights and Forecast - by Application
- 10. Asia Pacific Micro-bypass Systems Analysis, Insights and Forecast, 2019-2031
- 10.1. Market Analysis, Insights and Forecast - by Application
- 10.1.1. Hospital Outpatients
- 10.1.2. Clinics
- 10.1.3. Others
- 10.2. Market Analysis, Insights and Forecast - by Types
- 10.2.1. Metal
- 10.2.2. Polymer
- 10.1. Market Analysis, Insights and Forecast - by Application
- 11. Competitive Analysis
- 11.1. Global Market Share Analysis 2024
- 11.2. Company Profiles
- 11.2.1 Glaukos
- 11.2.1.1. Overview
- 11.2.1.2. Products
- 11.2.1.3. SWOT Analysis
- 11.2.1.4. Recent Developments
- 11.2.1.5. Financials (Based on Availability)
- 11.2.2 Alcon
- 11.2.2.1. Overview
- 11.2.2.2. Products
- 11.2.2.3. SWOT Analysis
- 11.2.2.4. Recent Developments
- 11.2.2.5. Financials (Based on Availability)
- 11.2.1 Glaukos
List of Figures
- Figure 1: Global Micro-bypass Systems Revenue Breakdown (million, %) by Region 2024 & 2032
- Figure 2: North America Micro-bypass Systems Revenue (million), by Application 2024 & 2032
- Figure 3: North America Micro-bypass Systems Revenue Share (%), by Application 2024 & 2032
- Figure 4: North America Micro-bypass Systems Revenue (million), by Types 2024 & 2032
- Figure 5: North America Micro-bypass Systems Revenue Share (%), by Types 2024 & 2032
- Figure 6: North America Micro-bypass Systems Revenue (million), by Country 2024 & 2032
- Figure 7: North America Micro-bypass Systems Revenue Share (%), by Country 2024 & 2032
- Figure 8: South America Micro-bypass Systems Revenue (million), by Application 2024 & 2032
- Figure 9: South America Micro-bypass Systems Revenue Share (%), by Application 2024 & 2032
- Figure 10: South America Micro-bypass Systems Revenue (million), by Types 2024 & 2032
- Figure 11: South America Micro-bypass Systems Revenue Share (%), by Types 2024 & 2032
- Figure 12: South America Micro-bypass Systems Revenue (million), by Country 2024 & 2032
- Figure 13: South America Micro-bypass Systems Revenue Share (%), by Country 2024 & 2032
- Figure 14: Europe Micro-bypass Systems Revenue (million), by Application 2024 & 2032
- Figure 15: Europe Micro-bypass Systems Revenue Share (%), by Application 2024 & 2032
- Figure 16: Europe Micro-bypass Systems Revenue (million), by Types 2024 & 2032
- Figure 17: Europe Micro-bypass Systems Revenue Share (%), by Types 2024 & 2032
- Figure 18: Europe Micro-bypass Systems Revenue (million), by Country 2024 & 2032
- Figure 19: Europe Micro-bypass Systems Revenue Share (%), by Country 2024 & 2032
- Figure 20: Middle East & Africa Micro-bypass Systems Revenue (million), by Application 2024 & 2032
- Figure 21: Middle East & Africa Micro-bypass Systems Revenue Share (%), by Application 2024 & 2032
- Figure 22: Middle East & Africa Micro-bypass Systems Revenue (million), by Types 2024 & 2032
- Figure 23: Middle East & Africa Micro-bypass Systems Revenue Share (%), by Types 2024 & 2032
- Figure 24: Middle East & Africa Micro-bypass Systems Revenue (million), by Country 2024 & 2032
- Figure 25: Middle East & Africa Micro-bypass Systems Revenue Share (%), by Country 2024 & 2032
- Figure 26: Asia Pacific Micro-bypass Systems Revenue (million), by Application 2024 & 2032
- Figure 27: Asia Pacific Micro-bypass Systems Revenue Share (%), by Application 2024 & 2032
- Figure 28: Asia Pacific Micro-bypass Systems Revenue (million), by Types 2024 & 2032
- Figure 29: Asia Pacific Micro-bypass Systems Revenue Share (%), by Types 2024 & 2032
- Figure 30: Asia Pacific Micro-bypass Systems Revenue (million), by Country 2024 & 2032
- Figure 31: Asia Pacific Micro-bypass Systems Revenue Share (%), by Country 2024 & 2032
List of Tables
- Table 1: Global Micro-bypass Systems Revenue million Forecast, by Region 2019 & 2032
- Table 2: Global Micro-bypass Systems Revenue million Forecast, by Application 2019 & 2032
- Table 3: Global Micro-bypass Systems Revenue million Forecast, by Types 2019 & 2032
- Table 4: Global Micro-bypass Systems Revenue million Forecast, by Region 2019 & 2032
- Table 5: Global Micro-bypass Systems Revenue million Forecast, by Application 2019 & 2032
- Table 6: Global Micro-bypass Systems Revenue million Forecast, by Types 2019 & 2032
- Table 7: Global Micro-bypass Systems Revenue million Forecast, by Country 2019 & 2032
- Table 8: United States Micro-bypass Systems Revenue (million) Forecast, by Application 2019 & 2032
- Table 9: Canada Micro-bypass Systems Revenue (million) Forecast, by Application 2019 & 2032
- Table 10: Mexico Micro-bypass Systems Revenue (million) Forecast, by Application 2019 & 2032
- Table 11: Global Micro-bypass Systems Revenue million Forecast, by Application 2019 & 2032
- Table 12: Global Micro-bypass Systems Revenue million Forecast, by Types 2019 & 2032
- Table 13: Global Micro-bypass Systems Revenue million Forecast, by Country 2019 & 2032
- Table 14: Brazil Micro-bypass Systems Revenue (million) Forecast, by Application 2019 & 2032
- Table 15: Argentina Micro-bypass Systems Revenue (million) Forecast, by Application 2019 & 2032
- Table 16: Rest of South America Micro-bypass Systems Revenue (million) Forecast, by Application 2019 & 2032
- Table 17: Global Micro-bypass Systems Revenue million Forecast, by Application 2019 & 2032
- Table 18: Global Micro-bypass Systems Revenue million Forecast, by Types 2019 & 2032
- Table 19: Global Micro-bypass Systems Revenue million Forecast, by Country 2019 & 2032
- Table 20: United Kingdom Micro-bypass Systems Revenue (million) Forecast, by Application 2019 & 2032
- Table 21: Germany Micro-bypass Systems Revenue (million) Forecast, by Application 2019 & 2032
- Table 22: France Micro-bypass Systems Revenue (million) Forecast, by Application 2019 & 2032
- Table 23: Italy Micro-bypass Systems Revenue (million) Forecast, by Application 2019 & 2032
- Table 24: Spain Micro-bypass Systems Revenue (million) Forecast, by Application 2019 & 2032
- Table 25: Russia Micro-bypass Systems Revenue (million) Forecast, by Application 2019 & 2032
- Table 26: Benelux Micro-bypass Systems Revenue (million) Forecast, by Application 2019 & 2032
- Table 27: Nordics Micro-bypass Systems Revenue (million) Forecast, by Application 2019 & 2032
- Table 28: Rest of Europe Micro-bypass Systems Revenue (million) Forecast, by Application 2019 & 2032
- Table 29: Global Micro-bypass Systems Revenue million Forecast, by Application 2019 & 2032
- Table 30: Global Micro-bypass Systems Revenue million Forecast, by Types 2019 & 2032
- Table 31: Global Micro-bypass Systems Revenue million Forecast, by Country 2019 & 2032
- Table 32: Turkey Micro-bypass Systems Revenue (million) Forecast, by Application 2019 & 2032
- Table 33: Israel Micro-bypass Systems Revenue (million) Forecast, by Application 2019 & 2032
- Table 34: GCC Micro-bypass Systems Revenue (million) Forecast, by Application 2019 & 2032
- Table 35: North Africa Micro-bypass Systems Revenue (million) Forecast, by Application 2019 & 2032
- Table 36: South Africa Micro-bypass Systems Revenue (million) Forecast, by Application 2019 & 2032
- Table 37: Rest of Middle East & Africa Micro-bypass Systems Revenue (million) Forecast, by Application 2019 & 2032
- Table 38: Global Micro-bypass Systems Revenue million Forecast, by Application 2019 & 2032
- Table 39: Global Micro-bypass Systems Revenue million Forecast, by Types 2019 & 2032
- Table 40: Global Micro-bypass Systems Revenue million Forecast, by Country 2019 & 2032
- Table 41: China Micro-bypass Systems Revenue (million) Forecast, by Application 2019 & 2032
- Table 42: India Micro-bypass Systems Revenue (million) Forecast, by Application 2019 & 2032
- Table 43: Japan Micro-bypass Systems Revenue (million) Forecast, by Application 2019 & 2032
- Table 44: South Korea Micro-bypass Systems Revenue (million) Forecast, by Application 2019 & 2032
- Table 45: ASEAN Micro-bypass Systems Revenue (million) Forecast, by Application 2019 & 2032
- Table 46: Oceania Micro-bypass Systems Revenue (million) Forecast, by Application 2019 & 2032
- Table 47: Rest of Asia Pacific Micro-bypass Systems Revenue (million) Forecast, by Application 2019 & 2032
Frequently Asked Questions
1. What is the projected Compound Annual Growth Rate (CAGR) of the Micro-bypass Systems?
The projected CAGR is approximately XX%.
2. Which companies are prominent players in the Micro-bypass Systems?
Key companies in the market include Glaukos, Alcon.
3. What are the main segments of the Micro-bypass Systems?
The market segments include Application, Types.
4. Can you provide details about the market size?
The market size is estimated to be USD XXX million as of 2022.
5. What are some drivers contributing to market growth?
N/A
6. What are the notable trends driving market growth?
N/A
7. Are there any restraints impacting market growth?
N/A
8. Can you provide examples of recent developments in the market?
N/A
9. What pricing options are available for accessing the report?
Pricing options include single-user, multi-user, and enterprise licenses priced at USD 3950.00, USD 5925.00, and USD 7900.00 respectively.
10. Is the market size provided in terms of value or volume?
The market size is provided in terms of value, measured in million.
11. Are there any specific market keywords associated with the report?
Yes, the market keyword associated with the report is "Micro-bypass Systems," which aids in identifying and referencing the specific market segment covered.
12. How do I determine which pricing option suits my needs best?
The pricing options vary based on user requirements and access needs. Individual users may opt for single-user licenses, while businesses requiring broader access may choose multi-user or enterprise licenses for cost-effective access to the report.
13. Are there any additional resources or data provided in the Micro-bypass Systems report?
While the report offers comprehensive insights, it's advisable to review the specific contents or supplementary materials provided to ascertain if additional resources or data are available.
14. How can I stay updated on further developments or reports in the Micro-bypass Systems?
To stay informed about further developments, trends, and reports in the Micro-bypass Systems, consider subscribing to industry newsletters, following relevant companies and organizations, or regularly checking reputable industry news sources and publications.
Methodology
Step 1 - Identification of Relevant Samples Size from Population Database


Step 2 - Approaches for Defining Global Market Size (Value, Volume* & Price*)

Note*: In applicable scenarios
Step 3 - Data Sources
Primary Research
- Web Analytics
- Survey Reports
- Research Institute
- Latest Research Reports
- Opinion Leaders
Secondary Research
- Annual Reports
- White Paper
- Latest Press Release
- Industry Association
- Paid Database
- Investor Presentations

Step 4 - Data Triangulation
Involves using different sources of information in order to increase the validity of a study
These sources are likely to be stakeholders in a program - participants, other researchers, program staff, other community members, and so on.
Then we put all data in single framework & apply various statistical tools to find out the dynamic on the market.
During the analysis stage, feedback from the stakeholder groups would be compared to determine areas of agreement as well as areas of divergence
