

Key Insights
The Monoclonal Antibody Therapy market is projected for substantial growth, anticipated to reach $264.33 billion by 2025, driven by a CAGR of 16.24%. This expansion is primarily attributed to the rising incidence of chronic conditions including hematological disorders, autoimmune diseases, and cancers. Monoclonal antibodies offer enhanced efficacy and fewer side effects compared to conventional treatments, establishing them as a preferred therapeutic choice. Advancements in biotechnology, manufacturing processes, and a robust R&D pipeline further support market growth. Supportive regulatory frameworks and escalating global healthcare spending also contribute to a positive market outlook.
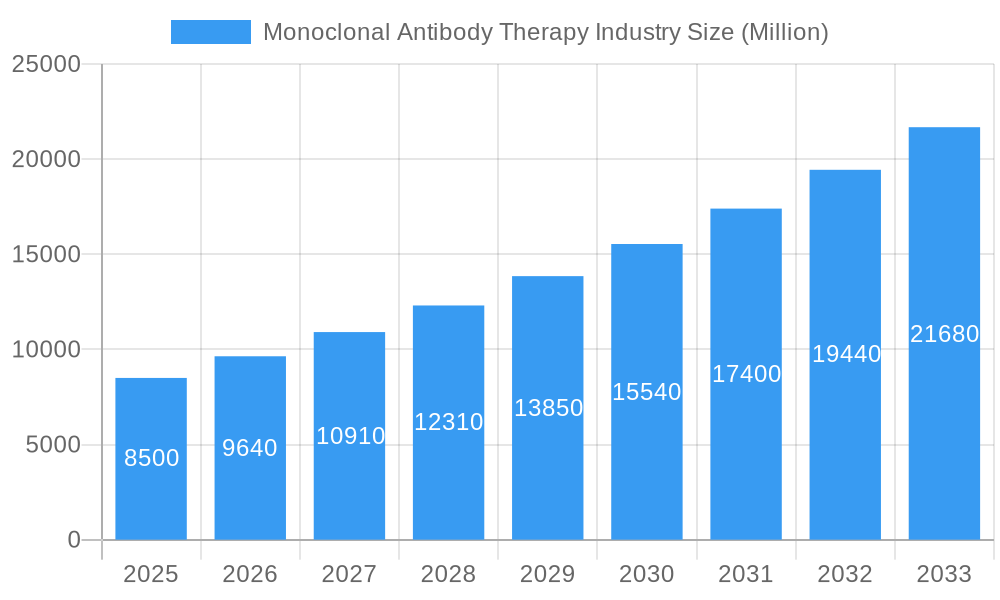
Monoclonal Antibody Therapy Industry Market Size (In Billion)
Key application segments include hematological diseases and cancer, with autoimmune disease treatments showing significant growth potential. Human and Humanized antibodies lead in terms of source due to their reduced immunogenicity and improved specificity. Hospitals are the dominant end-users, supported by advanced infrastructure and specialized healthcare professionals, with private clinics following. Geographically, North America and Europe are expected to retain leadership, while the Asia Pacific region is emerging as a high-growth market due to its vast patient population, increasing healthcare investments, and expanding pharmaceutical sector. The competitive environment is characterized by major pharmaceutical and biotechnology firms engaging in strategic partnerships and M&A activities to broaden their product offerings and market influence.
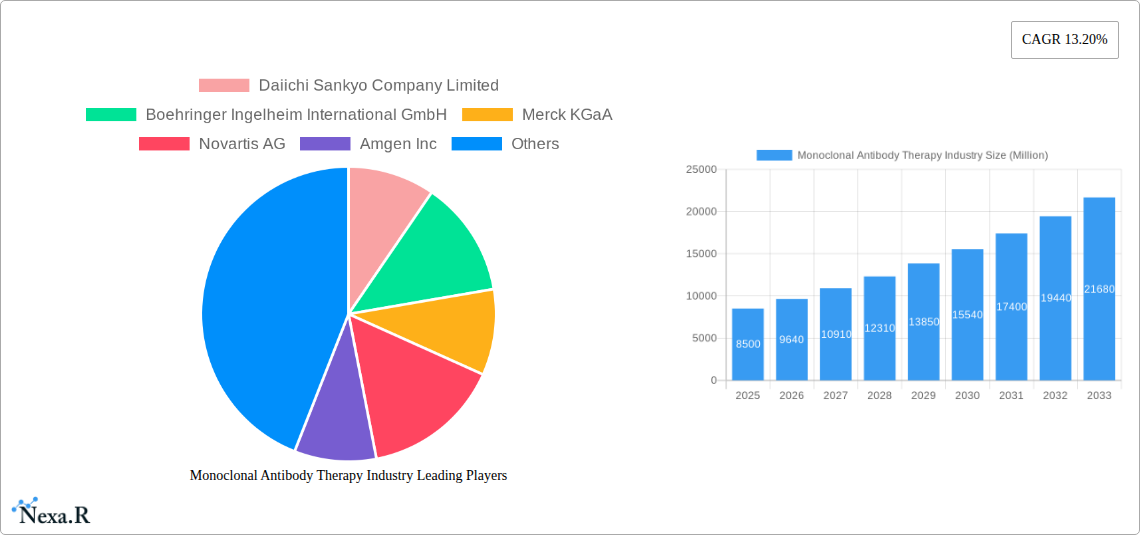
Monoclonal Antibody Therapy Industry Company Market Share
Monoclonal Antibody Therapy Industry Market Dynamics & Structure
The Monoclonal Antibody Therapy market is characterized by a dynamic interplay of intense technological innovation, stringent regulatory oversight, and a highly concentrated competitive landscape. Leading pharmaceutical giants such as F Hoffmann-La Roche Ltd, Amgen Inc, AbbVie Inc, Johnson & Johnson, Pfizer Inc, Novartis AG, Daiichi Sankyo Company Limited, Merck KGaA, Boehringer Ingelheim International GmbH, and UCB S A Belgium (UCB Inc) dominate this sector, driving significant advancements and holding substantial market share. The market's growth is propelled by the increasing prevalence of chronic diseases like cancer and autoimmune disorders, alongside a growing demand for targeted therapies.
- Market Concentration: Dominated by a few major players, leading to a competitive but consolidated market structure.
- Technological Innovation Drivers: Advancements in genetic engineering, bioprocessing, and drug delivery systems are crucial for developing novel and more effective monoclonal antibodies.
- Regulatory Frameworks: Approval processes by bodies like the FDA and EMA are critical, influencing R&D timelines and market access.
- Competitive Product Substitutes: While monoclonal antibodies offer targeted efficacy, other therapeutic classes, including small molecules and gene therapies, present alternative treatment options.
- End-User Demographics: The growing elderly population and increasing diagnosis rates of target diseases fuel demand.
- M&A Trends: Strategic acquisitions and collaborations are common as companies seek to expand their portfolios and leverage new technologies, aiming to secure a larger share of the projected $XX billion market by 2033.
Monoclonal Antibody Therapy Industry Growth Trends & Insights
The Monoclonal Antibody Therapy industry is poised for exceptional growth, projected to witness a Compound Annual Growth Rate (CAGR) of approximately 12.5% from 2025 to 2033, expanding from an estimated XX billion units in the base year of 2025. This robust expansion is largely attributed to the escalating global burden of chronic diseases, particularly in the Hematological Diseases, Autoimmune Diseases, and Cancer segments. The increasing sophistication of biotechnology and the continuous pipeline of novel antibody-based drugs are key drivers, enhancing treatment efficacy and patient outcomes. The shift towards personalized medicine further fuels demand, as monoclonal antibodies offer highly targeted therapeutic approaches, minimizing off-target effects and improving patient response rates.
Technological advancements in areas like bispecific antibodies, antibody-drug conjugates (ADCs), and fragment-based antibody engineering are revolutionizing treatment paradigms. For instance, the development of ADCs, which combine the specificity of antibodies with the cytotoxic power of chemotherapy drugs, has opened new avenues for treating various cancers. Furthermore, breakthroughs in biomanufacturing processes are contributing to improved scalability and cost-effectiveness, making these advanced therapies more accessible.
Consumer behavior is also playing a pivotal role. Patients and healthcare providers are increasingly opting for therapies with higher success rates and fewer side effects, a characteristic often associated with well-developed monoclonal antibody treatments. The growing awareness of these therapeutic benefits, coupled with increasing healthcare expenditure in both developed and emerging economies, is creating a fertile ground for market penetration. Adoption rates are expected to surge as clinical trial data demonstrating superior efficacy and safety profiles continue to emerge. The market's trajectory is further supported by supportive government initiatives and a growing emphasis on research and development by key industry players. The estimated market size is projected to reach over $XX billion units by 2033, underscoring the immense potential and sustained demand for these life-saving therapies.
Dominant Regions, Countries, or Segments in Monoclonal Antibody Therapy Industry
The Monoclonal Antibody Therapy industry's global dominance is multifaceted, with specific regions, countries, and application segments spearheading market growth. North America, particularly the United States, currently holds a leading position, driven by its advanced healthcare infrastructure, substantial R&D investments, and a high prevalence of target diseases like cancer and autoimmune disorders. The region's robust regulatory framework, exemplified by the FDA's proactive stance on drug approvals, further accelerates the commercialization of innovative therapies.
The Cancer application segment is unequivocally the most dominant driver of market growth. The increasing incidence of various cancers globally, coupled with the development of highly effective antibody-based immunotherapies and targeted treatments, has positioned this segment at the forefront. For example, the use of monoclonal antibodies in treating lung cancer, breast cancer, and hematological malignancies has seen remarkable success, significantly improving patient survival rates and quality of life. The market share within the Cancer segment alone is estimated to be over 45% of the total market value.
Within the application segments, Autoimmune Diseases are rapidly gaining traction as a significant growth area. Conditions like rheumatoid arthritis, inflammatory bowel disease, and psoriasis, which are often chronic and debilitating, are increasingly managed with monoclonal antibody therapies. The development of antibodies targeting specific inflammatory pathways has led to more effective and well-tolerated treatments, driving adoption.
The Humanized source segment is also a major contributor to market expansion. These antibodies, engineered to closely resemble human antibodies, exhibit reduced immunogenicity and enhanced therapeutic efficacy compared to their chimeric or murine counterparts. This technological advancement has been instrumental in the success of many blockbuster monoclonal antibody drugs.
- Key Drivers in North America:
- High disposable income and robust healthcare spending.
- Significant presence of leading pharmaceutical and biotechnology companies.
- Extensive clinical trial infrastructure and early adoption of new technologies.
- Favorable reimbursement policies for advanced therapies.
- Dominance Factors in the Cancer Segment:
- High unmet medical need and global cancer burden.
- Continuous innovation in immunotherapy and targeted cancer treatments.
- Strong pipeline of novel antibody-drug conjugates (ADCs) and bispecific antibodies.
- Positive clinical trial outcomes and expanding indications.
- Growth Potential in Autoimmune Diseases:
- Rising prevalence of chronic inflammatory conditions.
- Development of targeted biologics offering superior efficacy.
- Increasing patient awareness and demand for effective long-term management.
Monoclonal Antibody Therapy Industry Product Landscape
The Monoclonal Antibody Therapy industry is characterized by a diverse and rapidly evolving product landscape, focusing on highly targeted and efficacious treatments. Innovations are centered around enhancing specificity, reducing immunogenicity, and expanding therapeutic applications. Leading products include antibody-drug conjugates (ADCs) that deliver potent cytotoxins directly to cancer cells, and bispecific antibodies capable of engaging multiple targets simultaneously for improved therapeutic outcomes. Advancements in humanized and fully human antibodies continue to be a cornerstone, minimizing adverse reactions and maximizing patient tolerance. These products are meticulously engineered for applications across Hematological Diseases, Autoimmune Diseases, and various Cancers, demonstrating significant improvements in patient survival rates and disease management.
Key Drivers, Barriers & Challenges in Monoclonal Antibody Therapy Industry
The Monoclonal Antibody Therapy industry is propelled by several key drivers, including the escalating global burden of chronic diseases, particularly cancers and autoimmune disorders, coupled with significant advancements in biotechnology and genetic engineering. The increasing demand for targeted therapies with improved efficacy and reduced side effects further fuels market expansion. Supportive government initiatives, growing healthcare expenditure, and extensive R&D investments by leading pharmaceutical companies are also critical growth accelerators.
- Key Drivers:
- Rising prevalence of cancer and autoimmune diseases.
- Technological breakthroughs in antibody engineering and biomanufacturing.
- Growing preference for targeted therapies.
- Favorable reimbursement policies in developed nations.
However, the industry faces substantial barriers and challenges. The high cost of development and manufacturing of monoclonal antibodies presents a significant hurdle to accessibility, particularly in developing economies. Stringent regulatory approval processes, while ensuring safety and efficacy, can lead to prolonged market entry timelines. Furthermore, the emergence of biosimil competition and the need for continuous innovation to stay ahead of evolving disease mechanisms pose ongoing competitive pressures. Supply chain complexities for biologics and the potential for immunogenicity also present persistent challenges.
- Barriers & Challenges:
- High manufacturing and development costs.
- Complex and lengthy regulatory approval pathways.
- Potential for biosimilar competition.
- Supply chain vulnerabilities for biologics.
- Managing immunogenicity and adverse effects.
Emerging Opportunities in Monoclonal Antibody Therapy Industry
Emerging opportunities in the Monoclonal Antibody Therapy industry lie in expanding the therapeutic applications beyond established areas. The development of antibodies for rare diseases and neurodegenerative disorders, such as Alzheimer's disease, represents a significant untapped market. Furthermore, the integration of artificial intelligence (AI) and machine learning in drug discovery and development is accelerating the identification of novel antibody targets and the design of more potent and specific therapeutic agents. The growing adoption of antibody-drug conjugates (ADCs) for a wider range of solid tumors and the exploration of novel antibody formats like bispecific antibodies to overcome drug resistance are also key growth avenues.
Growth Accelerators in the Monoclonal Antibody Therapy Industry Industry
The long-term growth of the Monoclonal Antibody Therapy industry is significantly accelerated by continuous technological breakthroughs and strategic market expansion initiatives. The development of next-generation antibody formats, such as antibody-drug conjugates (ADCs) and bispecific antibodies, is unlocking new therapeutic possibilities and improving treatment outcomes across various disease areas. Furthermore, strategic partnerships and collaborations between pharmaceutical giants and smaller biotechnology firms are fostering innovation and accelerating the pipeline of novel drug candidates. Market expansion into emerging economies, driven by increasing healthcare expenditure and a growing awareness of advanced treatment options, represents another crucial growth catalyst.
Key Players Shaping the Monoclonal Antibody Therapy Industry Market
- Daiichi Sankyo Company Limited
- Boehringer Ingelheim International GmbH
- Merck KGaA
- Novartis AG
- Amgen Inc
- F Hoffmann-La Roche Ltd
- UCB S A Belgium (UCB Inc)
- AbbVie Inc
- Johnson & Johnson
- Pfizer Inc
Notable Milestones in Monoclonal Antibody Therapy Industry Sector
- September 2022: AstraZeneca's Evusheld (tixagevimab and cilgavimab, formerly AZD7442), a long-acting antibody combination, was recommended for marketing authorization in the European Union (EU) for the treatment of adults and adolescents (aged 12 years and older weighing at least 40 kg) with COVID19 who do not require supplemental oxygen and who are at increased risk of progressing to severe COVID19.
- February 2022: The United States Food and Drug Administration (FDA) issued an Emergency Use Authorization (EUA) for bebtelovimab, an antibody demonstrating neutralization against the Omicron variant developed by Eli Lilly and Company.
In-Depth Monoclonal Antibody Therapy Industry Market Outlook
The future outlook for the Monoclonal Antibody Therapy industry is exceptionally promising, driven by a confluence of factors that will continue to propel its expansion. Key growth accelerators include the relentless pursuit of innovation in antibody engineering, leading to the development of more potent and targeted therapies for complex diseases like cancer and neurodegenerative disorders. Strategic alliances and acquisitions among major players will further consolidate the market and foster the rapid commercialization of breakthrough treatments. As healthcare systems globally recognize the value of these advanced biologics, market penetration is expected to deepen, particularly in emerging economies where the unmet medical need is substantial. The increasing integration of artificial intelligence in drug discovery and development promises to accelerate R&D timelines and identify novel therapeutic targets, ensuring a robust pipeline of future treatments.
Monoclonal Antibody Therapy Industry Segmentation
-
1. Application
- 1.1. Hematological Diseases
- 1.2. Autoimmune Diseases
- 1.3. Cancer
- 1.4. Others
-
2. Source
- 2.1. Human
- 2.2. Humanized
- 2.3. Chimeric
- 2.4. Others
-
3. End-user
- 3.1. Hospitals
- 3.2. Private Clinics
- 3.3. Others
Monoclonal Antibody Therapy Industry Segmentation By Geography
-
1. North America
- 1.1. United States
- 1.2. Canada
- 1.3. Mexico
-
2. Europe
- 2.1. Germany
- 2.2. United Kingdom
- 2.3. France
- 2.4. Italy
- 2.5. Spain
- 2.6. Rest of Europe
-
3. Asia Pacific
- 3.1. China
- 3.2. Japan
- 3.3. India
- 3.4. Australia
- 3.5. South Korea
- 3.6. Rest of Asia Pacific
-
4. Middle East and Africa
- 4.1. GCC
- 4.2. South Africa
- 4.3. Rest of Middle East and Africa
-
5. South America
- 5.1. Brazil
- 5.2. Argentina
- 5.3. Rest of South America
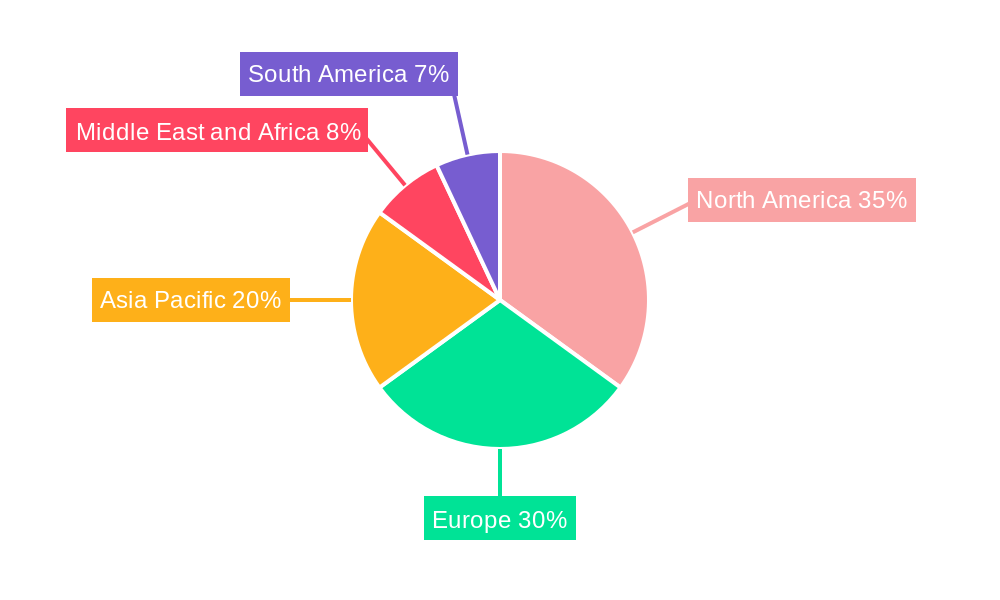
Monoclonal Antibody Therapy Industry Regional Market Share
Geographic Coverage of Monoclonal Antibody Therapy Industry
Monoclonal Antibody Therapy Industry REPORT HIGHLIGHTS
| Aspects | Details |
|---|---|
| Study Period | 2020-2034 |
| Base Year | 2025 |
| Estimated Year | 2026 |
| Forecast Period | 2026-2034 |
| Historical Period | 2020-2025 |
| Growth Rate | CAGR of 16.24% from 2020-2034 |
| Segmentation |
|
Table of Contents
- 1. Introduction
- 1.1. Research Scope
- 1.2. Market Segmentation
- 1.3. Research Objective
- 1.4. Definitions and Assumptions
- 2. Executive Summary
- 2.1. Market Snapshot
- 3. Market Dynamics
- 3.1. Market Drivers
- 3.2. Market Restrains
- 3.3. Market Trends
- 3.4. Market Opportunities
- 4. Market Factor Analysis
- 4.1. Porters Five Forces
- 4.1.1. Bargaining Power of Suppliers
- 4.1.2. Bargaining Power of Buyers
- 4.1.3. Threat of New Entrants
- 4.1.4. Threat of Substitutes
- 4.1.5. Competitive Rivalry
- 4.2. PESTEL analysis
- 4.3. BCG Analysis
- 4.3.1. Stars (High Growth, High Market Share)
- 4.3.2. Cash Cows (Low Growth, High Market Share)
- 4.3.3. Question Mark (High Growth, Low Market Share)
- 4.3.4. Dogs (Low Growth, Low Market Share)
- 4.4. Ansoff Matrix Analysis
- 4.5. Supply Chain Analysis
- 4.6. Regulatory Landscape
- 4.7. Current Market Potential and Opportunity Assessment (TAM–SAM–SOM Framework)
- 4.8. NRP Analyst Note
- 4.1. Porters Five Forces
- 5. Market Analysis, Insights and Forecast 2021-2033
- 5.1. Market Analysis, Insights and Forecast - by Application
- 5.1.1. Hematological Diseases
- 5.1.2. Autoimmune Diseases
- 5.1.3. Cancer
- 5.1.4. Others
- 5.2. Market Analysis, Insights and Forecast - by Source
- 5.2.1. Human
- 5.2.2. Humanized
- 5.2.3. Chimeric
- 5.2.4. Others
- 5.3. Market Analysis, Insights and Forecast - by End-user
- 5.3.1. Hospitals
- 5.3.2. Private Clinics
- 5.3.3. Others
- 5.4. Market Analysis, Insights and Forecast - by Region
- 5.4.1. North America
- 5.4.2. Europe
- 5.4.3. Asia Pacific
- 5.4.4. Middle East and Africa
- 5.4.5. South America
- 5.1. Market Analysis, Insights and Forecast - by Application
- 6. Global Monoclonal Antibody Therapy Industry Analysis, Insights and Forecast, 2021-2033
- 6.1. Market Analysis, Insights and Forecast - by Application
- 6.1.1. Hematological Diseases
- 6.1.2. Autoimmune Diseases
- 6.1.3. Cancer
- 6.1.4. Others
- 6.2. Market Analysis, Insights and Forecast - by Source
- 6.2.1. Human
- 6.2.2. Humanized
- 6.2.3. Chimeric
- 6.2.4. Others
- 6.3. Market Analysis, Insights and Forecast - by End-user
- 6.3.1. Hospitals
- 6.3.2. Private Clinics
- 6.3.3. Others
- 6.1. Market Analysis, Insights and Forecast - by Application
- 7. North America Monoclonal Antibody Therapy Industry Analysis, Insights and Forecast, 2020-2032
- 7.1. Market Analysis, Insights and Forecast - by Application
- 7.1.1. Hematological Diseases
- 7.1.2. Autoimmune Diseases
- 7.1.3. Cancer
- 7.1.4. Others
- 7.2. Market Analysis, Insights and Forecast - by Source
- 7.2.1. Human
- 7.2.2. Humanized
- 7.2.3. Chimeric
- 7.2.4. Others
- 7.3. Market Analysis, Insights and Forecast - by End-user
- 7.3.1. Hospitals
- 7.3.2. Private Clinics
- 7.3.3. Others
- 7.1. Market Analysis, Insights and Forecast - by Application
- 8. Europe Monoclonal Antibody Therapy Industry Analysis, Insights and Forecast, 2020-2032
- 8.1. Market Analysis, Insights and Forecast - by Application
- 8.1.1. Hematological Diseases
- 8.1.2. Autoimmune Diseases
- 8.1.3. Cancer
- 8.1.4. Others
- 8.2. Market Analysis, Insights and Forecast - by Source
- 8.2.1. Human
- 8.2.2. Humanized
- 8.2.3. Chimeric
- 8.2.4. Others
- 8.3. Market Analysis, Insights and Forecast - by End-user
- 8.3.1. Hospitals
- 8.3.2. Private Clinics
- 8.3.3. Others
- 8.1. Market Analysis, Insights and Forecast - by Application
- 9. Asia Pacific Monoclonal Antibody Therapy Industry Analysis, Insights and Forecast, 2020-2032
- 9.1. Market Analysis, Insights and Forecast - by Application
- 9.1.1. Hematological Diseases
- 9.1.2. Autoimmune Diseases
- 9.1.3. Cancer
- 9.1.4. Others
- 9.2. Market Analysis, Insights and Forecast - by Source
- 9.2.1. Human
- 9.2.2. Humanized
- 9.2.3. Chimeric
- 9.2.4. Others
- 9.3. Market Analysis, Insights and Forecast - by End-user
- 9.3.1. Hospitals
- 9.3.2. Private Clinics
- 9.3.3. Others
- 9.1. Market Analysis, Insights and Forecast - by Application
- 10. Middle East and Africa Monoclonal Antibody Therapy Industry Analysis, Insights and Forecast, 2020-2032
- 10.1. Market Analysis, Insights and Forecast - by Application
- 10.1.1. Hematological Diseases
- 10.1.2. Autoimmune Diseases
- 10.1.3. Cancer
- 10.1.4. Others
- 10.2. Market Analysis, Insights and Forecast - by Source
- 10.2.1. Human
- 10.2.2. Humanized
- 10.2.3. Chimeric
- 10.2.4. Others
- 10.3. Market Analysis, Insights and Forecast - by End-user
- 10.3.1. Hospitals
- 10.3.2. Private Clinics
- 10.3.3. Others
- 10.1. Market Analysis, Insights and Forecast - by Application
- 11. South America Monoclonal Antibody Therapy Industry Analysis, Insights and Forecast, 2020-2032
- 11.1. Market Analysis, Insights and Forecast - by Application
- 11.1.1. Hematological Diseases
- 11.1.2. Autoimmune Diseases
- 11.1.3. Cancer
- 11.1.4. Others
- 11.2. Market Analysis, Insights and Forecast - by Source
- 11.2.1. Human
- 11.2.2. Humanized
- 11.2.3. Chimeric
- 11.2.4. Others
- 11.3. Market Analysis, Insights and Forecast - by End-user
- 11.3.1. Hospitals
- 11.3.2. Private Clinics
- 11.3.3. Others
- 11.1. Market Analysis, Insights and Forecast - by Application
- 12. Competitive Analysis
- 12.1. Company Profiles
- 12.1.1 Daiichi Sankyo Company Limited
- 12.1.1.1. Company Overview
- 12.1.1.2. Products
- 12.1.1.3. Company Financials
- 12.1.1.4. SWOT Analysis
- 12.1.2 Boehringer Ingelheim International GmbH
- 12.1.2.1. Company Overview
- 12.1.2.2. Products
- 12.1.2.3. Company Financials
- 12.1.2.4. SWOT Analysis
- 12.1.3 Merck KGaA
- 12.1.3.1. Company Overview
- 12.1.3.2. Products
- 12.1.3.3. Company Financials
- 12.1.3.4. SWOT Analysis
- 12.1.4 Novartis AG
- 12.1.4.1. Company Overview
- 12.1.4.2. Products
- 12.1.4.3. Company Financials
- 12.1.4.4. SWOT Analysis
- 12.1.5 Amgen Inc
- 12.1.5.1. Company Overview
- 12.1.5.2. Products
- 12.1.5.3. Company Financials
- 12.1.5.4. SWOT Analysis
- 12.1.6 F Hoffmann-La Roche Ltd
- 12.1.6.1. Company Overview
- 12.1.6.2. Products
- 12.1.6.3. Company Financials
- 12.1.6.4. SWOT Analysis
- 12.1.7 UCB S A Belgium (UCB Inc)
- 12.1.7.1. Company Overview
- 12.1.7.2. Products
- 12.1.7.3. Company Financials
- 12.1.7.4. SWOT Analysis
- 12.1.8 AbbVie Inc
- 12.1.8.1. Company Overview
- 12.1.8.2. Products
- 12.1.8.3. Company Financials
- 12.1.8.4. SWOT Analysis
- 12.1.9 Johnson & Johnson
- 12.1.9.1. Company Overview
- 12.1.9.2. Products
- 12.1.9.3. Company Financials
- 12.1.9.4. SWOT Analysis
- 12.1.10 Pfizer Inc
- 12.1.10.1. Company Overview
- 12.1.10.2. Products
- 12.1.10.3. Company Financials
- 12.1.10.4. SWOT Analysis
- 12.1.1 Daiichi Sankyo Company Limited
- 12.2. Market Entropy
- 12.2.1 Company's Key Areas Served
- 12.2.2 Recent Developments
- 12.3. Company Market Share Analysis 2025
- 12.3.1 Top 5 Companies Market Share Analysis
- 12.3.2 Top 3 Companies Market Share Analysis
- 12.4. List of Potential Customers
- 13. Research Methodology
List of Figures
- Figure 1: Global Monoclonal Antibody Therapy Industry Revenue Breakdown (billion, %) by Region 2025 & 2033
- Figure 2: Global Monoclonal Antibody Therapy Industry Volume Breakdown (K Unit, %) by Region 2025 & 2033
- Figure 3: North America Monoclonal Antibody Therapy Industry Revenue (billion), by Application 2025 & 2033
- Figure 4: North America Monoclonal Antibody Therapy Industry Volume (K Unit), by Application 2025 & 2033
- Figure 5: North America Monoclonal Antibody Therapy Industry Revenue Share (%), by Application 2025 & 2033
- Figure 6: North America Monoclonal Antibody Therapy Industry Volume Share (%), by Application 2025 & 2033
- Figure 7: North America Monoclonal Antibody Therapy Industry Revenue (billion), by Source 2025 & 2033
- Figure 8: North America Monoclonal Antibody Therapy Industry Volume (K Unit), by Source 2025 & 2033
- Figure 9: North America Monoclonal Antibody Therapy Industry Revenue Share (%), by Source 2025 & 2033
- Figure 10: North America Monoclonal Antibody Therapy Industry Volume Share (%), by Source 2025 & 2033
- Figure 11: North America Monoclonal Antibody Therapy Industry Revenue (billion), by End-user 2025 & 2033
- Figure 12: North America Monoclonal Antibody Therapy Industry Volume (K Unit), by End-user 2025 & 2033
- Figure 13: North America Monoclonal Antibody Therapy Industry Revenue Share (%), by End-user 2025 & 2033
- Figure 14: North America Monoclonal Antibody Therapy Industry Volume Share (%), by End-user 2025 & 2033
- Figure 15: North America Monoclonal Antibody Therapy Industry Revenue (billion), by Country 2025 & 2033
- Figure 16: North America Monoclonal Antibody Therapy Industry Volume (K Unit), by Country 2025 & 2033
- Figure 17: North America Monoclonal Antibody Therapy Industry Revenue Share (%), by Country 2025 & 2033
- Figure 18: North America Monoclonal Antibody Therapy Industry Volume Share (%), by Country 2025 & 2033
- Figure 19: Europe Monoclonal Antibody Therapy Industry Revenue (billion), by Application 2025 & 2033
- Figure 20: Europe Monoclonal Antibody Therapy Industry Volume (K Unit), by Application 2025 & 2033
- Figure 21: Europe Monoclonal Antibody Therapy Industry Revenue Share (%), by Application 2025 & 2033
- Figure 22: Europe Monoclonal Antibody Therapy Industry Volume Share (%), by Application 2025 & 2033
- Figure 23: Europe Monoclonal Antibody Therapy Industry Revenue (billion), by Source 2025 & 2033
- Figure 24: Europe Monoclonal Antibody Therapy Industry Volume (K Unit), by Source 2025 & 2033
- Figure 25: Europe Monoclonal Antibody Therapy Industry Revenue Share (%), by Source 2025 & 2033
- Figure 26: Europe Monoclonal Antibody Therapy Industry Volume Share (%), by Source 2025 & 2033
- Figure 27: Europe Monoclonal Antibody Therapy Industry Revenue (billion), by End-user 2025 & 2033
- Figure 28: Europe Monoclonal Antibody Therapy Industry Volume (K Unit), by End-user 2025 & 2033
- Figure 29: Europe Monoclonal Antibody Therapy Industry Revenue Share (%), by End-user 2025 & 2033
- Figure 30: Europe Monoclonal Antibody Therapy Industry Volume Share (%), by End-user 2025 & 2033
- Figure 31: Europe Monoclonal Antibody Therapy Industry Revenue (billion), by Country 2025 & 2033
- Figure 32: Europe Monoclonal Antibody Therapy Industry Volume (K Unit), by Country 2025 & 2033
- Figure 33: Europe Monoclonal Antibody Therapy Industry Revenue Share (%), by Country 2025 & 2033
- Figure 34: Europe Monoclonal Antibody Therapy Industry Volume Share (%), by Country 2025 & 2033
- Figure 35: Asia Pacific Monoclonal Antibody Therapy Industry Revenue (billion), by Application 2025 & 2033
- Figure 36: Asia Pacific Monoclonal Antibody Therapy Industry Volume (K Unit), by Application 2025 & 2033
- Figure 37: Asia Pacific Monoclonal Antibody Therapy Industry Revenue Share (%), by Application 2025 & 2033
- Figure 38: Asia Pacific Monoclonal Antibody Therapy Industry Volume Share (%), by Application 2025 & 2033
- Figure 39: Asia Pacific Monoclonal Antibody Therapy Industry Revenue (billion), by Source 2025 & 2033
- Figure 40: Asia Pacific Monoclonal Antibody Therapy Industry Volume (K Unit), by Source 2025 & 2033
- Figure 41: Asia Pacific Monoclonal Antibody Therapy Industry Revenue Share (%), by Source 2025 & 2033
- Figure 42: Asia Pacific Monoclonal Antibody Therapy Industry Volume Share (%), by Source 2025 & 2033
- Figure 43: Asia Pacific Monoclonal Antibody Therapy Industry Revenue (billion), by End-user 2025 & 2033
- Figure 44: Asia Pacific Monoclonal Antibody Therapy Industry Volume (K Unit), by End-user 2025 & 2033
- Figure 45: Asia Pacific Monoclonal Antibody Therapy Industry Revenue Share (%), by End-user 2025 & 2033
- Figure 46: Asia Pacific Monoclonal Antibody Therapy Industry Volume Share (%), by End-user 2025 & 2033
- Figure 47: Asia Pacific Monoclonal Antibody Therapy Industry Revenue (billion), by Country 2025 & 2033
- Figure 48: Asia Pacific Monoclonal Antibody Therapy Industry Volume (K Unit), by Country 2025 & 2033
- Figure 49: Asia Pacific Monoclonal Antibody Therapy Industry Revenue Share (%), by Country 2025 & 2033
- Figure 50: Asia Pacific Monoclonal Antibody Therapy Industry Volume Share (%), by Country 2025 & 2033
- Figure 51: Middle East and Africa Monoclonal Antibody Therapy Industry Revenue (billion), by Application 2025 & 2033
- Figure 52: Middle East and Africa Monoclonal Antibody Therapy Industry Volume (K Unit), by Application 2025 & 2033
- Figure 53: Middle East and Africa Monoclonal Antibody Therapy Industry Revenue Share (%), by Application 2025 & 2033
- Figure 54: Middle East and Africa Monoclonal Antibody Therapy Industry Volume Share (%), by Application 2025 & 2033
- Figure 55: Middle East and Africa Monoclonal Antibody Therapy Industry Revenue (billion), by Source 2025 & 2033
- Figure 56: Middle East and Africa Monoclonal Antibody Therapy Industry Volume (K Unit), by Source 2025 & 2033
- Figure 57: Middle East and Africa Monoclonal Antibody Therapy Industry Revenue Share (%), by Source 2025 & 2033
- Figure 58: Middle East and Africa Monoclonal Antibody Therapy Industry Volume Share (%), by Source 2025 & 2033
- Figure 59: Middle East and Africa Monoclonal Antibody Therapy Industry Revenue (billion), by End-user 2025 & 2033
- Figure 60: Middle East and Africa Monoclonal Antibody Therapy Industry Volume (K Unit), by End-user 2025 & 2033
- Figure 61: Middle East and Africa Monoclonal Antibody Therapy Industry Revenue Share (%), by End-user 2025 & 2033
- Figure 62: Middle East and Africa Monoclonal Antibody Therapy Industry Volume Share (%), by End-user 2025 & 2033
- Figure 63: Middle East and Africa Monoclonal Antibody Therapy Industry Revenue (billion), by Country 2025 & 2033
- Figure 64: Middle East and Africa Monoclonal Antibody Therapy Industry Volume (K Unit), by Country 2025 & 2033
- Figure 65: Middle East and Africa Monoclonal Antibody Therapy Industry Revenue Share (%), by Country 2025 & 2033
- Figure 66: Middle East and Africa Monoclonal Antibody Therapy Industry Volume Share (%), by Country 2025 & 2033
- Figure 67: South America Monoclonal Antibody Therapy Industry Revenue (billion), by Application 2025 & 2033
- Figure 68: South America Monoclonal Antibody Therapy Industry Volume (K Unit), by Application 2025 & 2033
- Figure 69: South America Monoclonal Antibody Therapy Industry Revenue Share (%), by Application 2025 & 2033
- Figure 70: South America Monoclonal Antibody Therapy Industry Volume Share (%), by Application 2025 & 2033
- Figure 71: South America Monoclonal Antibody Therapy Industry Revenue (billion), by Source 2025 & 2033
- Figure 72: South America Monoclonal Antibody Therapy Industry Volume (K Unit), by Source 2025 & 2033
- Figure 73: South America Monoclonal Antibody Therapy Industry Revenue Share (%), by Source 2025 & 2033
- Figure 74: South America Monoclonal Antibody Therapy Industry Volume Share (%), by Source 2025 & 2033
- Figure 75: South America Monoclonal Antibody Therapy Industry Revenue (billion), by End-user 2025 & 2033
- Figure 76: South America Monoclonal Antibody Therapy Industry Volume (K Unit), by End-user 2025 & 2033
- Figure 77: South America Monoclonal Antibody Therapy Industry Revenue Share (%), by End-user 2025 & 2033
- Figure 78: South America Monoclonal Antibody Therapy Industry Volume Share (%), by End-user 2025 & 2033
- Figure 79: South America Monoclonal Antibody Therapy Industry Revenue (billion), by Country 2025 & 2033
- Figure 80: South America Monoclonal Antibody Therapy Industry Volume (K Unit), by Country 2025 & 2033
- Figure 81: South America Monoclonal Antibody Therapy Industry Revenue Share (%), by Country 2025 & 2033
- Figure 82: South America Monoclonal Antibody Therapy Industry Volume Share (%), by Country 2025 & 2033
List of Tables
- Table 1: Global Monoclonal Antibody Therapy Industry Revenue billion Forecast, by Application 2020 & 2033
- Table 2: Global Monoclonal Antibody Therapy Industry Volume K Unit Forecast, by Application 2020 & 2033
- Table 3: Global Monoclonal Antibody Therapy Industry Revenue billion Forecast, by Source 2020 & 2033
- Table 4: Global Monoclonal Antibody Therapy Industry Volume K Unit Forecast, by Source 2020 & 2033
- Table 5: Global Monoclonal Antibody Therapy Industry Revenue billion Forecast, by End-user 2020 & 2033
- Table 6: Global Monoclonal Antibody Therapy Industry Volume K Unit Forecast, by End-user 2020 & 2033
- Table 7: Global Monoclonal Antibody Therapy Industry Revenue billion Forecast, by Region 2020 & 2033
- Table 8: Global Monoclonal Antibody Therapy Industry Volume K Unit Forecast, by Region 2020 & 2033
- Table 9: Global Monoclonal Antibody Therapy Industry Revenue billion Forecast, by Application 2020 & 2033
- Table 10: Global Monoclonal Antibody Therapy Industry Volume K Unit Forecast, by Application 2020 & 2033
- Table 11: Global Monoclonal Antibody Therapy Industry Revenue billion Forecast, by Source 2020 & 2033
- Table 12: Global Monoclonal Antibody Therapy Industry Volume K Unit Forecast, by Source 2020 & 2033
- Table 13: Global Monoclonal Antibody Therapy Industry Revenue billion Forecast, by End-user 2020 & 2033
- Table 14: Global Monoclonal Antibody Therapy Industry Volume K Unit Forecast, by End-user 2020 & 2033
- Table 15: Global Monoclonal Antibody Therapy Industry Revenue billion Forecast, by Country 2020 & 2033
- Table 16: Global Monoclonal Antibody Therapy Industry Volume K Unit Forecast, by Country 2020 & 2033
- Table 17: United States Monoclonal Antibody Therapy Industry Revenue (billion) Forecast, by Application 2020 & 2033
- Table 18: United States Monoclonal Antibody Therapy Industry Volume (K Unit) Forecast, by Application 2020 & 2033
- Table 19: Canada Monoclonal Antibody Therapy Industry Revenue (billion) Forecast, by Application 2020 & 2033
- Table 20: Canada Monoclonal Antibody Therapy Industry Volume (K Unit) Forecast, by Application 2020 & 2033
- Table 21: Mexico Monoclonal Antibody Therapy Industry Revenue (billion) Forecast, by Application 2020 & 2033
- Table 22: Mexico Monoclonal Antibody Therapy Industry Volume (K Unit) Forecast, by Application 2020 & 2033
- Table 23: Global Monoclonal Antibody Therapy Industry Revenue billion Forecast, by Application 2020 & 2033
- Table 24: Global Monoclonal Antibody Therapy Industry Volume K Unit Forecast, by Application 2020 & 2033
- Table 25: Global Monoclonal Antibody Therapy Industry Revenue billion Forecast, by Source 2020 & 2033
- Table 26: Global Monoclonal Antibody Therapy Industry Volume K Unit Forecast, by Source 2020 & 2033
- Table 27: Global Monoclonal Antibody Therapy Industry Revenue billion Forecast, by End-user 2020 & 2033
- Table 28: Global Monoclonal Antibody Therapy Industry Volume K Unit Forecast, by End-user 2020 & 2033
- Table 29: Global Monoclonal Antibody Therapy Industry Revenue billion Forecast, by Country 2020 & 2033
- Table 30: Global Monoclonal Antibody Therapy Industry Volume K Unit Forecast, by Country 2020 & 2033
- Table 31: Germany Monoclonal Antibody Therapy Industry Revenue (billion) Forecast, by Application 2020 & 2033
- Table 32: Germany Monoclonal Antibody Therapy Industry Volume (K Unit) Forecast, by Application 2020 & 2033
- Table 33: United Kingdom Monoclonal Antibody Therapy Industry Revenue (billion) Forecast, by Application 2020 & 2033
- Table 34: United Kingdom Monoclonal Antibody Therapy Industry Volume (K Unit) Forecast, by Application 2020 & 2033
- Table 35: France Monoclonal Antibody Therapy Industry Revenue (billion) Forecast, by Application 2020 & 2033
- Table 36: France Monoclonal Antibody Therapy Industry Volume (K Unit) Forecast, by Application 2020 & 2033
- Table 37: Italy Monoclonal Antibody Therapy Industry Revenue (billion) Forecast, by Application 2020 & 2033
- Table 38: Italy Monoclonal Antibody Therapy Industry Volume (K Unit) Forecast, by Application 2020 & 2033
- Table 39: Spain Monoclonal Antibody Therapy Industry Revenue (billion) Forecast, by Application 2020 & 2033
- Table 40: Spain Monoclonal Antibody Therapy Industry Volume (K Unit) Forecast, by Application 2020 & 2033
- Table 41: Rest of Europe Monoclonal Antibody Therapy Industry Revenue (billion) Forecast, by Application 2020 & 2033
- Table 42: Rest of Europe Monoclonal Antibody Therapy Industry Volume (K Unit) Forecast, by Application 2020 & 2033
- Table 43: Global Monoclonal Antibody Therapy Industry Revenue billion Forecast, by Application 2020 & 2033
- Table 44: Global Monoclonal Antibody Therapy Industry Volume K Unit Forecast, by Application 2020 & 2033
- Table 45: Global Monoclonal Antibody Therapy Industry Revenue billion Forecast, by Source 2020 & 2033
- Table 46: Global Monoclonal Antibody Therapy Industry Volume K Unit Forecast, by Source 2020 & 2033
- Table 47: Global Monoclonal Antibody Therapy Industry Revenue billion Forecast, by End-user 2020 & 2033
- Table 48: Global Monoclonal Antibody Therapy Industry Volume K Unit Forecast, by End-user 2020 & 2033
- Table 49: Global Monoclonal Antibody Therapy Industry Revenue billion Forecast, by Country 2020 & 2033
- Table 50: Global Monoclonal Antibody Therapy Industry Volume K Unit Forecast, by Country 2020 & 2033
- Table 51: China Monoclonal Antibody Therapy Industry Revenue (billion) Forecast, by Application 2020 & 2033
- Table 52: China Monoclonal Antibody Therapy Industry Volume (K Unit) Forecast, by Application 2020 & 2033
- Table 53: Japan Monoclonal Antibody Therapy Industry Revenue (billion) Forecast, by Application 2020 & 2033
- Table 54: Japan Monoclonal Antibody Therapy Industry Volume (K Unit) Forecast, by Application 2020 & 2033
- Table 55: India Monoclonal Antibody Therapy Industry Revenue (billion) Forecast, by Application 2020 & 2033
- Table 56: India Monoclonal Antibody Therapy Industry Volume (K Unit) Forecast, by Application 2020 & 2033
- Table 57: Australia Monoclonal Antibody Therapy Industry Revenue (billion) Forecast, by Application 2020 & 2033
- Table 58: Australia Monoclonal Antibody Therapy Industry Volume (K Unit) Forecast, by Application 2020 & 2033
- Table 59: South Korea Monoclonal Antibody Therapy Industry Revenue (billion) Forecast, by Application 2020 & 2033
- Table 60: South Korea Monoclonal Antibody Therapy Industry Volume (K Unit) Forecast, by Application 2020 & 2033
- Table 61: Rest of Asia Pacific Monoclonal Antibody Therapy Industry Revenue (billion) Forecast, by Application 2020 & 2033
- Table 62: Rest of Asia Pacific Monoclonal Antibody Therapy Industry Volume (K Unit) Forecast, by Application 2020 & 2033
- Table 63: Global Monoclonal Antibody Therapy Industry Revenue billion Forecast, by Application 2020 & 2033
- Table 64: Global Monoclonal Antibody Therapy Industry Volume K Unit Forecast, by Application 2020 & 2033
- Table 65: Global Monoclonal Antibody Therapy Industry Revenue billion Forecast, by Source 2020 & 2033
- Table 66: Global Monoclonal Antibody Therapy Industry Volume K Unit Forecast, by Source 2020 & 2033
- Table 67: Global Monoclonal Antibody Therapy Industry Revenue billion Forecast, by End-user 2020 & 2033
- Table 68: Global Monoclonal Antibody Therapy Industry Volume K Unit Forecast, by End-user 2020 & 2033
- Table 69: Global Monoclonal Antibody Therapy Industry Revenue billion Forecast, by Country 2020 & 2033
- Table 70: Global Monoclonal Antibody Therapy Industry Volume K Unit Forecast, by Country 2020 & 2033
- Table 71: GCC Monoclonal Antibody Therapy Industry Revenue (billion) Forecast, by Application 2020 & 2033
- Table 72: GCC Monoclonal Antibody Therapy Industry Volume (K Unit) Forecast, by Application 2020 & 2033
- Table 73: South Africa Monoclonal Antibody Therapy Industry Revenue (billion) Forecast, by Application 2020 & 2033
- Table 74: South Africa Monoclonal Antibody Therapy Industry Volume (K Unit) Forecast, by Application 2020 & 2033
- Table 75: Rest of Middle East and Africa Monoclonal Antibody Therapy Industry Revenue (billion) Forecast, by Application 2020 & 2033
- Table 76: Rest of Middle East and Africa Monoclonal Antibody Therapy Industry Volume (K Unit) Forecast, by Application 2020 & 2033
- Table 77: Global Monoclonal Antibody Therapy Industry Revenue billion Forecast, by Application 2020 & 2033
- Table 78: Global Monoclonal Antibody Therapy Industry Volume K Unit Forecast, by Application 2020 & 2033
- Table 79: Global Monoclonal Antibody Therapy Industry Revenue billion Forecast, by Source 2020 & 2033
- Table 80: Global Monoclonal Antibody Therapy Industry Volume K Unit Forecast, by Source 2020 & 2033
- Table 81: Global Monoclonal Antibody Therapy Industry Revenue billion Forecast, by End-user 2020 & 2033
- Table 82: Global Monoclonal Antibody Therapy Industry Volume K Unit Forecast, by End-user 2020 & 2033
- Table 83: Global Monoclonal Antibody Therapy Industry Revenue billion Forecast, by Country 2020 & 2033
- Table 84: Global Monoclonal Antibody Therapy Industry Volume K Unit Forecast, by Country 2020 & 2033
- Table 85: Brazil Monoclonal Antibody Therapy Industry Revenue (billion) Forecast, by Application 2020 & 2033
- Table 86: Brazil Monoclonal Antibody Therapy Industry Volume (K Unit) Forecast, by Application 2020 & 2033
- Table 87: Argentina Monoclonal Antibody Therapy Industry Revenue (billion) Forecast, by Application 2020 & 2033
- Table 88: Argentina Monoclonal Antibody Therapy Industry Volume (K Unit) Forecast, by Application 2020 & 2033
- Table 89: Rest of South America Monoclonal Antibody Therapy Industry Revenue (billion) Forecast, by Application 2020 & 2033
- Table 90: Rest of South America Monoclonal Antibody Therapy Industry Volume (K Unit) Forecast, by Application 2020 & 2033
Frequently Asked Questions
1. What is the projected Compound Annual Growth Rate (CAGR) of the Monoclonal Antibody Therapy Industry?
The projected CAGR is approximately 16.24%.
2. Which companies are prominent players in the Monoclonal Antibody Therapy Industry?
Key companies in the market include Daiichi Sankyo Company Limited, Boehringer Ingelheim International GmbH, Merck KGaA, Novartis AG, Amgen Inc, F Hoffmann-La Roche Ltd, UCB S A Belgium (UCB Inc), AbbVie Inc, Johnson & Johnson, Pfizer Inc.
3. What are the main segments of the Monoclonal Antibody Therapy Industry?
The market segments include Application, Source, End-user.
4. Can you provide details about the market size?
The market size is estimated to be USD 264.33 billion as of 2022.
5. What are some drivers contributing to market growth?
Increasing Global Prevalence of Autoimmune Disorders and Rise in Geriatric Population; New Product Launches with Accelerated Drug Approval Initiative by USFDA.
6. What are the notable trends driving market growth?
Autoimmune Diseases are Expected to Hold the Significant Market Share in the Monoclonal Antibody Therapeutics Market.
7. Are there any restraints impacting market growth?
High Risk of Complications such as Heart Failure. Liver Injury. Neurological Disorders. Psoriasis and many Allergic Reactions; High Challenges while in the Development Stage and Expensive Patented Products.
8. Can you provide examples of recent developments in the market?
September 2022: AstraZeneca's Evusheld (tixagevimab and cilgavimab, formerly AZD7442), a long-acting antibody combination, was recommended for marketing authorization in the European Union (EU) for the treatment of adults and adolescents (aged 12 years and older weighing at least 40 kg) with COVID19 who do not require supplemental oxygen and who are at increased risk of progressing to severe COVID19.
9. What pricing options are available for accessing the report?
Pricing options include single-user, multi-user, and enterprise licenses priced at USD 4750, USD 5250, and USD 8750 respectively.
10. Is the market size provided in terms of value or volume?
The market size is provided in terms of value, measured in billion and volume, measured in K Unit.
11. Are there any specific market keywords associated with the report?
Yes, the market keyword associated with the report is "Monoclonal Antibody Therapy Industry," which aids in identifying and referencing the specific market segment covered.
12. How do I determine which pricing option suits my needs best?
The pricing options vary based on user requirements and access needs. Individual users may opt for single-user licenses, while businesses requiring broader access may choose multi-user or enterprise licenses for cost-effective access to the report.
13. Are there any additional resources or data provided in the Monoclonal Antibody Therapy Industry report?
While the report offers comprehensive insights, it's advisable to review the specific contents or supplementary materials provided to ascertain if additional resources or data are available.
14. How can I stay updated on further developments or reports in the Monoclonal Antibody Therapy Industry?
To stay informed about further developments, trends, and reports in the Monoclonal Antibody Therapy Industry, consider subscribing to industry newsletters, following relevant companies and organizations, or regularly checking reputable industry news sources and publications.
Methodology
Step 1 - Identification of Relevant Samples Size from Population Database


Step 2 - Approaches for Defining Global Market Size (Value, Volume* & Price*)

Note*: In applicable scenarios
Step 3 - Data Sources
Primary Research
- Web Analytics
- Survey Reports
- Research Institute
- Latest Research Reports
- Opinion Leaders
Secondary Research
- Annual Reports
- White Paper
- Latest Press Release
- Industry Association
- Paid Database
- Investor Presentations

Step 4 - Data Triangulation
Involves using different sources of information in order to increase the validity of a study
These sources are likely to be stakeholders in a program - participants, other researchers, program staff, other community members, and so on.
Then we put all data in single framework & apply various statistical tools to find out the dynamic on the market.
During the analysis stage, feedback from the stakeholder groups would be compared to determine areas of agreement as well as areas of divergence