

Key Insights
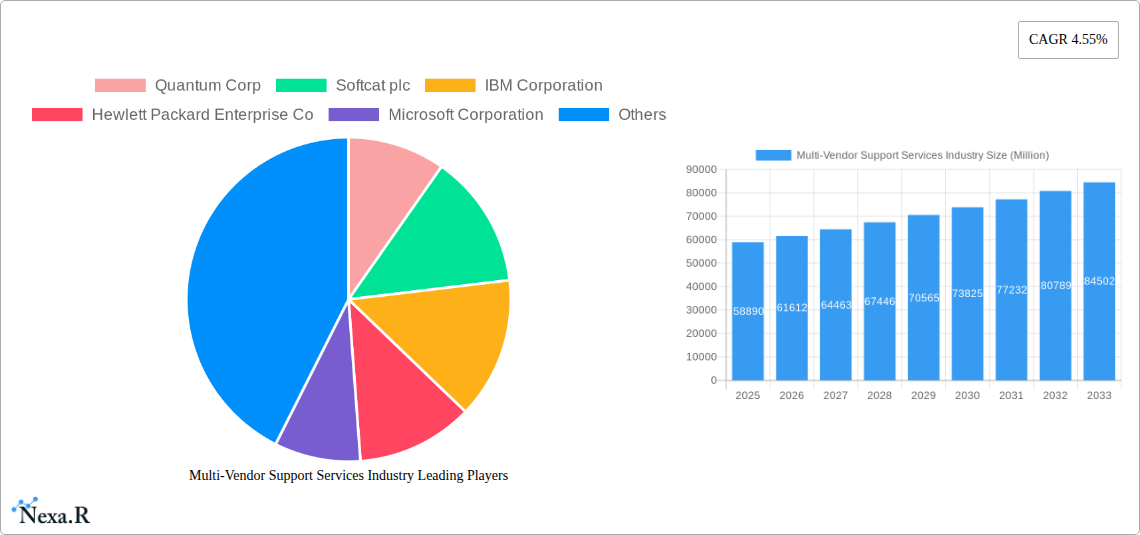
The multi-vendor support services market, valued at $58.89 billion in 2025, is projected to experience robust growth, driven by the increasing complexity of IT infrastructure and the rising demand for efficient, cost-effective support solutions across diverse industries. The 4.55% CAGR from 2025 to 2033 indicates a significant expansion, fueled by several key factors. The surge in digital transformation initiatives across sectors like IT & Telecommunications, BFSI, and Healthcare necessitates expert support for managing heterogeneous IT environments. Businesses are increasingly adopting multi-vendor strategies to leverage best-of-breed technologies, leading to a greater reliance on specialized support services that can seamlessly integrate diverse systems. Furthermore, the shift towards cloud-based solutions and the growing adoption of IoT devices contribute to this market's expansion. The managed service segment is expected to dominate due to its scalability and cost-effectiveness, while large enterprises will continue to be the primary consumers of these services. Geographic expansion, particularly within rapidly developing economies in Asia-Pacific and regions with growing digital infrastructure in South America and MEA, will also contribute to market expansion. However, challenges such as the potential for vendor lock-in and the need for highly skilled support professionals could act as restraints.
The competitive landscape features both established players like IBM, Hewlett Packard Enterprise, and Microsoft, alongside specialized multi-vendor support providers such as Quantum Corp and Clear Technologies. This blend of established technology giants and niche players offers a diversified range of solutions and expertise catering to various organizational needs and sizes. Companies are actively investing in developing advanced support solutions, such as AI-powered troubleshooting and predictive maintenance, to enhance service quality and efficiency. The market is expected to witness further consolidation through mergers and acquisitions as businesses seek to expand their service portfolios and global reach. The overall trend is towards a more proactive and preventative approach to IT support, aiming to minimize downtime and maximize operational efficiency.
Multi-Vendor Support Services Industry Market Report: 2019-2033
This comprehensive report provides a detailed analysis of the Multi-Vendor Support Services market, offering invaluable insights for industry professionals, investors, and strategists. With a focus on market dynamics, growth trends, key players, and future opportunities, this report covers the period 2019-2033, with a base year of 2025 and a forecast period of 2025-2033. The report segments the market by end-user verticals, service type, and enterprise size, providing a granular view of this rapidly evolving landscape. The total market size in 2025 is estimated at xx Million.
Multi-Vendor Support Services Industry Market Dynamics & Structure
The multi-vendor support services market is characterized by moderate concentration, with several large players and a growing number of specialized providers. Technological innovation, particularly in cloud computing and automation, is a key driver, while regulatory frameworks concerning data security and compliance significantly impact market operations. The market faces competition from internal IT teams and DIY solutions but benefits from the increasing complexity of IT infrastructures. M&A activity has been moderate, with several strategic acquisitions aimed at expanding service offerings and geographic reach.
- Market Concentration: Moderately concentrated, with a top 5 market share of approximately xx%.
- Technological Innovation: Cloud computing, AI-driven support, and automation are key drivers.
- Regulatory Framework: GDPR, CCPA, and other data security regulations significantly impact operations.
- Competitive Substitutes: Internal IT teams, DIY solutions, and open-source alternatives.
- End-User Demographics: Growth is driven by large enterprises' need for robust multi-vendor support, followed by SMEs.
- M&A Trends: xx M&A deals recorded in the past 5 years, focusing on geographic expansion and service diversification.
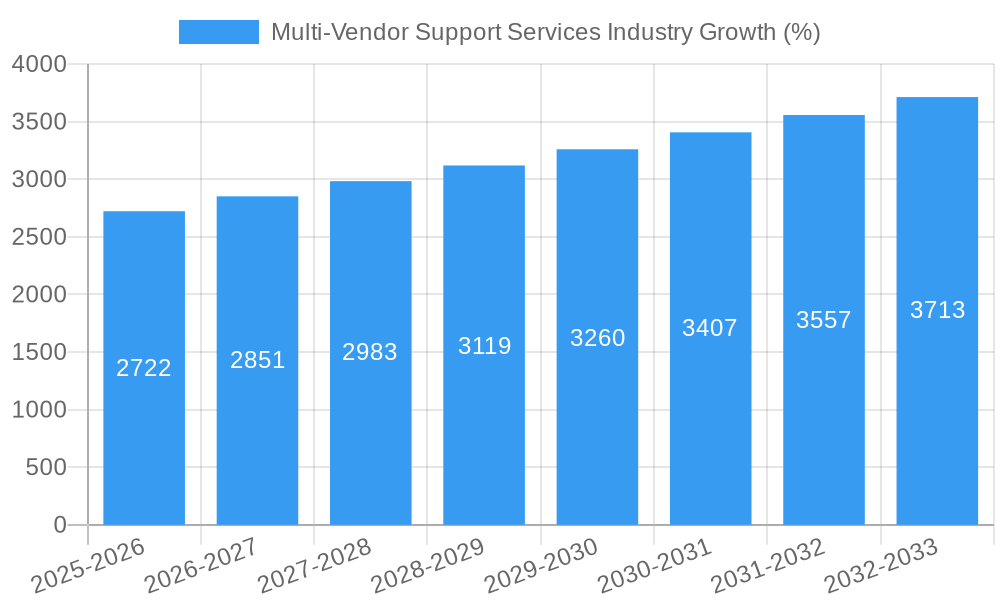
Multi-Vendor Support Services Industry Growth Trends & Insights
The multi-vendor support services market has experienced steady growth over the past few years, driven by the increasing adoption of cloud computing, the rise of multi-vendor IT environments, and the growing need for specialized expertise. The market size is projected to reach xx Million by 2033, exhibiting a CAGR of xx% during the forecast period (2025-2033). This growth is fueled by factors such as rising digital transformation initiatives across industries, increasing complexity of IT infrastructure, and the growing preference for outsourcing IT support. Technological disruptions, such as the shift to cloud-native architectures and the increased adoption of AI-powered support tools, are further accelerating market growth.
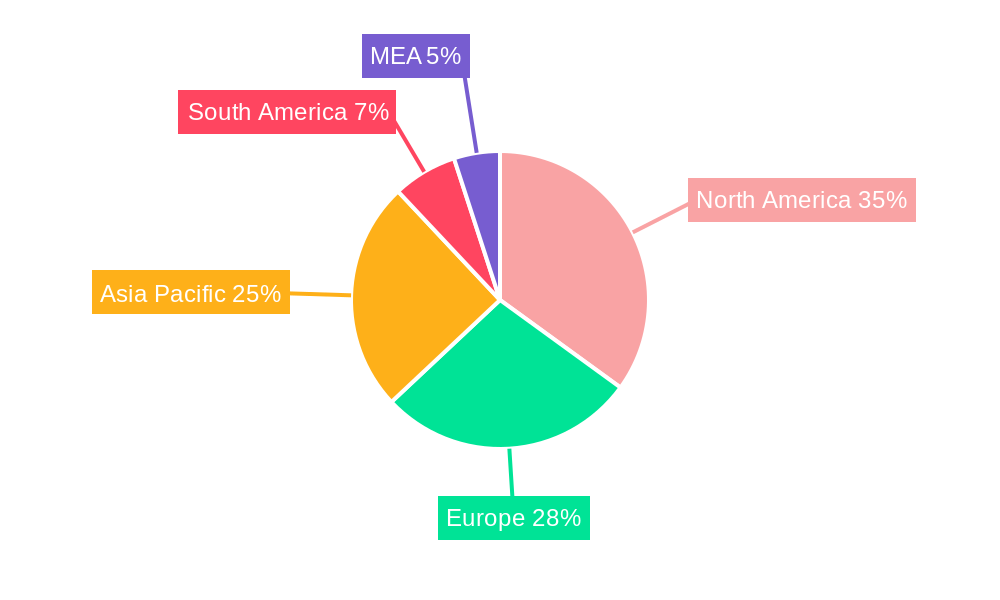
Dominant Regions, Countries, or Segments in Multi-Vendor Support Services Industry
The IT & Telecommunication vertical is currently the largest segment in the multi-vendor support services market, followed by BFSI and Healthcare. North America and Europe represent the most mature markets, while Asia-Pacific is projected to experience the fastest growth rate. Large enterprises are the key consumers, due to the complexity of their IT infrastructures. Managed services represent a significant portion of the market due to cost-effectiveness and scalability.
- Leading Region: North America
- Fastest-Growing Region: Asia-Pacific
- Largest Vertical: IT & Telecommunication
- Largest Enterprise Segment: Large Enterprises
- Largest Service Type: Managed Services
- Key Drivers: Increasing digital transformation, complex IT infrastructure, need for specialized expertise, outsourcing preference.
Multi-Vendor Support Services Industry Product Landscape
The multi-vendor support services market offers a wide range of solutions, from basic troubleshooting and maintenance to proactive monitoring and managed services. Key innovations include AI-powered diagnostic tools, automated incident management systems, and cloud-based support platforms. These solutions offer enhanced efficiency, reduced downtime, and improved customer experience. Unique selling propositions often include specialized expertise in specific technologies or verticals, 24/7 support, and service level agreements (SLAs) tailored to customer needs.
Key Drivers, Barriers & Challenges in Multi-Vendor Support Services Industry
Key Drivers: The increasing complexity of IT environments, the growing adoption of cloud services, and the need for specialized expertise are primary drivers of market growth. Government initiatives promoting digital transformation and the rise of hybrid IT models are also contributing factors.
Challenges & Restraints: Integration challenges across different vendors' systems and the lack of standardized support processes are significant hurdles. Competition from internal IT teams and security concerns related to accessing multiple systems can also impede growth. Supply chain disruptions can impact the availability of skilled technicians, causing service delays and increased costs.
Emerging Opportunities in Multi-Vendor Support Services Industry
Emerging opportunities lie in providing specialized support for emerging technologies like AI, IoT, and edge computing. The development of AI-powered diagnostic tools and automated support systems offer significant potential for cost optimization and improved service quality. Untapped markets in developing economies and the increasing need for cybersecurity support are also promising avenues for growth.
Growth Accelerators in the Multi-Vendor Support Services Industry Industry
Strategic partnerships between technology vendors and support providers are key growth accelerators. The development of advanced diagnostic tools, cloud-based support platforms, and AI-powered automation are also significant drivers of market expansion. Government initiatives promoting digital transformation and investment in IT infrastructure further stimulate market growth.
Key Players Shaping the Multi-Vendor Support Services Industry Market
- Quantum Corp
- Softcat plc
- IBM Corporation
- Hewlett Packard Enterprise Co
- Microsoft Corporation
- NetApp Inc
- Oracle Corporation
- Dell Technologies Inc
- Clear Technologies Inc
- Evernex Group SAS
- Blue Sky Group Ltd
Notable Milestones in Multi-Vendor Support Services Industry Sector
- October 2022: Google Cloud launches Third-Party Technology Support as part of Premium Support, addressing multi-vendor troubleshooting challenges.
- June 2022: Red Hat and Ericsson collaborate to streamline multi-vendor network integration and accelerate service deployment.
In-Depth Multi-Vendor Support Services Industry Market Outlook
The future of the multi-vendor support services market is bright, driven by the continuous growth of cloud computing, the increasing complexity of IT infrastructures, and the persistent need for specialized expertise. Strategic partnerships, technological advancements, and expansion into new markets will be key factors shaping the market's trajectory in the coming years. The market is poised for significant expansion, driven by robust demand and ongoing innovation.
Multi-Vendor Support Services Industry Segmentation
-
1. Service Type
- 1.1. Professional
- 1.2. Managed
-
2. Enterprise Size
- 2.1. Small & Medium Enterprises
- 2.2. Large Enterprises
-
3. End-user Verticals
- 3.1. IT & Telecommunication
- 3.2. BFSI
- 3.3. Healthcare
- 3.4. Energy & Power
- 3.5. Industrial Manufacturing
- 3.6. Others (
Multi-Vendor Support Services Industry Segmentation By Geography
- 1. North America
- 2. Europe
- 3. Asia Pacific
- 4. Latin America
- 5. Middle East and Africa
Multi-Vendor Support Services Industry REPORT HIGHLIGHTS
| Aspects | Details |
|---|---|
| Study Period | 2019-2033 |
| Base Year | 2024 |
| Estimated Year | 2025 |
| Forecast Period | 2025-2033 |
| Historical Period | 2019-2024 |
| Growth Rate | CAGR of 4.55% from 2019-2033 |
| Segmentation |
|
Table of Contents
- 1. Introduction
- 1.1. Research Scope
- 1.2. Market Segmentation
- 1.3. Research Methodology
- 1.4. Definitions and Assumptions
- 2. Executive Summary
- 2.1. Introduction
- 3. Market Dynamics
- 3.1. Introduction
- 3.2. Market Drivers
- 3.2.1. Rising Maintenance Cost of OEM Services
- 3.3. Market Restrains
- 3.3.1. Expensive Integration and Maintenance activities; Concerns on Data Security and Privacy; Stringent Data Regulations Imposed in Various Regions
- 3.4. Market Trends
- 3.4.1. IT & Telecommunication Vertical is Expected to Grow at a Significant Rate Over the Forecast Period
- 4. Market Factor Analysis
- 4.1. Porters Five Forces
- 4.2. Supply/Value Chain
- 4.3. PESTEL analysis
- 4.4. Market Entropy
- 4.5. Patent/Trademark Analysis
- 5. Global Multi-Vendor Support Services Industry Analysis, Insights and Forecast, 2019-2031
- 5.1. Market Analysis, Insights and Forecast - by Service Type
- 5.1.1. Professional
- 5.1.2. Managed
- 5.2. Market Analysis, Insights and Forecast - by Enterprise Size
- 5.2.1. Small & Medium Enterprises
- 5.2.2. Large Enterprises
- 5.3. Market Analysis, Insights and Forecast - by End-user Verticals
- 5.3.1. IT & Telecommunication
- 5.3.2. BFSI
- 5.3.3. Healthcare
- 5.3.4. Energy & Power
- 5.3.5. Industrial Manufacturing
- 5.3.6. Others (
- 5.4. Market Analysis, Insights and Forecast - by Region
- 5.4.1. North America
- 5.4.2. Europe
- 5.4.3. Asia Pacific
- 5.4.4. Latin America
- 5.4.5. Middle East and Africa
- 5.1. Market Analysis, Insights and Forecast - by Service Type
- 6. North America Multi-Vendor Support Services Industry Analysis, Insights and Forecast, 2019-2031
- 6.1. Market Analysis, Insights and Forecast - by Service Type
- 6.1.1. Professional
- 6.1.2. Managed
- 6.2. Market Analysis, Insights and Forecast - by Enterprise Size
- 6.2.1. Small & Medium Enterprises
- 6.2.2. Large Enterprises
- 6.3. Market Analysis, Insights and Forecast - by End-user Verticals
- 6.3.1. IT & Telecommunication
- 6.3.2. BFSI
- 6.3.3. Healthcare
- 6.3.4. Energy & Power
- 6.3.5. Industrial Manufacturing
- 6.3.6. Others (
- 6.1. Market Analysis, Insights and Forecast - by Service Type
- 7. Europe Multi-Vendor Support Services Industry Analysis, Insights and Forecast, 2019-2031
- 7.1. Market Analysis, Insights and Forecast - by Service Type
- 7.1.1. Professional
- 7.1.2. Managed
- 7.2. Market Analysis, Insights and Forecast - by Enterprise Size
- 7.2.1. Small & Medium Enterprises
- 7.2.2. Large Enterprises
- 7.3. Market Analysis, Insights and Forecast - by End-user Verticals
- 7.3.1. IT & Telecommunication
- 7.3.2. BFSI
- 7.3.3. Healthcare
- 7.3.4. Energy & Power
- 7.3.5. Industrial Manufacturing
- 7.3.6. Others (
- 7.1. Market Analysis, Insights and Forecast - by Service Type
- 8. Asia Pacific Multi-Vendor Support Services Industry Analysis, Insights and Forecast, 2019-2031
- 8.1. Market Analysis, Insights and Forecast - by Service Type
- 8.1.1. Professional
- 8.1.2. Managed
- 8.2. Market Analysis, Insights and Forecast - by Enterprise Size
- 8.2.1. Small & Medium Enterprises
- 8.2.2. Large Enterprises
- 8.3. Market Analysis, Insights and Forecast - by End-user Verticals
- 8.3.1. IT & Telecommunication
- 8.3.2. BFSI
- 8.3.3. Healthcare
- 8.3.4. Energy & Power
- 8.3.5. Industrial Manufacturing
- 8.3.6. Others (
- 8.1. Market Analysis, Insights and Forecast - by Service Type
- 9. Latin America Multi-Vendor Support Services Industry Analysis, Insights and Forecast, 2019-2031
- 9.1. Market Analysis, Insights and Forecast - by Service Type
- 9.1.1. Professional
- 9.1.2. Managed
- 9.2. Market Analysis, Insights and Forecast - by Enterprise Size
- 9.2.1. Small & Medium Enterprises
- 9.2.2. Large Enterprises
- 9.3. Market Analysis, Insights and Forecast - by End-user Verticals
- 9.3.1. IT & Telecommunication
- 9.3.2. BFSI
- 9.3.3. Healthcare
- 9.3.4. Energy & Power
- 9.3.5. Industrial Manufacturing
- 9.3.6. Others (
- 9.1. Market Analysis, Insights and Forecast - by Service Type
- 10. Middle East and Africa Multi-Vendor Support Services Industry Analysis, Insights and Forecast, 2019-2031
- 10.1. Market Analysis, Insights and Forecast - by Service Type
- 10.1.1. Professional
- 10.1.2. Managed
- 10.2. Market Analysis, Insights and Forecast - by Enterprise Size
- 10.2.1. Small & Medium Enterprises
- 10.2.2. Large Enterprises
- 10.3. Market Analysis, Insights and Forecast - by End-user Verticals
- 10.3.1. IT & Telecommunication
- 10.3.2. BFSI
- 10.3.3. Healthcare
- 10.3.4. Energy & Power
- 10.3.5. Industrial Manufacturing
- 10.3.6. Others (
- 10.1. Market Analysis, Insights and Forecast - by Service Type
- 11. North America Multi-Vendor Support Services Industry Analysis, Insights and Forecast, 2019-2031
- 11.1. Market Analysis, Insights and Forecast - By Country/Sub-region
- 11.1.1 United States
- 11.1.2 Canada
- 11.1.3 Mexico
- 12. Europe Multi-Vendor Support Services Industry Analysis, Insights and Forecast, 2019-2031
- 12.1. Market Analysis, Insights and Forecast - By Country/Sub-region
- 12.1.1 Germany
- 12.1.2 United Kingdom
- 12.1.3 France
- 12.1.4 Spain
- 12.1.5 Italy
- 12.1.6 Spain
- 12.1.7 Belgium
- 12.1.8 Netherland
- 12.1.9 Nordics
- 12.1.10 Rest of Europe
- 13. Asia Pacific Multi-Vendor Support Services Industry Analysis, Insights and Forecast, 2019-2031
- 13.1. Market Analysis, Insights and Forecast - By Country/Sub-region
- 13.1.1 China
- 13.1.2 Japan
- 13.1.3 India
- 13.1.4 South Korea
- 13.1.5 Southeast Asia
- 13.1.6 Australia
- 13.1.7 Indonesia
- 13.1.8 Phillipes
- 13.1.9 Singapore
- 13.1.10 Thailandc
- 13.1.11 Rest of Asia Pacific
- 14. South America Multi-Vendor Support Services Industry Analysis, Insights and Forecast, 2019-2031
- 14.1. Market Analysis, Insights and Forecast - By Country/Sub-region
- 14.1.1 Brazil
- 14.1.2 Argentina
- 14.1.3 Peru
- 14.1.4 Chile
- 14.1.5 Colombia
- 14.1.6 Ecuador
- 14.1.7 Venezuela
- 14.1.8 Rest of South America
- 15. North America Multi-Vendor Support Services Industry Analysis, Insights and Forecast, 2019-2031
- 15.1. Market Analysis, Insights and Forecast - By Country/Sub-region
- 15.1.1 United States
- 15.1.2 Canada
- 15.1.3 Mexico
- 16. MEA Multi-Vendor Support Services Industry Analysis, Insights and Forecast, 2019-2031
- 16.1. Market Analysis, Insights and Forecast - By Country/Sub-region
- 16.1.1 United Arab Emirates
- 16.1.2 Saudi Arabia
- 16.1.3 South Africa
- 16.1.4 Rest of Middle East and Africa
- 17. Competitive Analysis
- 17.1. Global Market Share Analysis 2024
- 17.2. Company Profiles
- 17.2.1 Quantum Corp
- 17.2.1.1. Overview
- 17.2.1.2. Products
- 17.2.1.3. SWOT Analysis
- 17.2.1.4. Recent Developments
- 17.2.1.5. Financials (Based on Availability)
- 17.2.2 Softcat plc
- 17.2.2.1. Overview
- 17.2.2.2. Products
- 17.2.2.3. SWOT Analysis
- 17.2.2.4. Recent Developments
- 17.2.2.5. Financials (Based on Availability)
- 17.2.3 IBM Corporation
- 17.2.3.1. Overview
- 17.2.3.2. Products
- 17.2.3.3. SWOT Analysis
- 17.2.3.4. Recent Developments
- 17.2.3.5. Financials (Based on Availability)
- 17.2.4 Hewlett Packard Enterprise Co
- 17.2.4.1. Overview
- 17.2.4.2. Products
- 17.2.4.3. SWOT Analysis
- 17.2.4.4. Recent Developments
- 17.2.4.5. Financials (Based on Availability)
- 17.2.5 Microsoft Corporation
- 17.2.5.1. Overview
- 17.2.5.2. Products
- 17.2.5.3. SWOT Analysis
- 17.2.5.4. Recent Developments
- 17.2.5.5. Financials (Based on Availability)
- 17.2.6 NetApp Inc
- 17.2.6.1. Overview
- 17.2.6.2. Products
- 17.2.6.3. SWOT Analysis
- 17.2.6.4. Recent Developments
- 17.2.6.5. Financials (Based on Availability)
- 17.2.7 Oracle Corporation
- 17.2.7.1. Overview
- 17.2.7.2. Products
- 17.2.7.3. SWOT Analysis
- 17.2.7.4. Recent Developments
- 17.2.7.5. Financials (Based on Availability)
- 17.2.8 Dell Technologies Inc
- 17.2.8.1. Overview
- 17.2.8.2. Products
- 17.2.8.3. SWOT Analysis
- 17.2.8.4. Recent Developments
- 17.2.8.5. Financials (Based on Availability)
- 17.2.9 Clear Technologies Inc
- 17.2.9.1. Overview
- 17.2.9.2. Products
- 17.2.9.3. SWOT Analysis
- 17.2.9.4. Recent Developments
- 17.2.9.5. Financials (Based on Availability)
- 17.2.10 Evernex Group SAS
- 17.2.10.1. Overview
- 17.2.10.2. Products
- 17.2.10.3. SWOT Analysis
- 17.2.10.4. Recent Developments
- 17.2.10.5. Financials (Based on Availability)
- 17.2.11 Blue Sky Group Ltd
- 17.2.11.1. Overview
- 17.2.11.2. Products
- 17.2.11.3. SWOT Analysis
- 17.2.11.4. Recent Developments
- 17.2.11.5. Financials (Based on Availability)
- 17.2.1 Quantum Corp
List of Figures
- Figure 1: Global Multi-Vendor Support Services Industry Revenue Breakdown (Million, %) by Region 2024 & 2032
- Figure 2: North America Multi-Vendor Support Services Industry Revenue (Million), by Country 2024 & 2032
- Figure 3: North America Multi-Vendor Support Services Industry Revenue Share (%), by Country 2024 & 2032
- Figure 4: Europe Multi-Vendor Support Services Industry Revenue (Million), by Country 2024 & 2032
- Figure 5: Europe Multi-Vendor Support Services Industry Revenue Share (%), by Country 2024 & 2032
- Figure 6: Asia Pacific Multi-Vendor Support Services Industry Revenue (Million), by Country 2024 & 2032
- Figure 7: Asia Pacific Multi-Vendor Support Services Industry Revenue Share (%), by Country 2024 & 2032
- Figure 8: South America Multi-Vendor Support Services Industry Revenue (Million), by Country 2024 & 2032
- Figure 9: South America Multi-Vendor Support Services Industry Revenue Share (%), by Country 2024 & 2032
- Figure 10: North America Multi-Vendor Support Services Industry Revenue (Million), by Country 2024 & 2032
- Figure 11: North America Multi-Vendor Support Services Industry Revenue Share (%), by Country 2024 & 2032
- Figure 12: MEA Multi-Vendor Support Services Industry Revenue (Million), by Country 2024 & 2032
- Figure 13: MEA Multi-Vendor Support Services Industry Revenue Share (%), by Country 2024 & 2032
- Figure 14: North America Multi-Vendor Support Services Industry Revenue (Million), by Service Type 2024 & 2032
- Figure 15: North America Multi-Vendor Support Services Industry Revenue Share (%), by Service Type 2024 & 2032
- Figure 16: North America Multi-Vendor Support Services Industry Revenue (Million), by Enterprise Size 2024 & 2032
- Figure 17: North America Multi-Vendor Support Services Industry Revenue Share (%), by Enterprise Size 2024 & 2032
- Figure 18: North America Multi-Vendor Support Services Industry Revenue (Million), by End-user Verticals 2024 & 2032
- Figure 19: North America Multi-Vendor Support Services Industry Revenue Share (%), by End-user Verticals 2024 & 2032
- Figure 20: North America Multi-Vendor Support Services Industry Revenue (Million), by Country 2024 & 2032
- Figure 21: North America Multi-Vendor Support Services Industry Revenue Share (%), by Country 2024 & 2032
- Figure 22: Europe Multi-Vendor Support Services Industry Revenue (Million), by Service Type 2024 & 2032
- Figure 23: Europe Multi-Vendor Support Services Industry Revenue Share (%), by Service Type 2024 & 2032
- Figure 24: Europe Multi-Vendor Support Services Industry Revenue (Million), by Enterprise Size 2024 & 2032
- Figure 25: Europe Multi-Vendor Support Services Industry Revenue Share (%), by Enterprise Size 2024 & 2032
- Figure 26: Europe Multi-Vendor Support Services Industry Revenue (Million), by End-user Verticals 2024 & 2032
- Figure 27: Europe Multi-Vendor Support Services Industry Revenue Share (%), by End-user Verticals 2024 & 2032
- Figure 28: Europe Multi-Vendor Support Services Industry Revenue (Million), by Country 2024 & 2032
- Figure 29: Europe Multi-Vendor Support Services Industry Revenue Share (%), by Country 2024 & 2032
- Figure 30: Asia Pacific Multi-Vendor Support Services Industry Revenue (Million), by Service Type 2024 & 2032
- Figure 31: Asia Pacific Multi-Vendor Support Services Industry Revenue Share (%), by Service Type 2024 & 2032
- Figure 32: Asia Pacific Multi-Vendor Support Services Industry Revenue (Million), by Enterprise Size 2024 & 2032
- Figure 33: Asia Pacific Multi-Vendor Support Services Industry Revenue Share (%), by Enterprise Size 2024 & 2032
- Figure 34: Asia Pacific Multi-Vendor Support Services Industry Revenue (Million), by End-user Verticals 2024 & 2032
- Figure 35: Asia Pacific Multi-Vendor Support Services Industry Revenue Share (%), by End-user Verticals 2024 & 2032
- Figure 36: Asia Pacific Multi-Vendor Support Services Industry Revenue (Million), by Country 2024 & 2032
- Figure 37: Asia Pacific Multi-Vendor Support Services Industry Revenue Share (%), by Country 2024 & 2032
- Figure 38: Latin America Multi-Vendor Support Services Industry Revenue (Million), by Service Type 2024 & 2032
- Figure 39: Latin America Multi-Vendor Support Services Industry Revenue Share (%), by Service Type 2024 & 2032
- Figure 40: Latin America Multi-Vendor Support Services Industry Revenue (Million), by Enterprise Size 2024 & 2032
- Figure 41: Latin America Multi-Vendor Support Services Industry Revenue Share (%), by Enterprise Size 2024 & 2032
- Figure 42: Latin America Multi-Vendor Support Services Industry Revenue (Million), by End-user Verticals 2024 & 2032
- Figure 43: Latin America Multi-Vendor Support Services Industry Revenue Share (%), by End-user Verticals 2024 & 2032
- Figure 44: Latin America Multi-Vendor Support Services Industry Revenue (Million), by Country 2024 & 2032
- Figure 45: Latin America Multi-Vendor Support Services Industry Revenue Share (%), by Country 2024 & 2032
- Figure 46: Middle East and Africa Multi-Vendor Support Services Industry Revenue (Million), by Service Type 2024 & 2032
- Figure 47: Middle East and Africa Multi-Vendor Support Services Industry Revenue Share (%), by Service Type 2024 & 2032
- Figure 48: Middle East and Africa Multi-Vendor Support Services Industry Revenue (Million), by Enterprise Size 2024 & 2032
- Figure 49: Middle East and Africa Multi-Vendor Support Services Industry Revenue Share (%), by Enterprise Size 2024 & 2032
- Figure 50: Middle East and Africa Multi-Vendor Support Services Industry Revenue (Million), by End-user Verticals 2024 & 2032
- Figure 51: Middle East and Africa Multi-Vendor Support Services Industry Revenue Share (%), by End-user Verticals 2024 & 2032
- Figure 52: Middle East and Africa Multi-Vendor Support Services Industry Revenue (Million), by Country 2024 & 2032
- Figure 53: Middle East and Africa Multi-Vendor Support Services Industry Revenue Share (%), by Country 2024 & 2032
List of Tables
- Table 1: Global Multi-Vendor Support Services Industry Revenue Million Forecast, by Region 2019 & 2032
- Table 2: Global Multi-Vendor Support Services Industry Revenue Million Forecast, by Service Type 2019 & 2032
- Table 3: Global Multi-Vendor Support Services Industry Revenue Million Forecast, by Enterprise Size 2019 & 2032
- Table 4: Global Multi-Vendor Support Services Industry Revenue Million Forecast, by End-user Verticals 2019 & 2032
- Table 5: Global Multi-Vendor Support Services Industry Revenue Million Forecast, by Region 2019 & 2032
- Table 6: Global Multi-Vendor Support Services Industry Revenue Million Forecast, by Country 2019 & 2032
- Table 7: United States Multi-Vendor Support Services Industry Revenue (Million) Forecast, by Application 2019 & 2032
- Table 8: Canada Multi-Vendor Support Services Industry Revenue (Million) Forecast, by Application 2019 & 2032
- Table 9: Mexico Multi-Vendor Support Services Industry Revenue (Million) Forecast, by Application 2019 & 2032
- Table 10: Global Multi-Vendor Support Services Industry Revenue Million Forecast, by Country 2019 & 2032
- Table 11: Germany Multi-Vendor Support Services Industry Revenue (Million) Forecast, by Application 2019 & 2032
- Table 12: United Kingdom Multi-Vendor Support Services Industry Revenue (Million) Forecast, by Application 2019 & 2032
- Table 13: France Multi-Vendor Support Services Industry Revenue (Million) Forecast, by Application 2019 & 2032
- Table 14: Spain Multi-Vendor Support Services Industry Revenue (Million) Forecast, by Application 2019 & 2032
- Table 15: Italy Multi-Vendor Support Services Industry Revenue (Million) Forecast, by Application 2019 & 2032
- Table 16: Spain Multi-Vendor Support Services Industry Revenue (Million) Forecast, by Application 2019 & 2032
- Table 17: Belgium Multi-Vendor Support Services Industry Revenue (Million) Forecast, by Application 2019 & 2032
- Table 18: Netherland Multi-Vendor Support Services Industry Revenue (Million) Forecast, by Application 2019 & 2032
- Table 19: Nordics Multi-Vendor Support Services Industry Revenue (Million) Forecast, by Application 2019 & 2032
- Table 20: Rest of Europe Multi-Vendor Support Services Industry Revenue (Million) Forecast, by Application 2019 & 2032
- Table 21: Global Multi-Vendor Support Services Industry Revenue Million Forecast, by Country 2019 & 2032
- Table 22: China Multi-Vendor Support Services Industry Revenue (Million) Forecast, by Application 2019 & 2032
- Table 23: Japan Multi-Vendor Support Services Industry Revenue (Million) Forecast, by Application 2019 & 2032
- Table 24: India Multi-Vendor Support Services Industry Revenue (Million) Forecast, by Application 2019 & 2032
- Table 25: South Korea Multi-Vendor Support Services Industry Revenue (Million) Forecast, by Application 2019 & 2032
- Table 26: Southeast Asia Multi-Vendor Support Services Industry Revenue (Million) Forecast, by Application 2019 & 2032
- Table 27: Australia Multi-Vendor Support Services Industry Revenue (Million) Forecast, by Application 2019 & 2032
- Table 28: Indonesia Multi-Vendor Support Services Industry Revenue (Million) Forecast, by Application 2019 & 2032
- Table 29: Phillipes Multi-Vendor Support Services Industry Revenue (Million) Forecast, by Application 2019 & 2032
- Table 30: Singapore Multi-Vendor Support Services Industry Revenue (Million) Forecast, by Application 2019 & 2032
- Table 31: Thailandc Multi-Vendor Support Services Industry Revenue (Million) Forecast, by Application 2019 & 2032
- Table 32: Rest of Asia Pacific Multi-Vendor Support Services Industry Revenue (Million) Forecast, by Application 2019 & 2032
- Table 33: Global Multi-Vendor Support Services Industry Revenue Million Forecast, by Country 2019 & 2032
- Table 34: Brazil Multi-Vendor Support Services Industry Revenue (Million) Forecast, by Application 2019 & 2032
- Table 35: Argentina Multi-Vendor Support Services Industry Revenue (Million) Forecast, by Application 2019 & 2032
- Table 36: Peru Multi-Vendor Support Services Industry Revenue (Million) Forecast, by Application 2019 & 2032
- Table 37: Chile Multi-Vendor Support Services Industry Revenue (Million) Forecast, by Application 2019 & 2032
- Table 38: Colombia Multi-Vendor Support Services Industry Revenue (Million) Forecast, by Application 2019 & 2032
- Table 39: Ecuador Multi-Vendor Support Services Industry Revenue (Million) Forecast, by Application 2019 & 2032
- Table 40: Venezuela Multi-Vendor Support Services Industry Revenue (Million) Forecast, by Application 2019 & 2032
- Table 41: Rest of South America Multi-Vendor Support Services Industry Revenue (Million) Forecast, by Application 2019 & 2032
- Table 42: Global Multi-Vendor Support Services Industry Revenue Million Forecast, by Country 2019 & 2032
- Table 43: United States Multi-Vendor Support Services Industry Revenue (Million) Forecast, by Application 2019 & 2032
- Table 44: Canada Multi-Vendor Support Services Industry Revenue (Million) Forecast, by Application 2019 & 2032
- Table 45: Mexico Multi-Vendor Support Services Industry Revenue (Million) Forecast, by Application 2019 & 2032
- Table 46: Global Multi-Vendor Support Services Industry Revenue Million Forecast, by Country 2019 & 2032
- Table 47: United Arab Emirates Multi-Vendor Support Services Industry Revenue (Million) Forecast, by Application 2019 & 2032
- Table 48: Saudi Arabia Multi-Vendor Support Services Industry Revenue (Million) Forecast, by Application 2019 & 2032
- Table 49: South Africa Multi-Vendor Support Services Industry Revenue (Million) Forecast, by Application 2019 & 2032
- Table 50: Rest of Middle East and Africa Multi-Vendor Support Services Industry Revenue (Million) Forecast, by Application 2019 & 2032
- Table 51: Global Multi-Vendor Support Services Industry Revenue Million Forecast, by Service Type 2019 & 2032
- Table 52: Global Multi-Vendor Support Services Industry Revenue Million Forecast, by Enterprise Size 2019 & 2032
- Table 53: Global Multi-Vendor Support Services Industry Revenue Million Forecast, by End-user Verticals 2019 & 2032
- Table 54: Global Multi-Vendor Support Services Industry Revenue Million Forecast, by Country 2019 & 2032
- Table 55: Global Multi-Vendor Support Services Industry Revenue Million Forecast, by Service Type 2019 & 2032
- Table 56: Global Multi-Vendor Support Services Industry Revenue Million Forecast, by Enterprise Size 2019 & 2032
- Table 57: Global Multi-Vendor Support Services Industry Revenue Million Forecast, by End-user Verticals 2019 & 2032
- Table 58: Global Multi-Vendor Support Services Industry Revenue Million Forecast, by Country 2019 & 2032
- Table 59: Global Multi-Vendor Support Services Industry Revenue Million Forecast, by Service Type 2019 & 2032
- Table 60: Global Multi-Vendor Support Services Industry Revenue Million Forecast, by Enterprise Size 2019 & 2032
- Table 61: Global Multi-Vendor Support Services Industry Revenue Million Forecast, by End-user Verticals 2019 & 2032
- Table 62: Global Multi-Vendor Support Services Industry Revenue Million Forecast, by Country 2019 & 2032
- Table 63: Global Multi-Vendor Support Services Industry Revenue Million Forecast, by Service Type 2019 & 2032
- Table 64: Global Multi-Vendor Support Services Industry Revenue Million Forecast, by Enterprise Size 2019 & 2032
- Table 65: Global Multi-Vendor Support Services Industry Revenue Million Forecast, by End-user Verticals 2019 & 2032
- Table 66: Global Multi-Vendor Support Services Industry Revenue Million Forecast, by Country 2019 & 2032
- Table 67: Global Multi-Vendor Support Services Industry Revenue Million Forecast, by Service Type 2019 & 2032
- Table 68: Global Multi-Vendor Support Services Industry Revenue Million Forecast, by Enterprise Size 2019 & 2032
- Table 69: Global Multi-Vendor Support Services Industry Revenue Million Forecast, by End-user Verticals 2019 & 2032
- Table 70: Global Multi-Vendor Support Services Industry Revenue Million Forecast, by Country 2019 & 2032
Frequently Asked Questions
1. What is the projected Compound Annual Growth Rate (CAGR) of the Multi-Vendor Support Services Industry?
The projected CAGR is approximately 4.55%.
2. Which companies are prominent players in the Multi-Vendor Support Services Industry?
Key companies in the market include Quantum Corp, Softcat plc, IBM Corporation, Hewlett Packard Enterprise Co, Microsoft Corporation, NetApp Inc, Oracle Corporation, Dell Technologies Inc, Clear Technologies Inc, Evernex Group SAS, Blue Sky Group Ltd.
3. What are the main segments of the Multi-Vendor Support Services Industry?
The market segments include Service Type, Enterprise Size, End-user Verticals.
4. Can you provide details about the market size?
The market size is estimated to be USD 58.89 Million as of 2022.
5. What are some drivers contributing to market growth?
Rising Maintenance Cost of OEM Services.
6. What are the notable trends driving market growth?
IT & Telecommunication Vertical is Expected to Grow at a Significant Rate Over the Forecast Period.
7. Are there any restraints impacting market growth?
Expensive Integration and Maintenance activities; Concerns on Data Security and Privacy; Stringent Data Regulations Imposed in Various Regions.
8. Can you provide examples of recent developments in the market?
October 2022 - It might be challenging to troubleshoot cloud investments when using numerous cloud providers and apps. Because of this, Google Cloud Third-Party Technology Support is offered as a feature with Premium Support for Google Cloud and is designed to seamlessly resolve issues involving many vendors while also setting up, configuring, and troubleshooting organizations. Intending to foster and ensure infrastructure innovation in the cloud, HashiCorp, a Google technology partner, regularly collaborates with Google Cloud.
9. What pricing options are available for accessing the report?
Pricing options include single-user, multi-user, and enterprise licenses priced at USD 4750, USD 5250, and USD 8750 respectively.
10. Is the market size provided in terms of value or volume?
The market size is provided in terms of value, measured in Million.
11. Are there any specific market keywords associated with the report?
Yes, the market keyword associated with the report is "Multi-Vendor Support Services Industry," which aids in identifying and referencing the specific market segment covered.
12. How do I determine which pricing option suits my needs best?
The pricing options vary based on user requirements and access needs. Individual users may opt for single-user licenses, while businesses requiring broader access may choose multi-user or enterprise licenses for cost-effective access to the report.
13. Are there any additional resources or data provided in the Multi-Vendor Support Services Industry report?
While the report offers comprehensive insights, it's advisable to review the specific contents or supplementary materials provided to ascertain if additional resources or data are available.
14. How can I stay updated on further developments or reports in the Multi-Vendor Support Services Industry?
To stay informed about further developments, trends, and reports in the Multi-Vendor Support Services Industry, consider subscribing to industry newsletters, following relevant companies and organizations, or regularly checking reputable industry news sources and publications.
Methodology
Step 1 - Identification of Relevant Samples Size from Population Database


Step 2 - Approaches for Defining Global Market Size (Value, Volume* & Price*)

Note*: In applicable scenarios
Step 3 - Data Sources
Primary Research
- Web Analytics
- Survey Reports
- Research Institute
- Latest Research Reports
- Opinion Leaders
Secondary Research
- Annual Reports
- White Paper
- Latest Press Release
- Industry Association
- Paid Database
- Investor Presentations

Step 4 - Data Triangulation
Involves using different sources of information in order to increase the validity of a study
These sources are likely to be stakeholders in a program - participants, other researchers, program staff, other community members, and so on.
Then we put all data in single framework & apply various statistical tools to find out the dynamic on the market.
During the analysis stage, feedback from the stakeholder groups would be compared to determine areas of agreement as well as areas of divergence
