

Key Insights
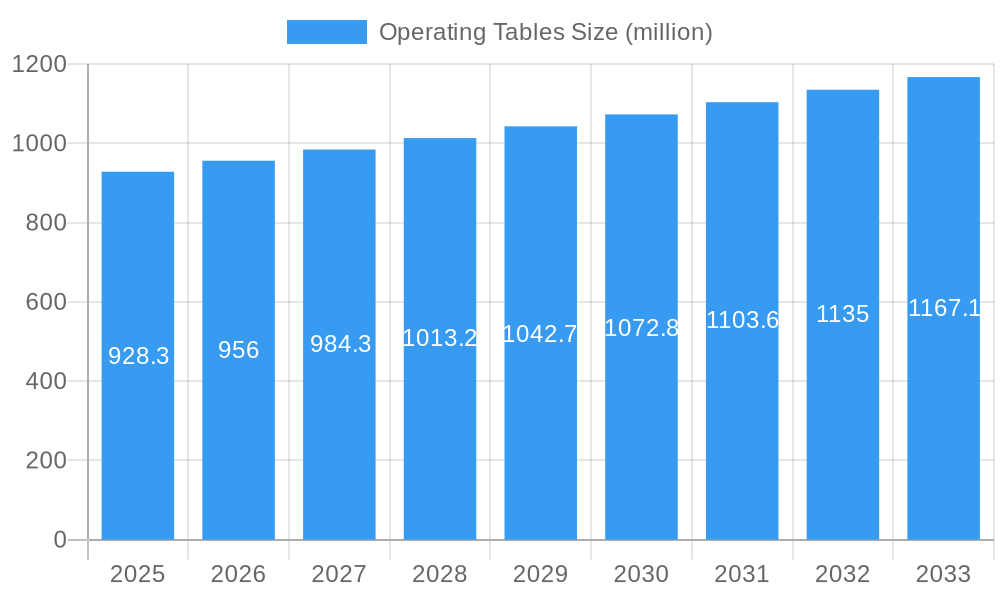
The global operating tables market, valued at $928.3 million in 2025, is projected to experience steady growth, driven by several key factors. Technological advancements leading to more sophisticated and versatile operating tables are a major impetus. These advancements include features like improved weight capacity, enhanced adjustability, and integration with other medical devices, increasing efficiency and improving patient outcomes. Furthermore, the rising prevalence of surgical procedures globally, fueled by an aging population and increased incidence of chronic diseases, significantly contributes to market expansion. The demand for minimally invasive surgical techniques also supports market growth, as these procedures often necessitate specialized operating tables that facilitate precise surgical movements. However, the market faces constraints such as high initial investment costs associated with purchasing and maintaining advanced operating tables, particularly for smaller healthcare facilities. Competitive pricing strategies and innovative financing options are crucial for manufacturers to address these challenges.
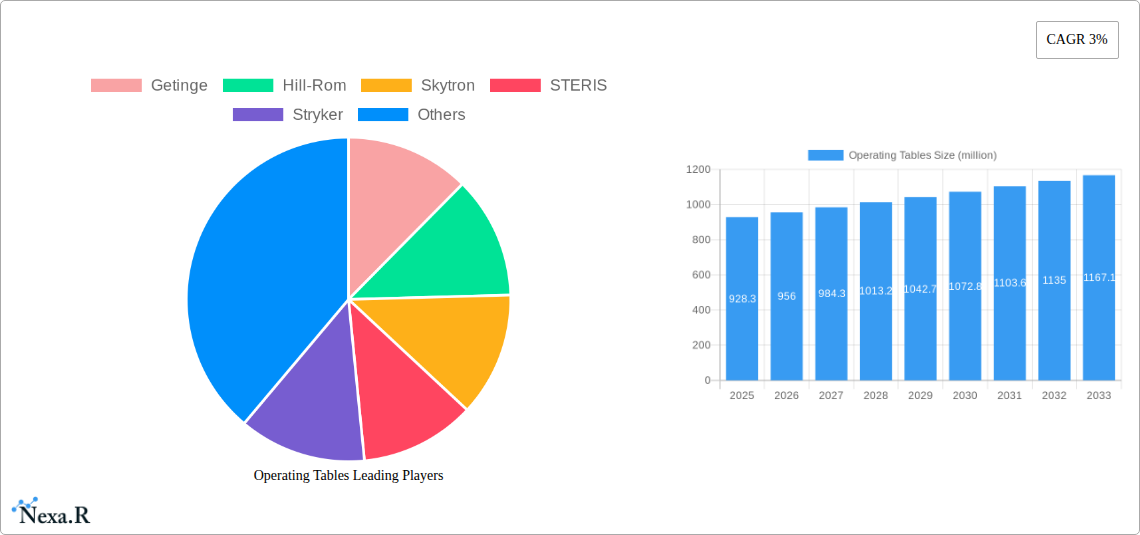
Operating Tables Market Size (In Million)
Despite these restraints, the market is expected to maintain a compound annual growth rate (CAGR) of 3% from 2025 to 2033. This moderate growth reflects a balance between consistent demand and potential market saturation in certain developed regions. Market segmentation reveals strong performance in the electromechanical operating tables segment, owing to their superior functionality and widespread adoption. Geographically, North America and Europe currently dominate the market, but emerging economies in Asia-Pacific are projected to witness significant growth, driven by increasing healthcare infrastructure investments and rising disposable incomes. Key players such as Getinge, Hill-Rom, and Stryker are focusing on product innovation, strategic partnerships, and expanding their global presence to maintain a competitive edge. The long-term outlook for the operating tables market remains positive, supported by ongoing technological advancements and the increasing demand for sophisticated surgical procedures worldwide.
Operating Tables Company Market Share
Operating Tables Market Report: 2019-2033
This comprehensive report provides a detailed analysis of the global operating tables market, encompassing market dynamics, growth trends, regional segmentation, product landscape, competitive analysis, and future outlook. The study period covers 2019-2033, with 2025 serving as the base and estimated year. The forecast period spans 2025-2033, and the historical period includes 2019-2024. The market is segmented by type, application, and end-user, with key players including Getinge, Hill-Rom, Stryker, and others, contributing to a market valued at xx million units in 2025. This report is essential for industry professionals, investors, and stakeholders seeking a thorough understanding of this critical segment within the broader medical equipment market.
Operating Tables Market Dynamics & Structure
The operating tables market exhibits moderate concentration, with a few major players holding significant market share. Technological advancements, stringent regulatory frameworks, and the emergence of substitute products significantly influence market dynamics. The market is driven by increasing surgical procedures globally, growing geriatric population, and rising demand for minimally invasive surgeries.
- Market Concentration: The top 5 players hold approximately xx% of the market share in 2025.
- Technological Innovation: Focus on features like advanced imaging integration, ergonomic designs, and improved patient safety are driving innovation. However, high R&D costs pose a barrier to entry for smaller players.
- Regulatory Landscape: Stringent regulatory approvals (e.g., FDA, CE marking) impact product launches and market entry.
- Competitive Substitutes: Limited direct substitutes exist, but alternative surgical techniques and equipment indirectly compete.
- End-User Demographics: Hospitals and surgical centers are the primary end-users, with growth driven by increasing hospital bed capacity and the rise of ambulatory surgery centers.
- M&A Trends: The past five years have seen xx M&A deals, primarily focused on expanding product portfolios and geographical reach.
Operating Tables Growth Trends & Insights
The global operating tables market experienced steady growth during the historical period (2019-2024), with a CAGR of xx%. This growth is primarily attributed to the factors outlined above. Market penetration is high in developed regions but significant untapped potential exists in emerging economies. Technological disruptions, such as the integration of robotic surgery systems and 3D printing, are transforming the market, while shifts in consumer preferences towards minimally invasive procedures are reshaping demand. The forecast period (2025-2033) anticipates a CAGR of xx%, driven by increasing healthcare expenditure and technological advancements. Market size is projected to reach xx million units by 2033.
Dominant Regions, Countries, or Segments in Operating Tables
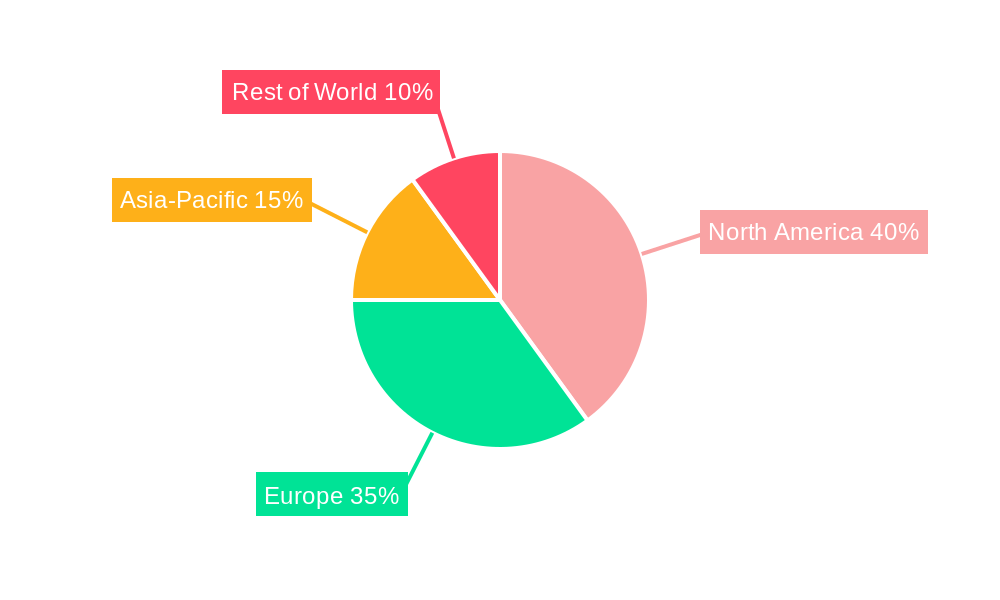
North America currently dominates the operating tables market, driven by high healthcare spending, advanced medical infrastructure, and a high prevalence of surgical procedures. However, Asia-Pacific is projected to witness the fastest growth due to rising disposable incomes, expanding healthcare infrastructure, and increasing healthcare awareness.
- North America: High market maturity, advanced technology adoption, and robust healthcare infrastructure contribute to market leadership.
- Europe: A well-established healthcare system and strong regulatory frameworks support market stability.
- Asia-Pacific: Rapid economic growth, increasing healthcare expenditure, and rising surgical procedure volumes are driving growth.
- Rest of World: Significant untapped potential, particularly in emerging economies of Latin America, the Middle East, and Africa.
Operating Tables Product Landscape
Operating tables are available in various configurations, including motorized, hydraulic, and manual models. Recent innovations include integrated imaging capabilities, advanced ergonomic designs focusing on patient comfort and safety, and enhanced adjustability for various surgical procedures. Unique selling propositions include features such as improved weight capacity, antimicrobial surfaces, and seamless integration with other surgical equipment.
Key Drivers, Barriers & Challenges in Operating Tables
Key Drivers:
- Increasing prevalence of chronic diseases requiring surgical intervention.
- Technological advancements leading to improved patient outcomes and efficiency.
- Growing demand for minimally invasive surgical procedures.
- Rising healthcare expenditure in developing countries.
Key Challenges:
- High initial investment costs for advanced operating tables can hinder adoption in resource-constrained settings.
- Stringent regulatory requirements and lengthy approval processes can delay product launches.
- Intense competition from established players and the emergence of new entrants.
- Supply chain disruptions may impact manufacturing and availability.
Emerging Opportunities in Operating Tables
- Expanding adoption of minimally invasive surgeries and robotic surgery systems presents significant growth opportunities.
- Development of specialized operating tables for specific procedures (e.g., cardiac surgery, neurosurgery).
- Penetration into untapped markets in emerging economies.
- Integration of advanced technologies such as AI and IoT for improved patient monitoring and data analysis.
Growth Accelerators in the Operating Tables Industry
Technological breakthroughs in areas such as materials science, robotics, and imaging are expected to drive long-term market growth. Strategic partnerships between manufacturers and healthcare providers will accelerate adoption. Expanding into emerging markets through strategic distribution networks and tailored product offerings will also contribute significantly.
Notable Milestones in Operating Tables Sector
- 2021: Stryker launches a new line of operating tables with enhanced imaging capabilities.
- 2022: Getinge acquires a smaller competitor, expanding its product portfolio.
- 2023: Hill-Rom introduces a new ergonomic operating table design focused on improved patient comfort.
- 2024: Several key players announce strategic partnerships to expand their market reach in emerging economies.
In-Depth Operating Tables Market Outlook
The operating tables market is poised for sustained growth over the forecast period, driven by technological advancements, increasing surgical procedures, and expansion into emerging markets. Strategic initiatives focused on product innovation, partnerships, and geographical expansion will be crucial for market leadership. The market offers significant opportunities for companies that can adapt to evolving technological trends and meet the growing demand for advanced surgical equipment.
Operating Tables Segmentation
-
1. Application
- 1.1. Hospital
- 1.2. Clinic
-
2. Types
- 2.1. Motorized
- 2.2. Non-motorized
Operating Tables Segmentation By Geography
-
1. North America
- 1.1. United States
- 1.2. Canada
- 1.3. Mexico
-
2. South America
- 2.1. Brazil
- 2.2. Argentina
- 2.3. Rest of South America
-
3. Europe
- 3.1. United Kingdom
- 3.2. Germany
- 3.3. France
- 3.4. Italy
- 3.5. Spain
- 3.6. Russia
- 3.7. Benelux
- 3.8. Nordics
- 3.9. Rest of Europe
-
4. Middle East & Africa
- 4.1. Turkey
- 4.2. Israel
- 4.3. GCC
- 4.4. North Africa
- 4.5. South Africa
- 4.6. Rest of Middle East & Africa
-
5. Asia Pacific
- 5.1. China
- 5.2. India
- 5.3. Japan
- 5.4. South Korea
- 5.5. ASEAN
- 5.6. Oceania
- 5.7. Rest of Asia Pacific
Operating Tables Regional Market Share
Geographic Coverage of Operating Tables
Operating Tables REPORT HIGHLIGHTS
| Aspects | Details |
|---|---|
| Study Period | 2020-2034 |
| Base Year | 2025 |
| Estimated Year | 2026 |
| Forecast Period | 2026-2034 |
| Historical Period | 2020-2025 |
| Growth Rate | CAGR of 3% from 2020-2034 |
| Segmentation |
|
Table of Contents
- 1. Introduction
- 1.1. Research Scope
- 1.2. Market Segmentation
- 1.3. Research Methodology
- 1.4. Definitions and Assumptions
- 2. Executive Summary
- 2.1. Introduction
- 3. Market Dynamics
- 3.1. Introduction
- 3.2. Market Drivers
- 3.3. Market Restrains
- 3.4. Market Trends
- 4. Market Factor Analysis
- 4.1. Porters Five Forces
- 4.2. Supply/Value Chain
- 4.3. PESTEL analysis
- 4.4. Market Entropy
- 4.5. Patent/Trademark Analysis
- 5. Global Operating Tables Analysis, Insights and Forecast, 2020-2032
- 5.1. Market Analysis, Insights and Forecast - by Application
- 5.1.1. Hospital
- 5.1.2. Clinic
- 5.2. Market Analysis, Insights and Forecast - by Types
- 5.2.1. Motorized
- 5.2.2. Non-motorized
- 5.3. Market Analysis, Insights and Forecast - by Region
- 5.3.1. North America
- 5.3.2. South America
- 5.3.3. Europe
- 5.3.4. Middle East & Africa
- 5.3.5. Asia Pacific
- 5.1. Market Analysis, Insights and Forecast - by Application
- 6. North America Operating Tables Analysis, Insights and Forecast, 2020-2032
- 6.1. Market Analysis, Insights and Forecast - by Application
- 6.1.1. Hospital
- 6.1.2. Clinic
- 6.2. Market Analysis, Insights and Forecast - by Types
- 6.2.1. Motorized
- 6.2.2. Non-motorized
- 6.1. Market Analysis, Insights and Forecast - by Application
- 7. South America Operating Tables Analysis, Insights and Forecast, 2020-2032
- 7.1. Market Analysis, Insights and Forecast - by Application
- 7.1.1. Hospital
- 7.1.2. Clinic
- 7.2. Market Analysis, Insights and Forecast - by Types
- 7.2.1. Motorized
- 7.2.2. Non-motorized
- 7.1. Market Analysis, Insights and Forecast - by Application
- 8. Europe Operating Tables Analysis, Insights and Forecast, 2020-2032
- 8.1. Market Analysis, Insights and Forecast - by Application
- 8.1.1. Hospital
- 8.1.2. Clinic
- 8.2. Market Analysis, Insights and Forecast - by Types
- 8.2.1. Motorized
- 8.2.2. Non-motorized
- 8.1. Market Analysis, Insights and Forecast - by Application
- 9. Middle East & Africa Operating Tables Analysis, Insights and Forecast, 2020-2032
- 9.1. Market Analysis, Insights and Forecast - by Application
- 9.1.1. Hospital
- 9.1.2. Clinic
- 9.2. Market Analysis, Insights and Forecast - by Types
- 9.2.1. Motorized
- 9.2.2. Non-motorized
- 9.1. Market Analysis, Insights and Forecast - by Application
- 10. Asia Pacific Operating Tables Analysis, Insights and Forecast, 2020-2032
- 10.1. Market Analysis, Insights and Forecast - by Application
- 10.1.1. Hospital
- 10.1.2. Clinic
- 10.2. Market Analysis, Insights and Forecast - by Types
- 10.2.1. Motorized
- 10.2.2. Non-motorized
- 10.1. Market Analysis, Insights and Forecast - by Application
- 11. Competitive Analysis
- 11.1. Global Market Share Analysis 2025
- 11.2. Company Profiles
- 11.2.1 Getinge
- 11.2.1.1. Overview
- 11.2.1.2. Products
- 11.2.1.3. SWOT Analysis
- 11.2.1.4. Recent Developments
- 11.2.1.5. Financials (Based on Availability)
- 11.2.2 Hill-Rom
- 11.2.2.1. Overview
- 11.2.2.2. Products
- 11.2.2.3. SWOT Analysis
- 11.2.2.4. Recent Developments
- 11.2.2.5. Financials (Based on Availability)
- 11.2.3 Skytron
- 11.2.3.1. Overview
- 11.2.3.2. Products
- 11.2.3.3. SWOT Analysis
- 11.2.3.4. Recent Developments
- 11.2.3.5. Financials (Based on Availability)
- 11.2.4 STERIS
- 11.2.4.1. Overview
- 11.2.4.2. Products
- 11.2.4.3. SWOT Analysis
- 11.2.4.4. Recent Developments
- 11.2.4.5. Financials (Based on Availability)
- 11.2.5 Stryker
- 11.2.5.1. Overview
- 11.2.5.2. Products
- 11.2.5.3. SWOT Analysis
- 11.2.5.4. Recent Developments
- 11.2.5.5. Financials (Based on Availability)
- 11.2.6 Mizuho
- 11.2.6.1. Overview
- 11.2.6.2. Products
- 11.2.6.3. SWOT Analysis
- 11.2.6.4. Recent Developments
- 11.2.6.5. Financials (Based on Availability)
- 11.2.7 Alvo
- 11.2.7.1. Overview
- 11.2.7.2. Products
- 11.2.7.3. SWOT Analysis
- 11.2.7.4. Recent Developments
- 11.2.7.5. Financials (Based on Availability)
- 11.2.8 UFSK-OSYS
- 11.2.8.1. Overview
- 11.2.8.2. Products
- 11.2.8.3. SWOT Analysis
- 11.2.8.4. Recent Developments
- 11.2.8.5. Financials (Based on Availability)
- 11.2.9 Medifa-hesse
- 11.2.9.1. Overview
- 11.2.9.2. Products
- 11.2.9.3. SWOT Analysis
- 11.2.9.4. Recent Developments
- 11.2.9.5. Financials (Based on Availability)
- 11.2.10 BiHealthcare
- 11.2.10.1. Overview
- 11.2.10.2. Products
- 11.2.10.3. SWOT Analysis
- 11.2.10.4. Recent Developments
- 11.2.10.5. Financials (Based on Availability)
- 11.2.11 AGA Sanitätsartikel
- 11.2.11.1. Overview
- 11.2.11.2. Products
- 11.2.11.3. SWOT Analysis
- 11.2.11.4. Recent Developments
- 11.2.11.5. Financials (Based on Availability)
- 11.2.12 Lojer
- 11.2.12.1. Overview
- 11.2.12.2. Products
- 11.2.12.3. SWOT Analysis
- 11.2.12.4. Recent Developments
- 11.2.12.5. Financials (Based on Availability)
- 11.2.13 Schmitz u. Söhne
- 11.2.13.1. Overview
- 11.2.13.2. Products
- 11.2.13.3. SWOT Analysis
- 11.2.13.4. Recent Developments
- 11.2.13.5. Financials (Based on Availability)
- 11.2.14 Schaerer Medical
- 11.2.14.1. Overview
- 11.2.14.2. Products
- 11.2.14.3. SWOT Analysis
- 11.2.14.4. Recent Developments
- 11.2.14.5. Financials (Based on Availability)
- 11.2.15 Brumaba
- 11.2.15.1. Overview
- 11.2.15.2. Products
- 11.2.15.3. SWOT Analysis
- 11.2.15.4. Recent Developments
- 11.2.15.5. Financials (Based on Availability)
- 11.2.16 Bender
- 11.2.16.1. Overview
- 11.2.16.2. Products
- 11.2.16.3. SWOT Analysis
- 11.2.16.4. Recent Developments
- 11.2.16.5. Financials (Based on Availability)
- 11.2.17 Merivaara
- 11.2.17.1. Overview
- 11.2.17.2. Products
- 11.2.17.3. SWOT Analysis
- 11.2.17.4. Recent Developments
- 11.2.17.5. Financials (Based on Availability)
- 11.2.18 Infinium Medical
- 11.2.18.1. Overview
- 11.2.18.2. Products
- 11.2.18.3. SWOT Analysis
- 11.2.18.4. Recent Developments
- 11.2.18.5. Financials (Based on Availability)
- 11.2.19 Image Diagnostics
- 11.2.19.1. Overview
- 11.2.19.2. Products
- 11.2.19.3. SWOT Analysis
- 11.2.19.4. Recent Developments
- 11.2.19.5. Financials (Based on Availability)
- 11.2.20 Mindray Medical
- 11.2.20.1. Overview
- 11.2.20.2. Products
- 11.2.20.3. SWOT Analysis
- 11.2.20.4. Recent Developments
- 11.2.20.5. Financials (Based on Availability)
- 11.2.21 PAX Medical
- 11.2.21.1. Overview
- 11.2.21.2. Products
- 11.2.21.3. SWOT Analysis
- 11.2.21.4. Recent Developments
- 11.2.21.5. Financials (Based on Availability)
- 11.2.1 Getinge
List of Figures
- Figure 1: Global Operating Tables Revenue Breakdown (million, %) by Region 2025 & 2033
- Figure 2: North America Operating Tables Revenue (million), by Application 2025 & 2033
- Figure 3: North America Operating Tables Revenue Share (%), by Application 2025 & 2033
- Figure 4: North America Operating Tables Revenue (million), by Types 2025 & 2033
- Figure 5: North America Operating Tables Revenue Share (%), by Types 2025 & 2033
- Figure 6: North America Operating Tables Revenue (million), by Country 2025 & 2033
- Figure 7: North America Operating Tables Revenue Share (%), by Country 2025 & 2033
- Figure 8: South America Operating Tables Revenue (million), by Application 2025 & 2033
- Figure 9: South America Operating Tables Revenue Share (%), by Application 2025 & 2033
- Figure 10: South America Operating Tables Revenue (million), by Types 2025 & 2033
- Figure 11: South America Operating Tables Revenue Share (%), by Types 2025 & 2033
- Figure 12: South America Operating Tables Revenue (million), by Country 2025 & 2033
- Figure 13: South America Operating Tables Revenue Share (%), by Country 2025 & 2033
- Figure 14: Europe Operating Tables Revenue (million), by Application 2025 & 2033
- Figure 15: Europe Operating Tables Revenue Share (%), by Application 2025 & 2033
- Figure 16: Europe Operating Tables Revenue (million), by Types 2025 & 2033
- Figure 17: Europe Operating Tables Revenue Share (%), by Types 2025 & 2033
- Figure 18: Europe Operating Tables Revenue (million), by Country 2025 & 2033
- Figure 19: Europe Operating Tables Revenue Share (%), by Country 2025 & 2033
- Figure 20: Middle East & Africa Operating Tables Revenue (million), by Application 2025 & 2033
- Figure 21: Middle East & Africa Operating Tables Revenue Share (%), by Application 2025 & 2033
- Figure 22: Middle East & Africa Operating Tables Revenue (million), by Types 2025 & 2033
- Figure 23: Middle East & Africa Operating Tables Revenue Share (%), by Types 2025 & 2033
- Figure 24: Middle East & Africa Operating Tables Revenue (million), by Country 2025 & 2033
- Figure 25: Middle East & Africa Operating Tables Revenue Share (%), by Country 2025 & 2033
- Figure 26: Asia Pacific Operating Tables Revenue (million), by Application 2025 & 2033
- Figure 27: Asia Pacific Operating Tables Revenue Share (%), by Application 2025 & 2033
- Figure 28: Asia Pacific Operating Tables Revenue (million), by Types 2025 & 2033
- Figure 29: Asia Pacific Operating Tables Revenue Share (%), by Types 2025 & 2033
- Figure 30: Asia Pacific Operating Tables Revenue (million), by Country 2025 & 2033
- Figure 31: Asia Pacific Operating Tables Revenue Share (%), by Country 2025 & 2033
List of Tables
- Table 1: Global Operating Tables Revenue million Forecast, by Application 2020 & 2033
- Table 2: Global Operating Tables Revenue million Forecast, by Types 2020 & 2033
- Table 3: Global Operating Tables Revenue million Forecast, by Region 2020 & 2033
- Table 4: Global Operating Tables Revenue million Forecast, by Application 2020 & 2033
- Table 5: Global Operating Tables Revenue million Forecast, by Types 2020 & 2033
- Table 6: Global Operating Tables Revenue million Forecast, by Country 2020 & 2033
- Table 7: United States Operating Tables Revenue (million) Forecast, by Application 2020 & 2033
- Table 8: Canada Operating Tables Revenue (million) Forecast, by Application 2020 & 2033
- Table 9: Mexico Operating Tables Revenue (million) Forecast, by Application 2020 & 2033
- Table 10: Global Operating Tables Revenue million Forecast, by Application 2020 & 2033
- Table 11: Global Operating Tables Revenue million Forecast, by Types 2020 & 2033
- Table 12: Global Operating Tables Revenue million Forecast, by Country 2020 & 2033
- Table 13: Brazil Operating Tables Revenue (million) Forecast, by Application 2020 & 2033
- Table 14: Argentina Operating Tables Revenue (million) Forecast, by Application 2020 & 2033
- Table 15: Rest of South America Operating Tables Revenue (million) Forecast, by Application 2020 & 2033
- Table 16: Global Operating Tables Revenue million Forecast, by Application 2020 & 2033
- Table 17: Global Operating Tables Revenue million Forecast, by Types 2020 & 2033
- Table 18: Global Operating Tables Revenue million Forecast, by Country 2020 & 2033
- Table 19: United Kingdom Operating Tables Revenue (million) Forecast, by Application 2020 & 2033
- Table 20: Germany Operating Tables Revenue (million) Forecast, by Application 2020 & 2033
- Table 21: France Operating Tables Revenue (million) Forecast, by Application 2020 & 2033
- Table 22: Italy Operating Tables Revenue (million) Forecast, by Application 2020 & 2033
- Table 23: Spain Operating Tables Revenue (million) Forecast, by Application 2020 & 2033
- Table 24: Russia Operating Tables Revenue (million) Forecast, by Application 2020 & 2033
- Table 25: Benelux Operating Tables Revenue (million) Forecast, by Application 2020 & 2033
- Table 26: Nordics Operating Tables Revenue (million) Forecast, by Application 2020 & 2033
- Table 27: Rest of Europe Operating Tables Revenue (million) Forecast, by Application 2020 & 2033
- Table 28: Global Operating Tables Revenue million Forecast, by Application 2020 & 2033
- Table 29: Global Operating Tables Revenue million Forecast, by Types 2020 & 2033
- Table 30: Global Operating Tables Revenue million Forecast, by Country 2020 & 2033
- Table 31: Turkey Operating Tables Revenue (million) Forecast, by Application 2020 & 2033
- Table 32: Israel Operating Tables Revenue (million) Forecast, by Application 2020 & 2033
- Table 33: GCC Operating Tables Revenue (million) Forecast, by Application 2020 & 2033
- Table 34: North Africa Operating Tables Revenue (million) Forecast, by Application 2020 & 2033
- Table 35: South Africa Operating Tables Revenue (million) Forecast, by Application 2020 & 2033
- Table 36: Rest of Middle East & Africa Operating Tables Revenue (million) Forecast, by Application 2020 & 2033
- Table 37: Global Operating Tables Revenue million Forecast, by Application 2020 & 2033
- Table 38: Global Operating Tables Revenue million Forecast, by Types 2020 & 2033
- Table 39: Global Operating Tables Revenue million Forecast, by Country 2020 & 2033
- Table 40: China Operating Tables Revenue (million) Forecast, by Application 2020 & 2033
- Table 41: India Operating Tables Revenue (million) Forecast, by Application 2020 & 2033
- Table 42: Japan Operating Tables Revenue (million) Forecast, by Application 2020 & 2033
- Table 43: South Korea Operating Tables Revenue (million) Forecast, by Application 2020 & 2033
- Table 44: ASEAN Operating Tables Revenue (million) Forecast, by Application 2020 & 2033
- Table 45: Oceania Operating Tables Revenue (million) Forecast, by Application 2020 & 2033
- Table 46: Rest of Asia Pacific Operating Tables Revenue (million) Forecast, by Application 2020 & 2033
Frequently Asked Questions
1. What is the projected Compound Annual Growth Rate (CAGR) of the Operating Tables?
The projected CAGR is approximately 3%.
2. Which companies are prominent players in the Operating Tables?
Key companies in the market include Getinge, Hill-Rom, Skytron, STERIS, Stryker, Mizuho, Alvo, UFSK-OSYS, Medifa-hesse, BiHealthcare, AGA Sanitätsartikel, Lojer, Schmitz u. Söhne, Schaerer Medical, Brumaba, Bender, Merivaara, Infinium Medical, Image Diagnostics, Mindray Medical, PAX Medical.
3. What are the main segments of the Operating Tables?
The market segments include Application, Types.
4. Can you provide details about the market size?
The market size is estimated to be USD 928.3 million as of 2022.
5. What are some drivers contributing to market growth?
N/A
6. What are the notable trends driving market growth?
N/A
7. Are there any restraints impacting market growth?
N/A
8. Can you provide examples of recent developments in the market?
N/A
9. What pricing options are available for accessing the report?
Pricing options include single-user, multi-user, and enterprise licenses priced at USD 4900.00, USD 7350.00, and USD 9800.00 respectively.
10. Is the market size provided in terms of value or volume?
The market size is provided in terms of value, measured in million.
11. Are there any specific market keywords associated with the report?
Yes, the market keyword associated with the report is "Operating Tables," which aids in identifying and referencing the specific market segment covered.
12. How do I determine which pricing option suits my needs best?
The pricing options vary based on user requirements and access needs. Individual users may opt for single-user licenses, while businesses requiring broader access may choose multi-user or enterprise licenses for cost-effective access to the report.
13. Are there any additional resources or data provided in the Operating Tables report?
While the report offers comprehensive insights, it's advisable to review the specific contents or supplementary materials provided to ascertain if additional resources or data are available.
14. How can I stay updated on further developments or reports in the Operating Tables?
To stay informed about further developments, trends, and reports in the Operating Tables, consider subscribing to industry newsletters, following relevant companies and organizations, or regularly checking reputable industry news sources and publications.
Methodology
Step 1 - Identification of Relevant Samples Size from Population Database


Step 2 - Approaches for Defining Global Market Size (Value, Volume* & Price*)

Note*: In applicable scenarios
Step 3 - Data Sources
Primary Research
- Web Analytics
- Survey Reports
- Research Institute
- Latest Research Reports
- Opinion Leaders
Secondary Research
- Annual Reports
- White Paper
- Latest Press Release
- Industry Association
- Paid Database
- Investor Presentations

Step 4 - Data Triangulation
Involves using different sources of information in order to increase the validity of a study
These sources are likely to be stakeholders in a program - participants, other researchers, program staff, other community members, and so on.
Then we put all data in single framework & apply various statistical tools to find out the dynamic on the market.
During the analysis stage, feedback from the stakeholder groups would be compared to determine areas of agreement as well as areas of divergence