

Key Insights
The Osteoporosis Drugs market is projected for significant expansion, estimated at $16.88 billion in 2025, with a projected Compound Annual Growth Rate (CAGR) of 4.74% through 2033. This growth is driven by the rising global incidence of osteoporosis, especially in aging demographics and among individuals with risk factors such as hormonal imbalances and chronic diseases. Increased osteoporosis screening awareness, therapeutic advancements, and supportive public health initiatives are key contributors. The market is evolving with a shift towards innovative drug classes, including RANKL Inhibitors, offering enhanced efficacy and patient convenience. Developing economies' expanding healthcare infrastructure and rising healthcare spending also broaden market access.
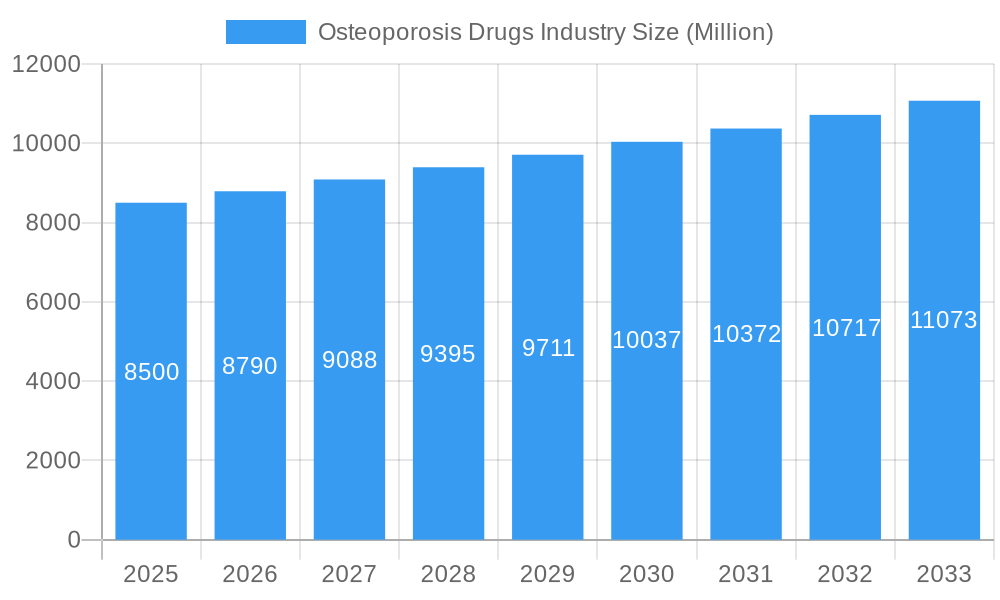
Osteoporosis Drugs Industry Market Size (In Billion)
The competitive environment features leading pharmaceutical companies like Eli Lilly and Company, Amgen Inc., and Novartis International AG, who are actively investing in R&D for novel osteoporosis treatments. The market is segmented by drug type, with Parathyroid Hormone Therapy and Bisphosphonates holding significant shares, and by application, where Primary Osteoporosis is the largest segment. However, high costs of advanced therapies and potential long-term side effects present challenges. Nevertheless, sustained demand, fueled by the persistent burden of osteoporosis globally, forecasts a positive outlook for the osteoporosis drugs sector. Ongoing innovation and strategic partnerships will likely define future market dynamics, improving patient outcomes and creating commercial prospects.
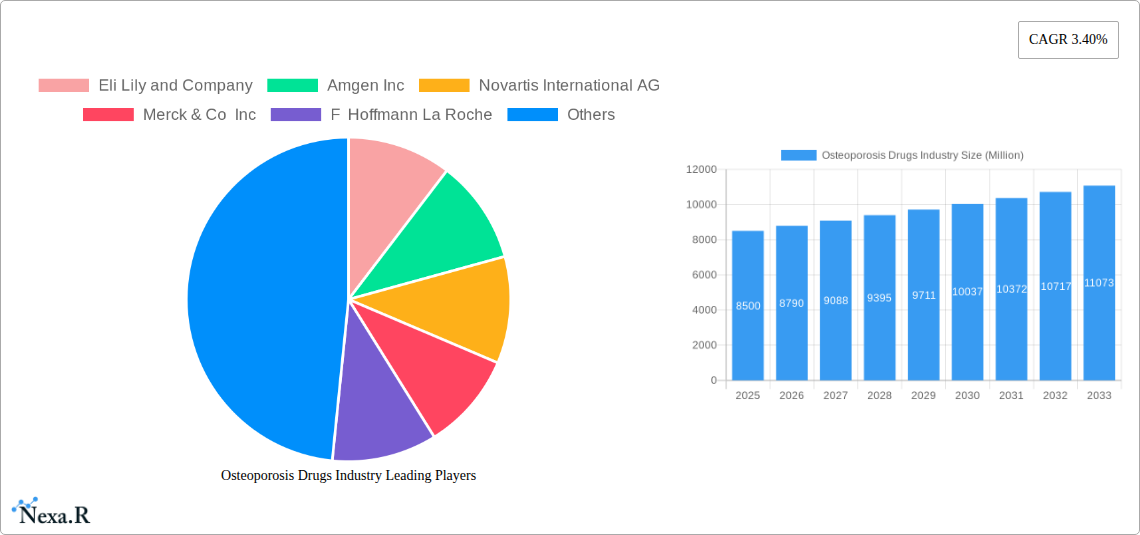
Osteoporosis Drugs Industry Company Market Share
Osteoporosis Drugs Industry: Comprehensive Market Analysis Report
This in-depth report provides a detailed examination of the global Osteoporosis Drugs market, covering market dynamics, growth trends, regional dominance, product landscape, key drivers, challenges, emerging opportunities, and the influential players shaping this vital sector. With a study period spanning from 2019 to 2033, and a base year of 2025, this report offers critical insights for industry professionals seeking to navigate the evolving landscape of osteoporosis treatment.
Osteoporosis Drugs Industry Market Dynamics & Structure
The global Osteoporosis Drugs market exhibits a moderately concentrated structure, with leading pharmaceutical giants like Eli Lilly and Company, Amgen Inc., Novartis International AG, Merck & Co Inc., and F. Hoffmann-La Roche holding significant market shares. Technological innovation remains a key driver, with continuous research and development focused on enhancing drug efficacy, reducing side effects, and exploring novel therapeutic targets. The market is shaped by stringent regulatory frameworks, primarily overseen by agencies such as the FDA and EMA, which influence drug approval processes and market access. Competitive product substitutes, including lifestyle modifications and alternative therapies, exert some pressure, but the demand for effective pharmacological interventions remains robust. End-user demographics are characterized by a rapidly aging global population, a primary risk factor for osteoporosis, and a growing awareness of bone health management. Merger and acquisition (M&A) trends, while not as frequent as in some other pharmaceutical sectors, are strategic, often involving collaborations or acquisitions to gain access to promising pipeline drugs or expand market reach. For instance, the acquisition of Radius Health Inc. by [Company Name] in 2022, valued at approximately $1.8 billion, underscored the strategic importance of innovative osteoporosis treatments. The overall market concentration is estimated to be around 60-70% held by the top five players, with innovation barriers including high R&D costs and lengthy clinical trial durations.
- Market Concentration: Moderately concentrated with top 5 players holding 60-70% market share.
- Technological Innovation Drivers: Focus on novel targets, improved efficacy, and reduced side effects.
- Regulatory Frameworks: Stringent FDA and EMA approvals impacting market entry and dynamics.
- Competitive Product Substitutes: Lifestyle modifications and alternative therapies present, but limited pharmacological alternatives.
- End-User Demographics: Aging global population is the primary demographic driver.
- M&A Trends: Strategic acquisitions and collaborations for pipeline access and market expansion.
Osteoporosis Drugs Industry Growth Trends & Insights
The Osteoporosis Drugs market is poised for significant growth, driven by an escalating global prevalence of osteoporosis and an increasing focus on preventative healthcare. The market size is projected to expand from approximately $12,500 Million units in the historical period to an estimated $18,200 Million units by 2033, exhibiting a Compound Annual Growth Rate (CAGR) of approximately 4.2%. Adoption rates for advanced therapies, particularly RANKL inhibitors and parathyroid hormone (PTH) therapies, are on the rise due to their superior efficacy in reducing fracture risk. Technological disruptions are primarily centered around the development of biosimilars and next-generation therapies with improved patient compliance and reduced administration frequency. Consumer behavior shifts are evident, with greater patient engagement in managing their bone health and a demand for personalized treatment approaches. The increasing diagnosis rates, spurred by advancements in bone density screening technologies, are further fueling market penetration. The impact of the COVID-19 pandemic led to temporary disruptions in routine healthcare access, potentially causing a slight deceleration in growth during 2020-2021, but a strong rebound is anticipated as elective procedures and regular check-ups resume. The market penetration for osteoporosis drugs is expected to reach over 55% of the at-risk population by the end of the forecast period.
Dominant Regions, Countries, or Segments in Osteoporosis Drugs Industry
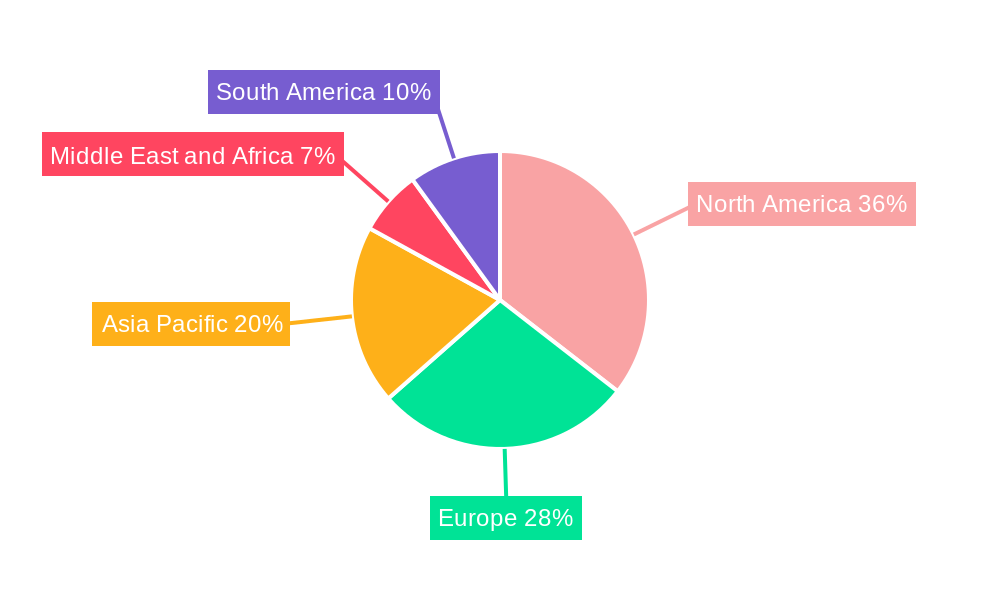
North America, particularly the United States, currently dominates the global Osteoporosis Drugs market, accounting for an estimated 40% of the total market share in 2025. This dominance is attributed to several key factors, including a high prevalence of osteoporosis due to an aging population, advanced healthcare infrastructure, robust reimbursement policies, and strong awareness campaigns regarding bone health. The United States also boasts a high adoption rate for innovative therapies and a significant presence of major pharmaceutical companies engaged in extensive research and development.
Within the Drug Type segmentation, Bisphosphonates continue to hold a substantial market share, estimated at 45% in 2025, owing to their established efficacy and cost-effectiveness. However, RANKL Inhibitors are experiencing the fastest growth, projected to capture 20% of the market by 2033, driven by their potent fracture reduction capabilities and suitability for patients who cannot tolerate bisphosphonates. Parathyroid Hormone Therapy is also a significant segment, holding approximately 15% of the market, favored for its anabolic effects on bone. Calcitonin and Other Drug Types collectively represent the remaining market share.
In terms of Application, Primary Osteoporosis accounts for the vast majority of the market, estimated at 85% in 2025, reflecting its widespread occurrence across postmenopausal women and aging men. Secondary Osteoporosis, often resulting from other medical conditions or treatments, represents the remaining 15%, an area with potential for targeted therapeutic development. Economic policies supporting advanced healthcare access and investments in osteoporosis research infrastructure further solidify North America's leading position. Europe, with its significant aging demographic and well-developed healthcare systems, represents the second-largest market, followed by the Asia Pacific region, which is witnessing rapid growth due to increasing disposable incomes, improving healthcare access, and rising disease awareness.
- Dominant Region: North America (especially the United States)
- Key Drivers: Aging population, advanced healthcare infrastructure, strong reimbursement policies, high awareness.
- Market Share (2025): ~40%
- Dominant Drug Type: Bisphosphonates
- Market Share (2025): ~45%
- Growth Driver: Established efficacy and cost-effectiveness.
- Fastest Growing Drug Type: RANKL Inhibitors
- Projected Market Share (2033): ~20%
- Growth Driver: Superior fracture reduction, alternative for bisphosphonate-intolerant patients.
- Dominant Application: Primary Osteoporosis
- Market Share (2025): ~85%
- Driver: High prevalence in aging populations.
Osteoporosis Drugs Industry Product Landscape
The Osteoporosis Drugs industry is characterized by a dynamic product landscape focused on enhancing bone mineral density and reducing fracture risk. Key innovations include the development of oral and injectable bisphosphonates with improved dosing regimens, such as yearly infusions for zoledronic acid. Parathyroid hormone (PTH) analogs, like teriparatide and abaloparatide, offer anabolic effects, stimulating bone formation. RANKL inhibitors, exemplified by denosumab, have revolutionized treatment by targeting a key pathway in bone resorption. Emerging products are exploring novel mechanisms of action, including sclerostin inhibitors, and formulations designed for greater patient convenience and adherence. Performance metrics focus on fracture reduction rates, improvements in bone mineral density (BMD), and safety profiles, with ongoing research aiming to minimize adverse events like osteonecrosis of the jaw and atypical femur fractures.
Key Drivers, Barriers & Challenges in Osteoporosis Drugs Industry
Key Drivers:
- Aging Global Population: Increasing prevalence of age-related osteoporosis.
- Rising Awareness: Enhanced understanding of bone health and fracture prevention.
- Technological Advancements: Development of more effective and patient-friendly treatments.
- Improved Diagnostic Tools: Increased detection rates through advanced bone density screening.
- Government Initiatives: Focus on public health and chronic disease management.
Key Barriers & Challenges:
- High R&D Costs and Long Development Cycles: Significant investment required for new drug discovery and clinical trials.
- Stringent Regulatory Approvals: Lengthy and complex processes for drug authorization.
- Patient Adherence Issues: Challenges in maintaining long-term treatment regimens due to side effects or complexity.
- Cost of Treatment: Advanced therapies can be expensive, leading to access issues for some patient populations.
- Off-Label Use and Counterfeit Products: Concerns regarding the safety and efficacy of unregulated alternatives.
- Supply Chain Disruptions: Global events can impact manufacturing and distribution networks.
Emerging Opportunities in Osteoporosis Drugs Industry
Emerging opportunities in the Osteoporosis Drugs industry lie in the development of personalized treatment strategies tailored to individual patient risk profiles and genetic predispositions. The growing market for biosimilars of biologics like denosumab presents a significant opportunity for market expansion and cost containment. Furthermore, exploring innovative drug delivery systems, such as long-acting injectables or oral formulations with improved bioavailability, can enhance patient adherence and treatment outcomes. Untapped markets in developing economies with a rising aging population and improving healthcare infrastructure also represent substantial growth potential. Research into therapies addressing specific types of secondary osteoporosis, such as glucocorticoid-induced osteoporosis, offers niche market opportunities.
Growth Accelerators in the Osteoporosis Drugs Industry Industry
Long-term growth in the Osteoporosis Drugs industry is being accelerated by several key catalysts. Continued advancements in understanding bone biology are leading to the discovery of novel therapeutic targets, paving the way for next-generation drugs with enhanced efficacy and safety profiles. Strategic partnerships between pharmaceutical companies and academic research institutions are crucial for fostering innovation and expediting drug development. Market expansion strategies, particularly in emerging economies, driven by increasing disposable incomes and a growing emphasis on public health, are opening up new avenues for revenue generation. The increasing demand for combination therapies that address multiple pathways of bone remodeling is also a significant growth accelerator.
Key Players Shaping the Osteoporosis Drugs Industry Market
- Eli Lilly and Company
- Amgen Inc.
- Novartis International AG
- Merck & Co Inc.
- F. Hoffmann La Roche
- Teva Pharmaceutical Industries Ltd
- Actavis PLC
- Radius Health Inc.
- GlaxoSmithKline PLC
- Pfizer Inc.
Notable Milestones in Osteoporosis Drugs Industry Sector
- August 2021: Enzene Biosciences Ltd received Marketing Authorization (MA) from the Drug Controller General of India (DCGI) for its biosimilar drug, denosumab, indicated for the treatment of osteoporosis in adults. This milestone signifies the growing availability of cost-effective biologic options.
- January 2021: Theramex, a London-headquartered pharmaceutical company, launched the osteoporosis medicine Livogiva in Europe. This launch expands the therapeutic choices for European patients and underscores ongoing product introductions in the market.
In-Depth Osteoporosis Drugs Industry Market Outlook
The future outlook for the Osteoporosis Drugs market is exceptionally positive, driven by persistent demographic trends and ongoing scientific breakthroughs. The increasing global life expectancy and the associated rise in the aging population directly translate into a sustained and growing demand for effective osteoporosis treatments. Continued investment in research and development promises a pipeline of innovative therapies, including biologics with novel mechanisms of action and potentially curative approaches. Strategic collaborations and the expansion of market access in emerging economies are set to further propel market growth. The focus on patient-centric care, emphasizing adherence and personalized treatment plans, will shape product development and commercialization strategies, ensuring a robust and expanding market for years to come.
Osteoporosis Drugs Industry Segmentation
-
1. Drug Type
- 1.1. Parathyroid Hormone Therapy
- 1.2. Bisphosphonates
- 1.3. Calcitonin
- 1.4. RANKL Inhibitors
- 1.5. Other Drug Types
-
2. Application
- 2.1. Primary Osteoporosis
- 2.2. Secondary Osteoporosis
Osteoporosis Drugs Industry Segmentation By Geography
-
1. North America
- 1.1. United States
- 1.2. Canada
- 1.3. Mexico
-
2. Europe
- 2.1. Germany
- 2.2. United Kingdom
- 2.3. France
- 2.4. Italy
- 2.5. Spain
- 2.6. Rest of Europe
-
3. Asia Pacific
- 3.1. China
- 3.2. Japan
- 3.3. India
- 3.4. Australia
- 3.5. South Korea
- 3.6. Rest of Asia Pacific
-
4. Middle East and Africa
- 4.1. GCC
- 4.2. South Africa
- 4.3. Rest of Middle East and Africa
-
5. South America
- 5.1. Brazil
- 5.2. Argentina
- 5.3. Rest of South America
Osteoporosis Drugs Industry Regional Market Share
Geographic Coverage of Osteoporosis Drugs Industry
Osteoporosis Drugs Industry REPORT HIGHLIGHTS
| Aspects | Details |
|---|---|
| Study Period | 2020-2034 |
| Base Year | 2025 |
| Estimated Year | 2026 |
| Forecast Period | 2026-2034 |
| Historical Period | 2020-2025 |
| Growth Rate | CAGR of 4.74% from 2020-2034 |
| Segmentation |
|
Table of Contents
- 1. Introduction
- 1.1. Research Scope
- 1.2. Market Segmentation
- 1.3. Research Methodology
- 1.4. Definitions and Assumptions
- 2. Executive Summary
- 2.1. Introduction
- 3. Market Dynamics
- 3.1. Introduction
- 3.2. Market Drivers
- 3.2.1. Increasing Incidences of Osteoporosis; Rise in the Geriatric Populations
- 3.3. Market Restrains
- 3.3.1. Stringent Regulatory Environment
- 3.4. Market Trends
- 3.4.1. The RANK Ligand Inhibitors Segment is Expected to Dominate the Market Over the Forecast Period
- 4. Market Factor Analysis
- 4.1. Porters Five Forces
- 4.2. Supply/Value Chain
- 4.3. PESTEL analysis
- 4.4. Market Entropy
- 4.5. Patent/Trademark Analysis
- 5. Global Osteoporosis Drugs Industry Analysis, Insights and Forecast, 2020-2032
- 5.1. Market Analysis, Insights and Forecast - by Drug Type
- 5.1.1. Parathyroid Hormone Therapy
- 5.1.2. Bisphosphonates
- 5.1.3. Calcitonin
- 5.1.4. RANKL Inhibitors
- 5.1.5. Other Drug Types
- 5.2. Market Analysis, Insights and Forecast - by Application
- 5.2.1. Primary Osteoporosis
- 5.2.2. Secondary Osteoporosis
- 5.3. Market Analysis, Insights and Forecast - by Region
- 5.3.1. North America
- 5.3.2. Europe
- 5.3.3. Asia Pacific
- 5.3.4. Middle East and Africa
- 5.3.5. South America
- 5.1. Market Analysis, Insights and Forecast - by Drug Type
- 6. North America Osteoporosis Drugs Industry Analysis, Insights and Forecast, 2020-2032
- 6.1. Market Analysis, Insights and Forecast - by Drug Type
- 6.1.1. Parathyroid Hormone Therapy
- 6.1.2. Bisphosphonates
- 6.1.3. Calcitonin
- 6.1.4. RANKL Inhibitors
- 6.1.5. Other Drug Types
- 6.2. Market Analysis, Insights and Forecast - by Application
- 6.2.1. Primary Osteoporosis
- 6.2.2. Secondary Osteoporosis
- 6.1. Market Analysis, Insights and Forecast - by Drug Type
- 7. Europe Osteoporosis Drugs Industry Analysis, Insights and Forecast, 2020-2032
- 7.1. Market Analysis, Insights and Forecast - by Drug Type
- 7.1.1. Parathyroid Hormone Therapy
- 7.1.2. Bisphosphonates
- 7.1.3. Calcitonin
- 7.1.4. RANKL Inhibitors
- 7.1.5. Other Drug Types
- 7.2. Market Analysis, Insights and Forecast - by Application
- 7.2.1. Primary Osteoporosis
- 7.2.2. Secondary Osteoporosis
- 7.1. Market Analysis, Insights and Forecast - by Drug Type
- 8. Asia Pacific Osteoporosis Drugs Industry Analysis, Insights and Forecast, 2020-2032
- 8.1. Market Analysis, Insights and Forecast - by Drug Type
- 8.1.1. Parathyroid Hormone Therapy
- 8.1.2. Bisphosphonates
- 8.1.3. Calcitonin
- 8.1.4. RANKL Inhibitors
- 8.1.5. Other Drug Types
- 8.2. Market Analysis, Insights and Forecast - by Application
- 8.2.1. Primary Osteoporosis
- 8.2.2. Secondary Osteoporosis
- 8.1. Market Analysis, Insights and Forecast - by Drug Type
- 9. Middle East and Africa Osteoporosis Drugs Industry Analysis, Insights and Forecast, 2020-2032
- 9.1. Market Analysis, Insights and Forecast - by Drug Type
- 9.1.1. Parathyroid Hormone Therapy
- 9.1.2. Bisphosphonates
- 9.1.3. Calcitonin
- 9.1.4. RANKL Inhibitors
- 9.1.5. Other Drug Types
- 9.2. Market Analysis, Insights and Forecast - by Application
- 9.2.1. Primary Osteoporosis
- 9.2.2. Secondary Osteoporosis
- 9.1. Market Analysis, Insights and Forecast - by Drug Type
- 10. South America Osteoporosis Drugs Industry Analysis, Insights and Forecast, 2020-2032
- 10.1. Market Analysis, Insights and Forecast - by Drug Type
- 10.1.1. Parathyroid Hormone Therapy
- 10.1.2. Bisphosphonates
- 10.1.3. Calcitonin
- 10.1.4. RANKL Inhibitors
- 10.1.5. Other Drug Types
- 10.2. Market Analysis, Insights and Forecast - by Application
- 10.2.1. Primary Osteoporosis
- 10.2.2. Secondary Osteoporosis
- 10.1. Market Analysis, Insights and Forecast - by Drug Type
- 11. Competitive Analysis
- 11.1. Global Market Share Analysis 2025
- 11.2. Company Profiles
- 11.2.1 Eli Lily and Company
- 11.2.1.1. Overview
- 11.2.1.2. Products
- 11.2.1.3. SWOT Analysis
- 11.2.1.4. Recent Developments
- 11.2.1.5. Financials (Based on Availability)
- 11.2.2 Amgen Inc
- 11.2.2.1. Overview
- 11.2.2.2. Products
- 11.2.2.3. SWOT Analysis
- 11.2.2.4. Recent Developments
- 11.2.2.5. Financials (Based on Availability)
- 11.2.3 Novartis International AG
- 11.2.3.1. Overview
- 11.2.3.2. Products
- 11.2.3.3. SWOT Analysis
- 11.2.3.4. Recent Developments
- 11.2.3.5. Financials (Based on Availability)
- 11.2.4 Merck & Co Inc
- 11.2.4.1. Overview
- 11.2.4.2. Products
- 11.2.4.3. SWOT Analysis
- 11.2.4.4. Recent Developments
- 11.2.4.5. Financials (Based on Availability)
- 11.2.5 F Hoffmann La Roche
- 11.2.5.1. Overview
- 11.2.5.2. Products
- 11.2.5.3. SWOT Analysis
- 11.2.5.4. Recent Developments
- 11.2.5.5. Financials (Based on Availability)
- 11.2.6 Teva Pharmaceutical Industries Ltd
- 11.2.6.1. Overview
- 11.2.6.2. Products
- 11.2.6.3. SWOT Analysis
- 11.2.6.4. Recent Developments
- 11.2.6.5. Financials (Based on Availability)
- 11.2.7 Actavis PLC
- 11.2.7.1. Overview
- 11.2.7.2. Products
- 11.2.7.3. SWOT Analysis
- 11.2.7.4. Recent Developments
- 11.2.7.5. Financials (Based on Availability)
- 11.2.8 Radius Health Inc
- 11.2.8.1. Overview
- 11.2.8.2. Products
- 11.2.8.3. SWOT Analysis
- 11.2.8.4. Recent Developments
- 11.2.8.5. Financials (Based on Availability)
- 11.2.9 GlaxoSmithKline PLC
- 11.2.9.1. Overview
- 11.2.9.2. Products
- 11.2.9.3. SWOT Analysis
- 11.2.9.4. Recent Developments
- 11.2.9.5. Financials (Based on Availability)
- 11.2.10 Pfizer Inc
- 11.2.10.1. Overview
- 11.2.10.2. Products
- 11.2.10.3. SWOT Analysis
- 11.2.10.4. Recent Developments
- 11.2.10.5. Financials (Based on Availability)
- 11.2.1 Eli Lily and Company
List of Figures
- Figure 1: Global Osteoporosis Drugs Industry Revenue Breakdown (billion, %) by Region 2025 & 2033
- Figure 2: Global Osteoporosis Drugs Industry Volume Breakdown (K Unit, %) by Region 2025 & 2033
- Figure 3: North America Osteoporosis Drugs Industry Revenue (billion), by Drug Type 2025 & 2033
- Figure 4: North America Osteoporosis Drugs Industry Volume (K Unit), by Drug Type 2025 & 2033
- Figure 5: North America Osteoporosis Drugs Industry Revenue Share (%), by Drug Type 2025 & 2033
- Figure 6: North America Osteoporosis Drugs Industry Volume Share (%), by Drug Type 2025 & 2033
- Figure 7: North America Osteoporosis Drugs Industry Revenue (billion), by Application 2025 & 2033
- Figure 8: North America Osteoporosis Drugs Industry Volume (K Unit), by Application 2025 & 2033
- Figure 9: North America Osteoporosis Drugs Industry Revenue Share (%), by Application 2025 & 2033
- Figure 10: North America Osteoporosis Drugs Industry Volume Share (%), by Application 2025 & 2033
- Figure 11: North America Osteoporosis Drugs Industry Revenue (billion), by Country 2025 & 2033
- Figure 12: North America Osteoporosis Drugs Industry Volume (K Unit), by Country 2025 & 2033
- Figure 13: North America Osteoporosis Drugs Industry Revenue Share (%), by Country 2025 & 2033
- Figure 14: North America Osteoporosis Drugs Industry Volume Share (%), by Country 2025 & 2033
- Figure 15: Europe Osteoporosis Drugs Industry Revenue (billion), by Drug Type 2025 & 2033
- Figure 16: Europe Osteoporosis Drugs Industry Volume (K Unit), by Drug Type 2025 & 2033
- Figure 17: Europe Osteoporosis Drugs Industry Revenue Share (%), by Drug Type 2025 & 2033
- Figure 18: Europe Osteoporosis Drugs Industry Volume Share (%), by Drug Type 2025 & 2033
- Figure 19: Europe Osteoporosis Drugs Industry Revenue (billion), by Application 2025 & 2033
- Figure 20: Europe Osteoporosis Drugs Industry Volume (K Unit), by Application 2025 & 2033
- Figure 21: Europe Osteoporosis Drugs Industry Revenue Share (%), by Application 2025 & 2033
- Figure 22: Europe Osteoporosis Drugs Industry Volume Share (%), by Application 2025 & 2033
- Figure 23: Europe Osteoporosis Drugs Industry Revenue (billion), by Country 2025 & 2033
- Figure 24: Europe Osteoporosis Drugs Industry Volume (K Unit), by Country 2025 & 2033
- Figure 25: Europe Osteoporosis Drugs Industry Revenue Share (%), by Country 2025 & 2033
- Figure 26: Europe Osteoporosis Drugs Industry Volume Share (%), by Country 2025 & 2033
- Figure 27: Asia Pacific Osteoporosis Drugs Industry Revenue (billion), by Drug Type 2025 & 2033
- Figure 28: Asia Pacific Osteoporosis Drugs Industry Volume (K Unit), by Drug Type 2025 & 2033
- Figure 29: Asia Pacific Osteoporosis Drugs Industry Revenue Share (%), by Drug Type 2025 & 2033
- Figure 30: Asia Pacific Osteoporosis Drugs Industry Volume Share (%), by Drug Type 2025 & 2033
- Figure 31: Asia Pacific Osteoporosis Drugs Industry Revenue (billion), by Application 2025 & 2033
- Figure 32: Asia Pacific Osteoporosis Drugs Industry Volume (K Unit), by Application 2025 & 2033
- Figure 33: Asia Pacific Osteoporosis Drugs Industry Revenue Share (%), by Application 2025 & 2033
- Figure 34: Asia Pacific Osteoporosis Drugs Industry Volume Share (%), by Application 2025 & 2033
- Figure 35: Asia Pacific Osteoporosis Drugs Industry Revenue (billion), by Country 2025 & 2033
- Figure 36: Asia Pacific Osteoporosis Drugs Industry Volume (K Unit), by Country 2025 & 2033
- Figure 37: Asia Pacific Osteoporosis Drugs Industry Revenue Share (%), by Country 2025 & 2033
- Figure 38: Asia Pacific Osteoporosis Drugs Industry Volume Share (%), by Country 2025 & 2033
- Figure 39: Middle East and Africa Osteoporosis Drugs Industry Revenue (billion), by Drug Type 2025 & 2033
- Figure 40: Middle East and Africa Osteoporosis Drugs Industry Volume (K Unit), by Drug Type 2025 & 2033
- Figure 41: Middle East and Africa Osteoporosis Drugs Industry Revenue Share (%), by Drug Type 2025 & 2033
- Figure 42: Middle East and Africa Osteoporosis Drugs Industry Volume Share (%), by Drug Type 2025 & 2033
- Figure 43: Middle East and Africa Osteoporosis Drugs Industry Revenue (billion), by Application 2025 & 2033
- Figure 44: Middle East and Africa Osteoporosis Drugs Industry Volume (K Unit), by Application 2025 & 2033
- Figure 45: Middle East and Africa Osteoporosis Drugs Industry Revenue Share (%), by Application 2025 & 2033
- Figure 46: Middle East and Africa Osteoporosis Drugs Industry Volume Share (%), by Application 2025 & 2033
- Figure 47: Middle East and Africa Osteoporosis Drugs Industry Revenue (billion), by Country 2025 & 2033
- Figure 48: Middle East and Africa Osteoporosis Drugs Industry Volume (K Unit), by Country 2025 & 2033
- Figure 49: Middle East and Africa Osteoporosis Drugs Industry Revenue Share (%), by Country 2025 & 2033
- Figure 50: Middle East and Africa Osteoporosis Drugs Industry Volume Share (%), by Country 2025 & 2033
- Figure 51: South America Osteoporosis Drugs Industry Revenue (billion), by Drug Type 2025 & 2033
- Figure 52: South America Osteoporosis Drugs Industry Volume (K Unit), by Drug Type 2025 & 2033
- Figure 53: South America Osteoporosis Drugs Industry Revenue Share (%), by Drug Type 2025 & 2033
- Figure 54: South America Osteoporosis Drugs Industry Volume Share (%), by Drug Type 2025 & 2033
- Figure 55: South America Osteoporosis Drugs Industry Revenue (billion), by Application 2025 & 2033
- Figure 56: South America Osteoporosis Drugs Industry Volume (K Unit), by Application 2025 & 2033
- Figure 57: South America Osteoporosis Drugs Industry Revenue Share (%), by Application 2025 & 2033
- Figure 58: South America Osteoporosis Drugs Industry Volume Share (%), by Application 2025 & 2033
- Figure 59: South America Osteoporosis Drugs Industry Revenue (billion), by Country 2025 & 2033
- Figure 60: South America Osteoporosis Drugs Industry Volume (K Unit), by Country 2025 & 2033
- Figure 61: South America Osteoporosis Drugs Industry Revenue Share (%), by Country 2025 & 2033
- Figure 62: South America Osteoporosis Drugs Industry Volume Share (%), by Country 2025 & 2033
List of Tables
- Table 1: Global Osteoporosis Drugs Industry Revenue billion Forecast, by Drug Type 2020 & 2033
- Table 2: Global Osteoporosis Drugs Industry Volume K Unit Forecast, by Drug Type 2020 & 2033
- Table 3: Global Osteoporosis Drugs Industry Revenue billion Forecast, by Application 2020 & 2033
- Table 4: Global Osteoporosis Drugs Industry Volume K Unit Forecast, by Application 2020 & 2033
- Table 5: Global Osteoporosis Drugs Industry Revenue billion Forecast, by Region 2020 & 2033
- Table 6: Global Osteoporosis Drugs Industry Volume K Unit Forecast, by Region 2020 & 2033
- Table 7: Global Osteoporosis Drugs Industry Revenue billion Forecast, by Drug Type 2020 & 2033
- Table 8: Global Osteoporosis Drugs Industry Volume K Unit Forecast, by Drug Type 2020 & 2033
- Table 9: Global Osteoporosis Drugs Industry Revenue billion Forecast, by Application 2020 & 2033
- Table 10: Global Osteoporosis Drugs Industry Volume K Unit Forecast, by Application 2020 & 2033
- Table 11: Global Osteoporosis Drugs Industry Revenue billion Forecast, by Country 2020 & 2033
- Table 12: Global Osteoporosis Drugs Industry Volume K Unit Forecast, by Country 2020 & 2033
- Table 13: United States Osteoporosis Drugs Industry Revenue (billion) Forecast, by Application 2020 & 2033
- Table 14: United States Osteoporosis Drugs Industry Volume (K Unit) Forecast, by Application 2020 & 2033
- Table 15: Canada Osteoporosis Drugs Industry Revenue (billion) Forecast, by Application 2020 & 2033
- Table 16: Canada Osteoporosis Drugs Industry Volume (K Unit) Forecast, by Application 2020 & 2033
- Table 17: Mexico Osteoporosis Drugs Industry Revenue (billion) Forecast, by Application 2020 & 2033
- Table 18: Mexico Osteoporosis Drugs Industry Volume (K Unit) Forecast, by Application 2020 & 2033
- Table 19: Global Osteoporosis Drugs Industry Revenue billion Forecast, by Drug Type 2020 & 2033
- Table 20: Global Osteoporosis Drugs Industry Volume K Unit Forecast, by Drug Type 2020 & 2033
- Table 21: Global Osteoporosis Drugs Industry Revenue billion Forecast, by Application 2020 & 2033
- Table 22: Global Osteoporosis Drugs Industry Volume K Unit Forecast, by Application 2020 & 2033
- Table 23: Global Osteoporosis Drugs Industry Revenue billion Forecast, by Country 2020 & 2033
- Table 24: Global Osteoporosis Drugs Industry Volume K Unit Forecast, by Country 2020 & 2033
- Table 25: Germany Osteoporosis Drugs Industry Revenue (billion) Forecast, by Application 2020 & 2033
- Table 26: Germany Osteoporosis Drugs Industry Volume (K Unit) Forecast, by Application 2020 & 2033
- Table 27: United Kingdom Osteoporosis Drugs Industry Revenue (billion) Forecast, by Application 2020 & 2033
- Table 28: United Kingdom Osteoporosis Drugs Industry Volume (K Unit) Forecast, by Application 2020 & 2033
- Table 29: France Osteoporosis Drugs Industry Revenue (billion) Forecast, by Application 2020 & 2033
- Table 30: France Osteoporosis Drugs Industry Volume (K Unit) Forecast, by Application 2020 & 2033
- Table 31: Italy Osteoporosis Drugs Industry Revenue (billion) Forecast, by Application 2020 & 2033
- Table 32: Italy Osteoporosis Drugs Industry Volume (K Unit) Forecast, by Application 2020 & 2033
- Table 33: Spain Osteoporosis Drugs Industry Revenue (billion) Forecast, by Application 2020 & 2033
- Table 34: Spain Osteoporosis Drugs Industry Volume (K Unit) Forecast, by Application 2020 & 2033
- Table 35: Rest of Europe Osteoporosis Drugs Industry Revenue (billion) Forecast, by Application 2020 & 2033
- Table 36: Rest of Europe Osteoporosis Drugs Industry Volume (K Unit) Forecast, by Application 2020 & 2033
- Table 37: Global Osteoporosis Drugs Industry Revenue billion Forecast, by Drug Type 2020 & 2033
- Table 38: Global Osteoporosis Drugs Industry Volume K Unit Forecast, by Drug Type 2020 & 2033
- Table 39: Global Osteoporosis Drugs Industry Revenue billion Forecast, by Application 2020 & 2033
- Table 40: Global Osteoporosis Drugs Industry Volume K Unit Forecast, by Application 2020 & 2033
- Table 41: Global Osteoporosis Drugs Industry Revenue billion Forecast, by Country 2020 & 2033
- Table 42: Global Osteoporosis Drugs Industry Volume K Unit Forecast, by Country 2020 & 2033
- Table 43: China Osteoporosis Drugs Industry Revenue (billion) Forecast, by Application 2020 & 2033
- Table 44: China Osteoporosis Drugs Industry Volume (K Unit) Forecast, by Application 2020 & 2033
- Table 45: Japan Osteoporosis Drugs Industry Revenue (billion) Forecast, by Application 2020 & 2033
- Table 46: Japan Osteoporosis Drugs Industry Volume (K Unit) Forecast, by Application 2020 & 2033
- Table 47: India Osteoporosis Drugs Industry Revenue (billion) Forecast, by Application 2020 & 2033
- Table 48: India Osteoporosis Drugs Industry Volume (K Unit) Forecast, by Application 2020 & 2033
- Table 49: Australia Osteoporosis Drugs Industry Revenue (billion) Forecast, by Application 2020 & 2033
- Table 50: Australia Osteoporosis Drugs Industry Volume (K Unit) Forecast, by Application 2020 & 2033
- Table 51: South Korea Osteoporosis Drugs Industry Revenue (billion) Forecast, by Application 2020 & 2033
- Table 52: South Korea Osteoporosis Drugs Industry Volume (K Unit) Forecast, by Application 2020 & 2033
- Table 53: Rest of Asia Pacific Osteoporosis Drugs Industry Revenue (billion) Forecast, by Application 2020 & 2033
- Table 54: Rest of Asia Pacific Osteoporosis Drugs Industry Volume (K Unit) Forecast, by Application 2020 & 2033
- Table 55: Global Osteoporosis Drugs Industry Revenue billion Forecast, by Drug Type 2020 & 2033
- Table 56: Global Osteoporosis Drugs Industry Volume K Unit Forecast, by Drug Type 2020 & 2033
- Table 57: Global Osteoporosis Drugs Industry Revenue billion Forecast, by Application 2020 & 2033
- Table 58: Global Osteoporosis Drugs Industry Volume K Unit Forecast, by Application 2020 & 2033
- Table 59: Global Osteoporosis Drugs Industry Revenue billion Forecast, by Country 2020 & 2033
- Table 60: Global Osteoporosis Drugs Industry Volume K Unit Forecast, by Country 2020 & 2033
- Table 61: GCC Osteoporosis Drugs Industry Revenue (billion) Forecast, by Application 2020 & 2033
- Table 62: GCC Osteoporosis Drugs Industry Volume (K Unit) Forecast, by Application 2020 & 2033
- Table 63: South Africa Osteoporosis Drugs Industry Revenue (billion) Forecast, by Application 2020 & 2033
- Table 64: South Africa Osteoporosis Drugs Industry Volume (K Unit) Forecast, by Application 2020 & 2033
- Table 65: Rest of Middle East and Africa Osteoporosis Drugs Industry Revenue (billion) Forecast, by Application 2020 & 2033
- Table 66: Rest of Middle East and Africa Osteoporosis Drugs Industry Volume (K Unit) Forecast, by Application 2020 & 2033
- Table 67: Global Osteoporosis Drugs Industry Revenue billion Forecast, by Drug Type 2020 & 2033
- Table 68: Global Osteoporosis Drugs Industry Volume K Unit Forecast, by Drug Type 2020 & 2033
- Table 69: Global Osteoporosis Drugs Industry Revenue billion Forecast, by Application 2020 & 2033
- Table 70: Global Osteoporosis Drugs Industry Volume K Unit Forecast, by Application 2020 & 2033
- Table 71: Global Osteoporosis Drugs Industry Revenue billion Forecast, by Country 2020 & 2033
- Table 72: Global Osteoporosis Drugs Industry Volume K Unit Forecast, by Country 2020 & 2033
- Table 73: Brazil Osteoporosis Drugs Industry Revenue (billion) Forecast, by Application 2020 & 2033
- Table 74: Brazil Osteoporosis Drugs Industry Volume (K Unit) Forecast, by Application 2020 & 2033
- Table 75: Argentina Osteoporosis Drugs Industry Revenue (billion) Forecast, by Application 2020 & 2033
- Table 76: Argentina Osteoporosis Drugs Industry Volume (K Unit) Forecast, by Application 2020 & 2033
- Table 77: Rest of South America Osteoporosis Drugs Industry Revenue (billion) Forecast, by Application 2020 & 2033
- Table 78: Rest of South America Osteoporosis Drugs Industry Volume (K Unit) Forecast, by Application 2020 & 2033
Frequently Asked Questions
1. What is the projected Compound Annual Growth Rate (CAGR) of the Osteoporosis Drugs Industry?
The projected CAGR is approximately 4.74%.
2. Which companies are prominent players in the Osteoporosis Drugs Industry?
Key companies in the market include Eli Lily and Company, Amgen Inc, Novartis International AG, Merck & Co Inc, F Hoffmann La Roche, Teva Pharmaceutical Industries Ltd, Actavis PLC, Radius Health Inc, GlaxoSmithKline PLC, Pfizer Inc.
3. What are the main segments of the Osteoporosis Drugs Industry?
The market segments include Drug Type, Application.
4. Can you provide details about the market size?
The market size is estimated to be USD 16.88 billion as of 2022.
5. What are some drivers contributing to market growth?
Increasing Incidences of Osteoporosis; Rise in the Geriatric Populations.
6. What are the notable trends driving market growth?
The RANK Ligand Inhibitors Segment is Expected to Dominate the Market Over the Forecast Period.
7. Are there any restraints impacting market growth?
Stringent Regulatory Environment.
8. Can you provide examples of recent developments in the market?
In August 2021, Enzene Biosciences Ltd received Marketing Authorization (MA) from the Drug Controller General of India (DCGI) for its biosimilar drug, denosumab, indicated for the treatment of osteoporosis in adults.
9. What pricing options are available for accessing the report?
Pricing options include single-user, multi-user, and enterprise licenses priced at USD 4750, USD 5250, and USD 8750 respectively.
10. Is the market size provided in terms of value or volume?
The market size is provided in terms of value, measured in billion and volume, measured in K Unit.
11. Are there any specific market keywords associated with the report?
Yes, the market keyword associated with the report is "Osteoporosis Drugs Industry," which aids in identifying and referencing the specific market segment covered.
12. How do I determine which pricing option suits my needs best?
The pricing options vary based on user requirements and access needs. Individual users may opt for single-user licenses, while businesses requiring broader access may choose multi-user or enterprise licenses for cost-effective access to the report.
13. Are there any additional resources or data provided in the Osteoporosis Drugs Industry report?
While the report offers comprehensive insights, it's advisable to review the specific contents or supplementary materials provided to ascertain if additional resources or data are available.
14. How can I stay updated on further developments or reports in the Osteoporosis Drugs Industry?
To stay informed about further developments, trends, and reports in the Osteoporosis Drugs Industry, consider subscribing to industry newsletters, following relevant companies and organizations, or regularly checking reputable industry news sources and publications.
Methodology
Step 1 - Identification of Relevant Samples Size from Population Database


Step 2 - Approaches for Defining Global Market Size (Value, Volume* & Price*)

Note*: In applicable scenarios
Step 3 - Data Sources
Primary Research
- Web Analytics
- Survey Reports
- Research Institute
- Latest Research Reports
- Opinion Leaders
Secondary Research
- Annual Reports
- White Paper
- Latest Press Release
- Industry Association
- Paid Database
- Investor Presentations

Step 4 - Data Triangulation
Involves using different sources of information in order to increase the validity of a study
These sources are likely to be stakeholders in a program - participants, other researchers, program staff, other community members, and so on.
Then we put all data in single framework & apply various statistical tools to find out the dynamic on the market.
During the analysis stage, feedback from the stakeholder groups would be compared to determine areas of agreement as well as areas of divergence