

Key Insights
The Parenteral PrEP market, encompassing injectable pre-exposure prophylaxis for HIV prevention, is experiencing significant growth driven by several key factors. The increasing prevalence of HIV, particularly among high-risk populations, fuels the demand for effective prevention methods. Parenteral PrEP offers a compelling alternative to daily oral PrEP, addressing challenges related to adherence and medication burden. This is particularly important for individuals who may struggle with consistent daily medication regimens. The convenience and longer dosing intervals associated with injectable PrEP contribute significantly to its appeal, potentially leading to improved preventative outcomes and reducing the overall transmission rate. Major pharmaceutical players such as Gilead Sciences and ViiV Healthcare are actively involved in research, development, and market penetration strategies, furthering innovation and access to this life-saving intervention. The market's expansion is also influenced by ongoing public health initiatives focused on HIV prevention and increased awareness campaigns highlighting the benefits of PrEP, including among underserved communities.
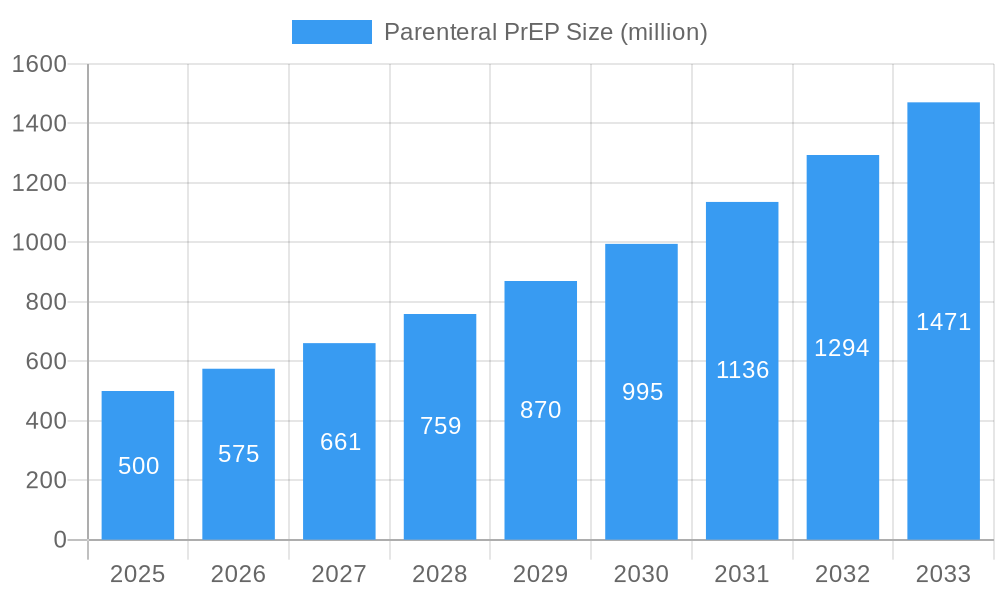
Parenteral PrEP Market Size (In Million)
However, market growth is not without challenges. High initial costs associated with injectable PrEP treatments can hinder widespread adoption, particularly in resource-limited settings. Furthermore, potential long-term side effects, although currently being closely monitored, present a factor that requires further research and transparent communication to ensure patient confidence. Another potential constraint is ensuring equitable access to the medication globally, ensuring that the benefits of this advanced technology are not limited to high-income countries. The long-term success of the Parenteral PrEP market hinges on addressing these challenges through collaborative efforts between pharmaceutical companies, healthcare providers, and public health organizations, focusing on affordability, accessibility, and continued safety monitoring.
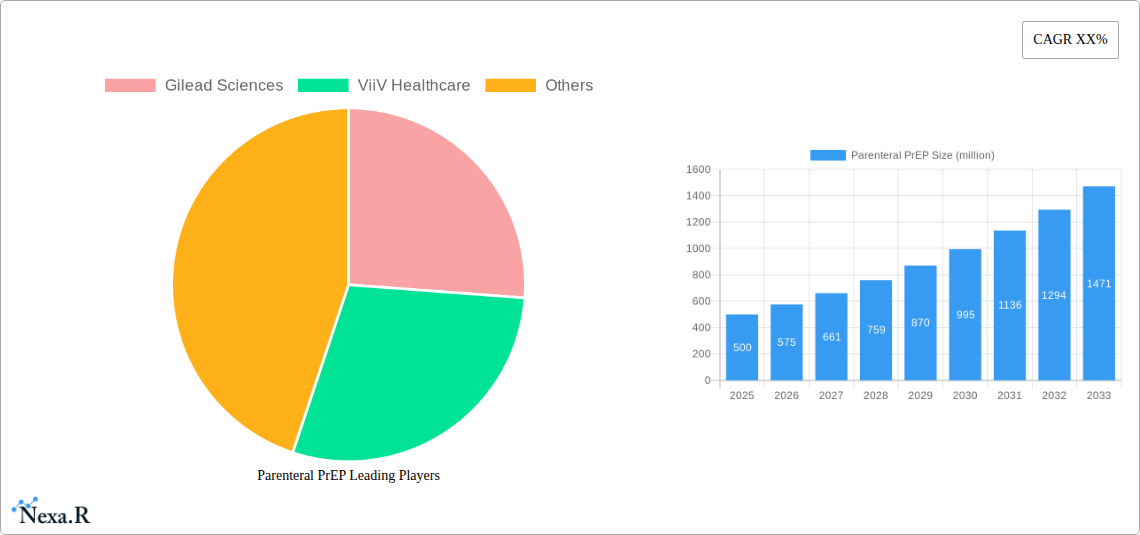
Parenteral PrEP Company Market Share
Parenteral PrEP Market Report: A Comprehensive Analysis (2019-2033)
This comprehensive report provides an in-depth analysis of the Parenteral PrEP market, encompassing market dynamics, growth trends, regional dominance, product landscape, challenges, opportunities, and key players. The report covers the period from 2019 to 2033, with a focus on the forecast period 2025-2033, using 2025 as the base year and estimated year. This research is essential for pharmaceutical companies, healthcare providers, investors, and regulatory bodies seeking to understand and capitalize on the evolving Parenteral PrEP landscape. The total market size in 2025 is estimated at xx million units.
Parenteral PrEP Market Dynamics & Structure
This section analyzes the Parenteral PrEP market's competitive landscape, technological advancements, regulatory environment, and market trends. The global market is experiencing significant growth, driven by increasing awareness of PrEP and technological innovations leading to more convenient administration methods.
- Market Concentration: The market is moderately concentrated, with key players like Gilead Sciences and ViiV Healthcare holding significant market share (xx% and xx% respectively in 2025). Smaller players are also emerging, increasing competition.
- Technological Innovation: The development of long-acting injectables represents a key driver. Innovation focuses on improving efficacy, reducing side effects, and enhancing patient adherence.
- Regulatory Frameworks: Regulatory approvals and reimbursement policies significantly impact market access and adoption. Variations in regulatory pathways across different geographies influence market growth.
- Competitive Product Substitutes: Oral PrEP remains a primary competitor. However, Parenteral PrEP's convenience is expected to drive market share growth.
- End-User Demographics: The primary end-users are individuals at high risk of HIV infection, including men who have sex with men (MSM), transgender women, and people with other risk factors.
- M&A Trends: The number of M&A deals in the PrEP sector has increased in the last five years (xx deals in the historical period, with an expected xx in the forecast period). This reflects the growing interest from larger pharmaceutical companies in acquiring smaller, innovative firms.
Parenteral PrEP Growth Trends & Insights
The Parenteral PrEP market has demonstrated strong growth, with a CAGR of xx% during the historical period (2019-2024). This positive trajectory is projected to continue, with a forecasted CAGR of xx% during 2025-2033, resulting in a market size of xx million units by 2033. Increased awareness campaigns, improved access to healthcare, and the convenience of long-acting injectables contribute to this robust growth. Market penetration is increasing gradually, particularly in high-risk populations, reflecting increasing acceptance and accessibility of Parenteral PrEP. Technological advancements, such as improved formulations and delivery systems, further enhance adoption rates. Consumer behavior is shifting towards convenient and discreet preventative measures, further fueling market expansion.
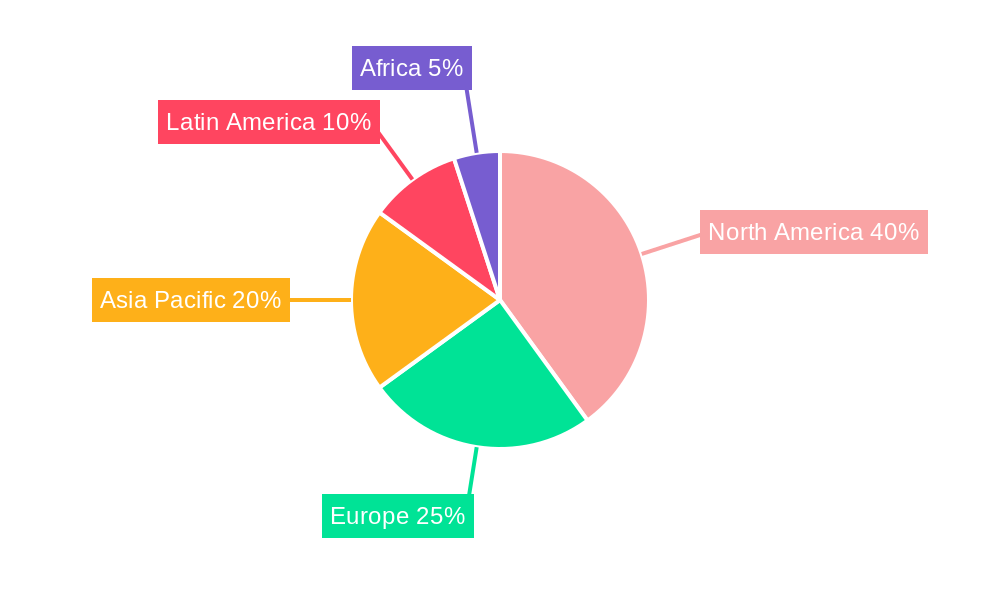
Dominant Regions, Countries, or Segments in Parenteral PrEP
North America currently holds the largest market share (xx% in 2025) owing to high awareness levels, robust healthcare infrastructure, and early adoption of new technologies. However, the fastest-growing market is projected to be in [Region Name] with a CAGR of xx% during the forecast period, driven by factors such as:
- Increased Government Initiatives: Government programs focused on promoting HIV prevention and providing access to PrEP are driving growth in [Country/Region].
- Expanding Healthcare Infrastructure: Improvements in healthcare access and affordability in [Country/Region] are enabling wider adoption.
- Rising Awareness Campaigns: Successful public health campaigns are raising awareness and reducing stigma, leading to greater PrEP uptake.
- Favorable Reimbursement Policies: Positive reimbursement policies make Parenteral PrEP more accessible to at-risk populations.
Parenteral PrEP Product Landscape
The Parenteral PrEP market currently offers long-acting injectable formulations with varying dosage frequencies. Key product innovations focus on improving efficacy, reducing injection-site reactions, and extending the duration of protection. These advancements enhance patient convenience and adherence, making Parenteral PrEP a more attractive option compared to daily oral medication. Unique selling propositions include convenience, extended protection, and improved patient compliance.
Key Drivers, Barriers & Challenges in Parenteral PrEP
Key Drivers:
- Technological advancements resulting in convenient and long-acting formulations.
- Increased public awareness campaigns and reduced stigma surrounding HIV prevention.
- Favorable regulatory approvals and reimbursement policies in many countries.
Key Challenges:
- High initial costs associated with Parenteral PrEP can limit access in certain regions.
- Potential side effects, although generally mild, can deter some individuals.
- Supply chain disruptions and manufacturing challenges can impact market availability.
- Competition from oral PrEP remains a significant factor. The projected market share of oral PrEP in 2033 is xx million units.
Emerging Opportunities in Parenteral PrEP
- Expanding into underserved populations and regions with limited access to HIV prevention services.
- Development of new formulations with improved efficacy and reduced side effects.
- Exploring innovative delivery methods to enhance convenience and patient compliance.
- Leveraging digital technologies to improve patient engagement and support adherence.
Growth Accelerators in the Parenteral PrEP Industry
Technological advancements, particularly in formulation and delivery systems, are key growth catalysts. Strategic partnerships between pharmaceutical companies and healthcare providers can broaden access and improve patient care. Expanding into new markets and adapting marketing strategies to target specific high-risk populations are also crucial growth drivers.
Key Players Shaping the Parenteral PrEP Market
Notable Milestones in Parenteral PrEP Sector
- 2018: FDA approves cabotegravir for PrEP.
- 2021: [Insert significant event with month/year and brief description of impact]
- 2022: [Insert significant event with month/year and brief description of impact]
- 2023: [Insert significant event with month/year and brief description of impact]
- 2024: [Insert significant event with month/year and brief description of impact]
In-Depth Parenteral PrEP Market Outlook
The Parenteral PrEP market is poised for continued strong growth, driven by technological innovation, expanding access, and increasing awareness. Strategic partnerships, targeted marketing campaigns, and further regulatory approvals will shape the market landscape. The long-term potential for Parenteral PrEP is significant, with substantial opportunities for both established and emerging players. The market is predicted to reach xx million units by 2033, representing significant growth potential for stakeholders.
Parenteral PrEP Segmentation
-
1. Application
- 1.1. Subcutaneous Use
- 1.2. Intramuscular Use
-
2. Types
- 2.1. Cabotegravir
- 2.2. Lenacapavir
- 2.3. Other
Parenteral PrEP Segmentation By Geography
-
1. North America
- 1.1. United States
- 1.2. Canada
- 1.3. Mexico
-
2. South America
- 2.1. Brazil
- 2.2. Argentina
- 2.3. Rest of South America
-
3. Europe
- 3.1. United Kingdom
- 3.2. Germany
- 3.3. France
- 3.4. Italy
- 3.5. Spain
- 3.6. Russia
- 3.7. Benelux
- 3.8. Nordics
- 3.9. Rest of Europe
-
4. Middle East & Africa
- 4.1. Turkey
- 4.2. Israel
- 4.3. GCC
- 4.4. North Africa
- 4.5. South Africa
- 4.6. Rest of Middle East & Africa
-
5. Asia Pacific
- 5.1. China
- 5.2. India
- 5.3. Japan
- 5.4. South Korea
- 5.5. ASEAN
- 5.6. Oceania
- 5.7. Rest of Asia Pacific
Parenteral PrEP Regional Market Share
Geographic Coverage of Parenteral PrEP
Parenteral PrEP REPORT HIGHLIGHTS
| Aspects | Details |
|---|---|
| Study Period | 2020-2034 |
| Base Year | 2025 |
| Estimated Year | 2026 |
| Forecast Period | 2026-2034 |
| Historical Period | 2020-2025 |
| Growth Rate | CAGR of 9.1% from 2020-2034 |
| Segmentation |
|
Table of Contents
- 1. Introduction
- 1.1. Research Scope
- 1.2. Market Segmentation
- 1.3. Research Methodology
- 1.4. Definitions and Assumptions
- 2. Executive Summary
- 2.1. Introduction
- 3. Market Dynamics
- 3.1. Introduction
- 3.2. Market Drivers
- 3.3. Market Restrains
- 3.4. Market Trends
- 4. Market Factor Analysis
- 4.1. Porters Five Forces
- 4.2. Supply/Value Chain
- 4.3. PESTEL analysis
- 4.4. Market Entropy
- 4.5. Patent/Trademark Analysis
- 5. Global Parenteral PrEP Analysis, Insights and Forecast, 2020-2032
- 5.1. Market Analysis, Insights and Forecast - by Application
- 5.1.1. Subcutaneous Use
- 5.1.2. Intramuscular Use
- 5.2. Market Analysis, Insights and Forecast - by Types
- 5.2.1. Cabotegravir
- 5.2.2. Lenacapavir
- 5.2.3. Other
- 5.3. Market Analysis, Insights and Forecast - by Region
- 5.3.1. North America
- 5.3.2. South America
- 5.3.3. Europe
- 5.3.4. Middle East & Africa
- 5.3.5. Asia Pacific
- 5.1. Market Analysis, Insights and Forecast - by Application
- 6. North America Parenteral PrEP Analysis, Insights and Forecast, 2020-2032
- 6.1. Market Analysis, Insights and Forecast - by Application
- 6.1.1. Subcutaneous Use
- 6.1.2. Intramuscular Use
- 6.2. Market Analysis, Insights and Forecast - by Types
- 6.2.1. Cabotegravir
- 6.2.2. Lenacapavir
- 6.2.3. Other
- 6.1. Market Analysis, Insights and Forecast - by Application
- 7. South America Parenteral PrEP Analysis, Insights and Forecast, 2020-2032
- 7.1. Market Analysis, Insights and Forecast - by Application
- 7.1.1. Subcutaneous Use
- 7.1.2. Intramuscular Use
- 7.2. Market Analysis, Insights and Forecast - by Types
- 7.2.1. Cabotegravir
- 7.2.2. Lenacapavir
- 7.2.3. Other
- 7.1. Market Analysis, Insights and Forecast - by Application
- 8. Europe Parenteral PrEP Analysis, Insights and Forecast, 2020-2032
- 8.1. Market Analysis, Insights and Forecast - by Application
- 8.1.1. Subcutaneous Use
- 8.1.2. Intramuscular Use
- 8.2. Market Analysis, Insights and Forecast - by Types
- 8.2.1. Cabotegravir
- 8.2.2. Lenacapavir
- 8.2.3. Other
- 8.1. Market Analysis, Insights and Forecast - by Application
- 9. Middle East & Africa Parenteral PrEP Analysis, Insights and Forecast, 2020-2032
- 9.1. Market Analysis, Insights and Forecast - by Application
- 9.1.1. Subcutaneous Use
- 9.1.2. Intramuscular Use
- 9.2. Market Analysis, Insights and Forecast - by Types
- 9.2.1. Cabotegravir
- 9.2.2. Lenacapavir
- 9.2.3. Other
- 9.1. Market Analysis, Insights and Forecast - by Application
- 10. Asia Pacific Parenteral PrEP Analysis, Insights and Forecast, 2020-2032
- 10.1. Market Analysis, Insights and Forecast - by Application
- 10.1.1. Subcutaneous Use
- 10.1.2. Intramuscular Use
- 10.2. Market Analysis, Insights and Forecast - by Types
- 10.2.1. Cabotegravir
- 10.2.2. Lenacapavir
- 10.2.3. Other
- 10.1. Market Analysis, Insights and Forecast - by Application
- 11. Competitive Analysis
- 11.1. Global Market Share Analysis 2025
- 11.2. Company Profiles
- 11.2.1 Gilead Sciences
- 11.2.1.1. Overview
- 11.2.1.2. Products
- 11.2.1.3. SWOT Analysis
- 11.2.1.4. Recent Developments
- 11.2.1.5. Financials (Based on Availability)
- 11.2.2 ViiV Healthcare
- 11.2.2.1. Overview
- 11.2.2.2. Products
- 11.2.2.3. SWOT Analysis
- 11.2.2.4. Recent Developments
- 11.2.2.5. Financials (Based on Availability)
- 11.2.1 Gilead Sciences
List of Figures
- Figure 1: Global Parenteral PrEP Revenue Breakdown (undefined, %) by Region 2025 & 2033
- Figure 2: Global Parenteral PrEP Volume Breakdown (K, %) by Region 2025 & 2033
- Figure 3: North America Parenteral PrEP Revenue (undefined), by Application 2025 & 2033
- Figure 4: North America Parenteral PrEP Volume (K), by Application 2025 & 2033
- Figure 5: North America Parenteral PrEP Revenue Share (%), by Application 2025 & 2033
- Figure 6: North America Parenteral PrEP Volume Share (%), by Application 2025 & 2033
- Figure 7: North America Parenteral PrEP Revenue (undefined), by Types 2025 & 2033
- Figure 8: North America Parenteral PrEP Volume (K), by Types 2025 & 2033
- Figure 9: North America Parenteral PrEP Revenue Share (%), by Types 2025 & 2033
- Figure 10: North America Parenteral PrEP Volume Share (%), by Types 2025 & 2033
- Figure 11: North America Parenteral PrEP Revenue (undefined), by Country 2025 & 2033
- Figure 12: North America Parenteral PrEP Volume (K), by Country 2025 & 2033
- Figure 13: North America Parenteral PrEP Revenue Share (%), by Country 2025 & 2033
- Figure 14: North America Parenteral PrEP Volume Share (%), by Country 2025 & 2033
- Figure 15: South America Parenteral PrEP Revenue (undefined), by Application 2025 & 2033
- Figure 16: South America Parenteral PrEP Volume (K), by Application 2025 & 2033
- Figure 17: South America Parenteral PrEP Revenue Share (%), by Application 2025 & 2033
- Figure 18: South America Parenteral PrEP Volume Share (%), by Application 2025 & 2033
- Figure 19: South America Parenteral PrEP Revenue (undefined), by Types 2025 & 2033
- Figure 20: South America Parenteral PrEP Volume (K), by Types 2025 & 2033
- Figure 21: South America Parenteral PrEP Revenue Share (%), by Types 2025 & 2033
- Figure 22: South America Parenteral PrEP Volume Share (%), by Types 2025 & 2033
- Figure 23: South America Parenteral PrEP Revenue (undefined), by Country 2025 & 2033
- Figure 24: South America Parenteral PrEP Volume (K), by Country 2025 & 2033
- Figure 25: South America Parenteral PrEP Revenue Share (%), by Country 2025 & 2033
- Figure 26: South America Parenteral PrEP Volume Share (%), by Country 2025 & 2033
- Figure 27: Europe Parenteral PrEP Revenue (undefined), by Application 2025 & 2033
- Figure 28: Europe Parenteral PrEP Volume (K), by Application 2025 & 2033
- Figure 29: Europe Parenteral PrEP Revenue Share (%), by Application 2025 & 2033
- Figure 30: Europe Parenteral PrEP Volume Share (%), by Application 2025 & 2033
- Figure 31: Europe Parenteral PrEP Revenue (undefined), by Types 2025 & 2033
- Figure 32: Europe Parenteral PrEP Volume (K), by Types 2025 & 2033
- Figure 33: Europe Parenteral PrEP Revenue Share (%), by Types 2025 & 2033
- Figure 34: Europe Parenteral PrEP Volume Share (%), by Types 2025 & 2033
- Figure 35: Europe Parenteral PrEP Revenue (undefined), by Country 2025 & 2033
- Figure 36: Europe Parenteral PrEP Volume (K), by Country 2025 & 2033
- Figure 37: Europe Parenteral PrEP Revenue Share (%), by Country 2025 & 2033
- Figure 38: Europe Parenteral PrEP Volume Share (%), by Country 2025 & 2033
- Figure 39: Middle East & Africa Parenteral PrEP Revenue (undefined), by Application 2025 & 2033
- Figure 40: Middle East & Africa Parenteral PrEP Volume (K), by Application 2025 & 2033
- Figure 41: Middle East & Africa Parenteral PrEP Revenue Share (%), by Application 2025 & 2033
- Figure 42: Middle East & Africa Parenteral PrEP Volume Share (%), by Application 2025 & 2033
- Figure 43: Middle East & Africa Parenteral PrEP Revenue (undefined), by Types 2025 & 2033
- Figure 44: Middle East & Africa Parenteral PrEP Volume (K), by Types 2025 & 2033
- Figure 45: Middle East & Africa Parenteral PrEP Revenue Share (%), by Types 2025 & 2033
- Figure 46: Middle East & Africa Parenteral PrEP Volume Share (%), by Types 2025 & 2033
- Figure 47: Middle East & Africa Parenteral PrEP Revenue (undefined), by Country 2025 & 2033
- Figure 48: Middle East & Africa Parenteral PrEP Volume (K), by Country 2025 & 2033
- Figure 49: Middle East & Africa Parenteral PrEP Revenue Share (%), by Country 2025 & 2033
- Figure 50: Middle East & Africa Parenteral PrEP Volume Share (%), by Country 2025 & 2033
- Figure 51: Asia Pacific Parenteral PrEP Revenue (undefined), by Application 2025 & 2033
- Figure 52: Asia Pacific Parenteral PrEP Volume (K), by Application 2025 & 2033
- Figure 53: Asia Pacific Parenteral PrEP Revenue Share (%), by Application 2025 & 2033
- Figure 54: Asia Pacific Parenteral PrEP Volume Share (%), by Application 2025 & 2033
- Figure 55: Asia Pacific Parenteral PrEP Revenue (undefined), by Types 2025 & 2033
- Figure 56: Asia Pacific Parenteral PrEP Volume (K), by Types 2025 & 2033
- Figure 57: Asia Pacific Parenteral PrEP Revenue Share (%), by Types 2025 & 2033
- Figure 58: Asia Pacific Parenteral PrEP Volume Share (%), by Types 2025 & 2033
- Figure 59: Asia Pacific Parenteral PrEP Revenue (undefined), by Country 2025 & 2033
- Figure 60: Asia Pacific Parenteral PrEP Volume (K), by Country 2025 & 2033
- Figure 61: Asia Pacific Parenteral PrEP Revenue Share (%), by Country 2025 & 2033
- Figure 62: Asia Pacific Parenteral PrEP Volume Share (%), by Country 2025 & 2033
List of Tables
- Table 1: Global Parenteral PrEP Revenue undefined Forecast, by Application 2020 & 2033
- Table 2: Global Parenteral PrEP Volume K Forecast, by Application 2020 & 2033
- Table 3: Global Parenteral PrEP Revenue undefined Forecast, by Types 2020 & 2033
- Table 4: Global Parenteral PrEP Volume K Forecast, by Types 2020 & 2033
- Table 5: Global Parenteral PrEP Revenue undefined Forecast, by Region 2020 & 2033
- Table 6: Global Parenteral PrEP Volume K Forecast, by Region 2020 & 2033
- Table 7: Global Parenteral PrEP Revenue undefined Forecast, by Application 2020 & 2033
- Table 8: Global Parenteral PrEP Volume K Forecast, by Application 2020 & 2033
- Table 9: Global Parenteral PrEP Revenue undefined Forecast, by Types 2020 & 2033
- Table 10: Global Parenteral PrEP Volume K Forecast, by Types 2020 & 2033
- Table 11: Global Parenteral PrEP Revenue undefined Forecast, by Country 2020 & 2033
- Table 12: Global Parenteral PrEP Volume K Forecast, by Country 2020 & 2033
- Table 13: United States Parenteral PrEP Revenue (undefined) Forecast, by Application 2020 & 2033
- Table 14: United States Parenteral PrEP Volume (K) Forecast, by Application 2020 & 2033
- Table 15: Canada Parenteral PrEP Revenue (undefined) Forecast, by Application 2020 & 2033
- Table 16: Canada Parenteral PrEP Volume (K) Forecast, by Application 2020 & 2033
- Table 17: Mexico Parenteral PrEP Revenue (undefined) Forecast, by Application 2020 & 2033
- Table 18: Mexico Parenteral PrEP Volume (K) Forecast, by Application 2020 & 2033
- Table 19: Global Parenteral PrEP Revenue undefined Forecast, by Application 2020 & 2033
- Table 20: Global Parenteral PrEP Volume K Forecast, by Application 2020 & 2033
- Table 21: Global Parenteral PrEP Revenue undefined Forecast, by Types 2020 & 2033
- Table 22: Global Parenteral PrEP Volume K Forecast, by Types 2020 & 2033
- Table 23: Global Parenteral PrEP Revenue undefined Forecast, by Country 2020 & 2033
- Table 24: Global Parenteral PrEP Volume K Forecast, by Country 2020 & 2033
- Table 25: Brazil Parenteral PrEP Revenue (undefined) Forecast, by Application 2020 & 2033
- Table 26: Brazil Parenteral PrEP Volume (K) Forecast, by Application 2020 & 2033
- Table 27: Argentina Parenteral PrEP Revenue (undefined) Forecast, by Application 2020 & 2033
- Table 28: Argentina Parenteral PrEP Volume (K) Forecast, by Application 2020 & 2033
- Table 29: Rest of South America Parenteral PrEP Revenue (undefined) Forecast, by Application 2020 & 2033
- Table 30: Rest of South America Parenteral PrEP Volume (K) Forecast, by Application 2020 & 2033
- Table 31: Global Parenteral PrEP Revenue undefined Forecast, by Application 2020 & 2033
- Table 32: Global Parenteral PrEP Volume K Forecast, by Application 2020 & 2033
- Table 33: Global Parenteral PrEP Revenue undefined Forecast, by Types 2020 & 2033
- Table 34: Global Parenteral PrEP Volume K Forecast, by Types 2020 & 2033
- Table 35: Global Parenteral PrEP Revenue undefined Forecast, by Country 2020 & 2033
- Table 36: Global Parenteral PrEP Volume K Forecast, by Country 2020 & 2033
- Table 37: United Kingdom Parenteral PrEP Revenue (undefined) Forecast, by Application 2020 & 2033
- Table 38: United Kingdom Parenteral PrEP Volume (K) Forecast, by Application 2020 & 2033
- Table 39: Germany Parenteral PrEP Revenue (undefined) Forecast, by Application 2020 & 2033
- Table 40: Germany Parenteral PrEP Volume (K) Forecast, by Application 2020 & 2033
- Table 41: France Parenteral PrEP Revenue (undefined) Forecast, by Application 2020 & 2033
- Table 42: France Parenteral PrEP Volume (K) Forecast, by Application 2020 & 2033
- Table 43: Italy Parenteral PrEP Revenue (undefined) Forecast, by Application 2020 & 2033
- Table 44: Italy Parenteral PrEP Volume (K) Forecast, by Application 2020 & 2033
- Table 45: Spain Parenteral PrEP Revenue (undefined) Forecast, by Application 2020 & 2033
- Table 46: Spain Parenteral PrEP Volume (K) Forecast, by Application 2020 & 2033
- Table 47: Russia Parenteral PrEP Revenue (undefined) Forecast, by Application 2020 & 2033
- Table 48: Russia Parenteral PrEP Volume (K) Forecast, by Application 2020 & 2033
- Table 49: Benelux Parenteral PrEP Revenue (undefined) Forecast, by Application 2020 & 2033
- Table 50: Benelux Parenteral PrEP Volume (K) Forecast, by Application 2020 & 2033
- Table 51: Nordics Parenteral PrEP Revenue (undefined) Forecast, by Application 2020 & 2033
- Table 52: Nordics Parenteral PrEP Volume (K) Forecast, by Application 2020 & 2033
- Table 53: Rest of Europe Parenteral PrEP Revenue (undefined) Forecast, by Application 2020 & 2033
- Table 54: Rest of Europe Parenteral PrEP Volume (K) Forecast, by Application 2020 & 2033
- Table 55: Global Parenteral PrEP Revenue undefined Forecast, by Application 2020 & 2033
- Table 56: Global Parenteral PrEP Volume K Forecast, by Application 2020 & 2033
- Table 57: Global Parenteral PrEP Revenue undefined Forecast, by Types 2020 & 2033
- Table 58: Global Parenteral PrEP Volume K Forecast, by Types 2020 & 2033
- Table 59: Global Parenteral PrEP Revenue undefined Forecast, by Country 2020 & 2033
- Table 60: Global Parenteral PrEP Volume K Forecast, by Country 2020 & 2033
- Table 61: Turkey Parenteral PrEP Revenue (undefined) Forecast, by Application 2020 & 2033
- Table 62: Turkey Parenteral PrEP Volume (K) Forecast, by Application 2020 & 2033
- Table 63: Israel Parenteral PrEP Revenue (undefined) Forecast, by Application 2020 & 2033
- Table 64: Israel Parenteral PrEP Volume (K) Forecast, by Application 2020 & 2033
- Table 65: GCC Parenteral PrEP Revenue (undefined) Forecast, by Application 2020 & 2033
- Table 66: GCC Parenteral PrEP Volume (K) Forecast, by Application 2020 & 2033
- Table 67: North Africa Parenteral PrEP Revenue (undefined) Forecast, by Application 2020 & 2033
- Table 68: North Africa Parenteral PrEP Volume (K) Forecast, by Application 2020 & 2033
- Table 69: South Africa Parenteral PrEP Revenue (undefined) Forecast, by Application 2020 & 2033
- Table 70: South Africa Parenteral PrEP Volume (K) Forecast, by Application 2020 & 2033
- Table 71: Rest of Middle East & Africa Parenteral PrEP Revenue (undefined) Forecast, by Application 2020 & 2033
- Table 72: Rest of Middle East & Africa Parenteral PrEP Volume (K) Forecast, by Application 2020 & 2033
- Table 73: Global Parenteral PrEP Revenue undefined Forecast, by Application 2020 & 2033
- Table 74: Global Parenteral PrEP Volume K Forecast, by Application 2020 & 2033
- Table 75: Global Parenteral PrEP Revenue undefined Forecast, by Types 2020 & 2033
- Table 76: Global Parenteral PrEP Volume K Forecast, by Types 2020 & 2033
- Table 77: Global Parenteral PrEP Revenue undefined Forecast, by Country 2020 & 2033
- Table 78: Global Parenteral PrEP Volume K Forecast, by Country 2020 & 2033
- Table 79: China Parenteral PrEP Revenue (undefined) Forecast, by Application 2020 & 2033
- Table 80: China Parenteral PrEP Volume (K) Forecast, by Application 2020 & 2033
- Table 81: India Parenteral PrEP Revenue (undefined) Forecast, by Application 2020 & 2033
- Table 82: India Parenteral PrEP Volume (K) Forecast, by Application 2020 & 2033
- Table 83: Japan Parenteral PrEP Revenue (undefined) Forecast, by Application 2020 & 2033
- Table 84: Japan Parenteral PrEP Volume (K) Forecast, by Application 2020 & 2033
- Table 85: South Korea Parenteral PrEP Revenue (undefined) Forecast, by Application 2020 & 2033
- Table 86: South Korea Parenteral PrEP Volume (K) Forecast, by Application 2020 & 2033
- Table 87: ASEAN Parenteral PrEP Revenue (undefined) Forecast, by Application 2020 & 2033
- Table 88: ASEAN Parenteral PrEP Volume (K) Forecast, by Application 2020 & 2033
- Table 89: Oceania Parenteral PrEP Revenue (undefined) Forecast, by Application 2020 & 2033
- Table 90: Oceania Parenteral PrEP Volume (K) Forecast, by Application 2020 & 2033
- Table 91: Rest of Asia Pacific Parenteral PrEP Revenue (undefined) Forecast, by Application 2020 & 2033
- Table 92: Rest of Asia Pacific Parenteral PrEP Volume (K) Forecast, by Application 2020 & 2033
Frequently Asked Questions
1. What is the projected Compound Annual Growth Rate (CAGR) of the Parenteral PrEP?
The projected CAGR is approximately 9.1%.
2. Which companies are prominent players in the Parenteral PrEP?
Key companies in the market include Gilead Sciences, ViiV Healthcare.
3. What are the main segments of the Parenteral PrEP?
The market segments include Application, Types.
4. Can you provide details about the market size?
The market size is estimated to be USD XXX N/A as of 2022.
5. What are some drivers contributing to market growth?
N/A
6. What are the notable trends driving market growth?
N/A
7. Are there any restraints impacting market growth?
N/A
8. Can you provide examples of recent developments in the market?
N/A
9. What pricing options are available for accessing the report?
Pricing options include single-user, multi-user, and enterprise licenses priced at USD 3950.00, USD 5925.00, and USD 7900.00 respectively.
10. Is the market size provided in terms of value or volume?
The market size is provided in terms of value, measured in N/A and volume, measured in K.
11. Are there any specific market keywords associated with the report?
Yes, the market keyword associated with the report is "Parenteral PrEP," which aids in identifying and referencing the specific market segment covered.
12. How do I determine which pricing option suits my needs best?
The pricing options vary based on user requirements and access needs. Individual users may opt for single-user licenses, while businesses requiring broader access may choose multi-user or enterprise licenses for cost-effective access to the report.
13. Are there any additional resources or data provided in the Parenteral PrEP report?
While the report offers comprehensive insights, it's advisable to review the specific contents or supplementary materials provided to ascertain if additional resources or data are available.
14. How can I stay updated on further developments or reports in the Parenteral PrEP?
To stay informed about further developments, trends, and reports in the Parenteral PrEP, consider subscribing to industry newsletters, following relevant companies and organizations, or regularly checking reputable industry news sources and publications.
Methodology
Step 1 - Identification of Relevant Samples Size from Population Database


Step 2 - Approaches for Defining Global Market Size (Value, Volume* & Price*)

Note*: In applicable scenarios
Step 3 - Data Sources
Primary Research
- Web Analytics
- Survey Reports
- Research Institute
- Latest Research Reports
- Opinion Leaders
Secondary Research
- Annual Reports
- White Paper
- Latest Press Release
- Industry Association
- Paid Database
- Investor Presentations

Step 4 - Data Triangulation
Involves using different sources of information in order to increase the validity of a study
These sources are likely to be stakeholders in a program - participants, other researchers, program staff, other community members, and so on.
Then we put all data in single framework & apply various statistical tools to find out the dynamic on the market.
During the analysis stage, feedback from the stakeholder groups would be compared to determine areas of agreement as well as areas of divergence