

Key Insights
The Global Pet Obesity Management Market is projected to reach $9.67 billion by 2025, exhibiting a Compound Annual Growth Rate (CAGR) of 13.83% from the base year 2025. This significant growth is driven by increased pet owner awareness of obesity-related health issues and a greater willingness to invest in specialized treatments and products. The humanization of pets further fuels demand for innovative well-being solutions, complemented by advancements in veterinary science and diagnostic tools.
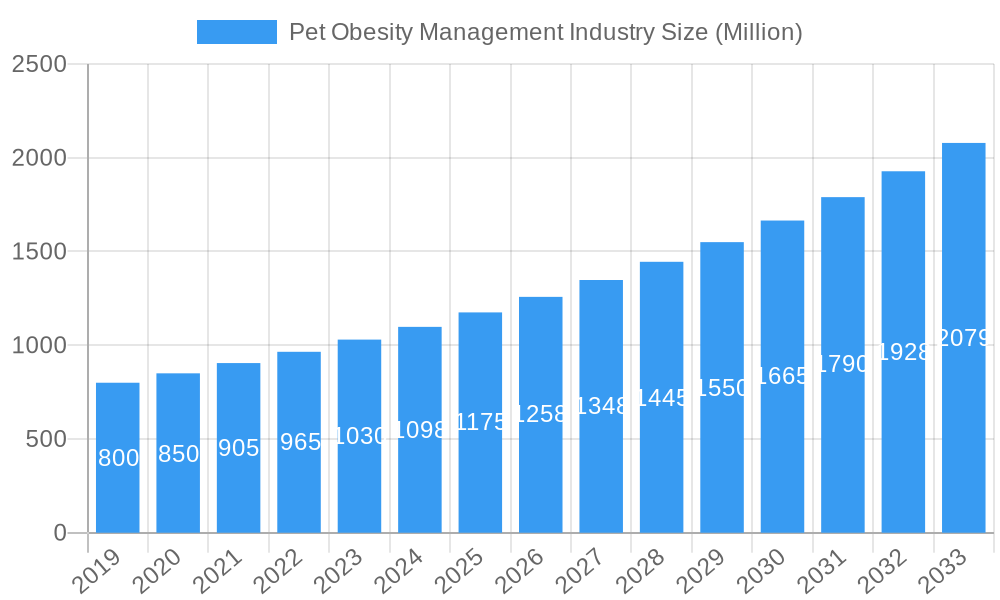
Pet Obesity Management Industry Market Size (In Billion)
The market encompasses pharmaceuticals and dietary supplements, with dogs and cats as the primary animal types. Key distribution channels include pet specialty stores and e-commerce platforms. Emerging economies, particularly in the Asia Pacific, are expected to see substantial growth due to rising pet ownership and disposable income. While challenges like high treatment costs and limited awareness in certain regions exist, strategic collaborations and product innovation are vital for market participants to leverage burgeoning opportunities.
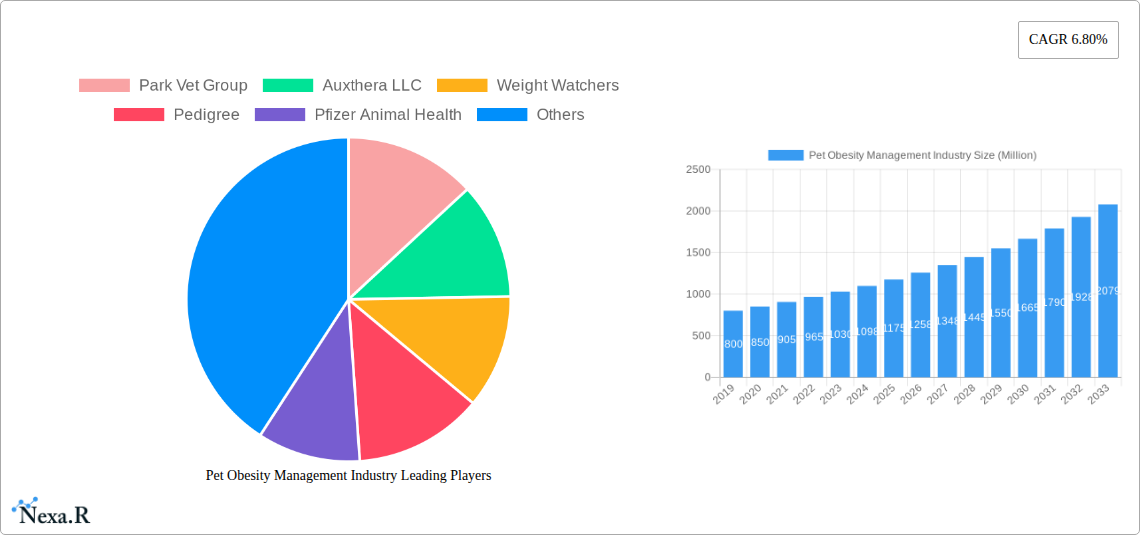
Pet Obesity Management Industry Company Market Share
Comprehensive Report on the Pet Obesity Management Industry
This in-depth report provides an indispensable analysis of the global Pet Obesity Management Industry, encompassing market dynamics, growth trends, key players, and future outlook. Designed for industry professionals, investors, and stakeholders, this study leverages a rich dataset from 2019-2024 (historical) and projects insights from 2025-2033 (forecast period), with 2025 serving as the base and estimated year. The report's findings, presented in millions of units, offer a detailed understanding of this rapidly evolving sector, driven by increasing pet ownership and a growing focus on animal wellness.
Pet Obesity Management Industry Market Dynamics & Structure
The Pet Obesity Management Industry is characterized by a moderately consolidated market structure, with a mix of established multinational corporations and emerging specialized firms. Technological innovation is a significant driver, with advancements in veterinary diagnostics, therapeutic drugs, and advanced nutritional formulations constantly reshaping the product landscape. Regulatory frameworks, overseen by bodies such as the FDA and EMA for animal health products, play a crucial role in ensuring product safety and efficacy, influencing research and development trajectories. Competitive product substitutes are prevalent, ranging from prescription diets to over-the-counter supplements and specialized exercise equipment, forcing companies to continually innovate and differentiate. End-user demographics are shifting, with a growing segment of pet owners actively seeking scientifically backed solutions for their pets' health. Mergers and acquisitions (M&A) are a growing trend, as larger players aim to acquire innovative technologies or expand their market reach, consolidating the industry further. For instance, an estimated 15-20 M&A deals are anticipated annually in the coming years.
- Market Concentration: Moderate to High, with key players holding significant market shares.
- Technological Innovation Drivers: Veterinary diagnostics, advanced drug delivery systems, novel ingredient research, and personalized nutrition solutions.
- Regulatory Frameworks: Stringent approval processes for pharmaceuticals and novel feed ingredients.
- Competitive Product Substitutes: Prescription diets, nutraceuticals, weight management supplements, behavioral modification tools, and specialized pet exercise programs.
- End-User Demographics: Increasing demand for evidence-based solutions, a willingness to invest in pet health, and a rise in humanization of pets.
- M&A Trends: Consolidation through strategic acquisitions to gain market share and technological expertise.
Pet Obesity Management Industry Growth Trends & Insights
The Pet Obesity Management Industry is poised for substantial growth, projected to witness a Compound Annual Growth Rate (CAGR) of approximately 7.5% from 2025 to 2033. This expansion is fueled by a confluence of factors, including the escalating prevalence of pet obesity globally, which is estimated to affect over 50% of domestic animals, and a heightened awareness among pet owners regarding the detrimental health consequences associated with excess weight. The humanization of pets continues to be a dominant trend, leading owners to treat their companions as integral family members and consequently invest more in their healthcare and well-being. Technological advancements in veterinary medicine, such as improved diagnostic tools for assessing body composition and metabolism, are enabling earlier and more accurate identification of at-risk pets. Furthermore, the development of specialized veterinary diets and pharmaceutical interventions targeting specific metabolic pathways has opened new avenues for effective weight management.
The adoption rates for scientifically formulated pet foods and weight management supplements are steadily increasing as pet owners become more informed and seek veterinarian-recommended solutions. The e-commerce segment for pet health products is experiencing significant growth, offering convenient access to a wider range of specialized products and information. Consumer behavior is also evolving, with a greater emphasis on preventive care and proactive health management for pets. This shift is driving demand for long-term weight management strategies rather than just reactive treatments. The market penetration of specialized pet obesity management services, including nutritional counseling and exercise programs, is also on the rise, reflecting a holistic approach to pet health. The overall market size is expected to grow from an estimated $5,800 million in 2025 to over $9,900 million by 2033, demonstrating a robust upward trajectory driven by these interconnected trends.
Dominant Regions, Countries, or Segments in Pet Obesity Management Industry
North America currently holds a dominant position in the global Pet Obesity Management Industry, primarily driven by high pet ownership rates, significant disposable income, and a strong emphasis on pet health and wellness. The United States, in particular, represents a substantial market share within this region, characterized by widespread adoption of advanced pet care products and services, and a proactive approach to veterinary care.
Dominance Factors in North America:
- High Pet Ownership & Humanization: A significant percentage of households own pets, and these animals are increasingly viewed as family members, leading to greater expenditure on their health.
- Economic Prosperity: High disposable incomes allow pet owners to invest in premium pet foods, specialized supplements, and veterinary consultations for weight management.
- Advanced Veterinary Infrastructure: A well-established network of veterinary clinics and hospitals equipped with advanced diagnostic tools and expertise in pet nutrition.
- Awareness and Education: Extensive public awareness campaigns and readily available educational resources on pet health and obesity management contribute to proactive pet care.
Within the product segments, Food Supplements are witnessing remarkable growth, driven by the increasing demand for natural and scientifically formulated ingredients that aid in weight loss and metabolic support. This segment is expected to capture a market share of approximately 35% by 2025, with a projected CAGR of 8.2%.
In terms of animal type, Dogs represent the largest segment, accounting for an estimated 60% of the market. This is attributed to their high prevalence as pets and the direct correlation between their lifestyle, diet, and susceptibility to obesity.
The E-commerce end-user segment is the fastest-growing channel, projected to see a CAGR of 9.5% throughout the forecast period. This growth is fueled by convenience, wider product selection, and competitive pricing offered by online platforms.
Pet Obesity Management Industry Product Landscape
The product landscape for pet obesity management is characterized by a surge in innovative solutions designed to address the complex needs of overweight pets. This includes scientifically formulated veterinary diets with reduced calorie content, increased fiber, and enhanced protein to promote satiety and muscle maintenance. Furthermore, the market is seeing a rise in specialized food supplements, such as L-carnitine for fat metabolism support and omega-3 fatty acids for anti-inflammatory benefits. Advanced pharmaceutical interventions targeting hormonal imbalances or appetite regulation are also gaining traction. The unique selling propositions lie in scientifically validated efficacy, palatability for discerning pets, and the availability of tailored formulations for specific breeds and health conditions. Technological advancements are focused on precision nutrition and the development of smart feeding devices.
Key Drivers, Barriers & Challenges in Pet Obesity Management Industry
Key Drivers:
- Rising Pet Humanization: Pets are increasingly treated as family members, leading to a willingness to invest in their health and longevity.
- Increasing Prevalence of Pet Obesity: Growing awareness of the health risks associated with overweight pets, such as diabetes, arthritis, and cardiovascular issues.
- Advancements in Veterinary Science: Development of sophisticated diagnostic tools and effective therapeutic solutions, including specialized diets and medications.
- Growing E-commerce Penetration: Increased accessibility to a wide range of pet obesity management products and information through online platforms.
Barriers & Challenges:
- Owner Compliance: Difficulty in ensuring consistent adherence to dietary plans and exercise regimens by pet owners.
- Cost of Specialized Products: Premium priced diets and treatments can be a financial barrier for some pet owners.
- Regulatory Hurdles: Stringent approval processes for new veterinary drugs and supplements can delay market entry.
- Limited Awareness of Early Intervention: Many owners delay seeking professional help until obesity-related health issues become severe, impacting treatment efficacy.
- Supply Chain Disruptions: Potential for disruptions in the sourcing of raw materials for specialized pet food and supplements.
Emerging Opportunities in Pet Obesity Management Industry
Emerging opportunities lie in the development of personalized nutrition plans leveraging AI and genetic profiling to tailor dietary recommendations for individual pets. The expansion of telehealth services for veterinary consultations focused on weight management presents a significant untapped market. Furthermore, the creation of innovative, palatable, and effective treat alternatives that support weight loss goals, as well as the integration of wearable technology for monitoring pet activity and caloric intake, are poised to drive future growth. The increasing demand for sustainable and natural pet food ingredients also offers a fertile ground for innovation.
Growth Accelerators in the Pet Obesity Management Industry Industry
Long-term growth in the Pet Obesity Management Industry will be significantly accelerated by strategic partnerships between pharmaceutical companies and pet food manufacturers to develop integrated treatment solutions. Continuous investment in research and development for novel therapeutic compounds and advanced nutritional technologies is crucial. Market expansion into emerging economies with rapidly growing pet populations and increasing disposable incomes will also be a key growth driver. The development of comprehensive pet wellness programs that combine nutrition, exercise, and behavioral support, often offered through veterinary clinics or specialized pet service providers, will further stimulate market expansion.
Key Players Shaping the Pet Obesity Management Industry Market
- Park Vet Group
- Auxthera LLC
- Weight Watchers
- Pedigree
- Pfizer Animal Health
- Vivaldis
- KONG Company
- Hills Pet Nutrition Inc
- Royal Canin
Notable Milestones in Pet Obesity Management Industry Sector
- May 2022: Park Vet Group launched the Veterinary Nursing Awareness campaign, emphasizing the critical role of veterinary nurses in educating pet owners about nutrition and balanced diets.
- January 2022: Alton Brown joined Hill's Pet Nutrition to champion their mission to end pet obesity, leveraging his platform to promote the company's research findings and offer free educational resources to pet owners.
In-Depth Pet Obesity Management Industry Market Outlook
The future outlook for the Pet Obesity Management Industry is exceptionally promising, driven by a sustained increase in pet ownership and a deepening understanding of the importance of proactive pet health. Growth accelerators such as technological breakthroughs in precision nutrition and the expansion of digital health platforms for pets will create new avenues for revenue and market penetration. Strategic partnerships between veterinary professionals, pet food innovators, and technology providers will foster a more integrated approach to tackling pet obesity. As consumer preferences continue to evolve towards preventive care and evidence-based solutions, the market is set to witness sustained demand for high-quality, effective, and science-backed pet obesity management products and services. The industry is on a trajectory to significantly improve the health and longevity of pets worldwide.
Pet Obesity Management Industry Segmentation
-
1. Products
- 1.1. Drugs
- 1.2. Food Supplements
-
2. Animal Type
- 2.1. Dogs
- 2.2. Cats
- 2.3. Other Animals
-
3. End User
- 3.1. Pet Specialty Stores
- 3.2. E-commerce
- 3.3. Other End Users
Pet Obesity Management Industry Segmentation By Geography
-
1. North America
- 1.1. United States
- 1.2. Canada
- 1.3. Mexico
-
2. Europe
- 2.1. Germany
- 2.2. United Kingdom
- 2.3. France
- 2.4. Italy
- 2.5. Spain
- 2.6. Rest of Europe
-
3. Asia Pacific
- 3.1. China
- 3.2. Japan
- 3.3. India
- 3.4. Australia
- 3.5. South Korea
- 3.6. Rest of Asia Pacific
-
4. Middle East and Africa
- 4.1. GCC
- 4.2. South Africa
- 4.3. Rest of Middle East and Africa
-
5. South America
- 5.1. Brazil
- 5.2. Argentina
- 5.3. Rest of South America
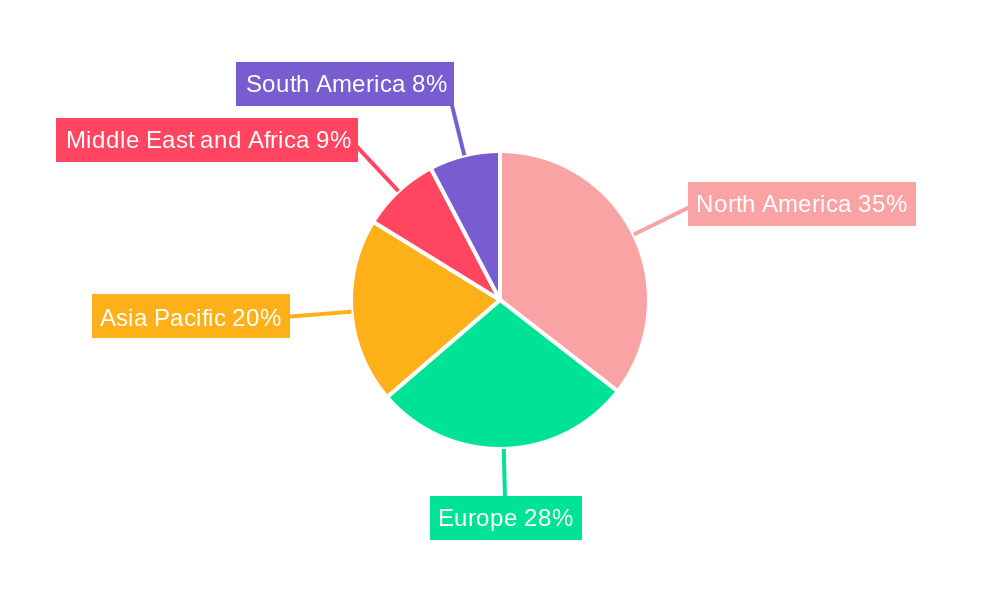
Pet Obesity Management Industry Regional Market Share
Geographic Coverage of Pet Obesity Management Industry
Pet Obesity Management Industry REPORT HIGHLIGHTS
| Aspects | Details |
|---|---|
| Study Period | 2020-2034 |
| Base Year | 2025 |
| Estimated Year | 2026 |
| Forecast Period | 2026-2034 |
| Historical Period | 2020-2025 |
| Growth Rate | CAGR of 13.83% from 2020-2034 |
| Segmentation |
|
Table of Contents
- 1. Introduction
- 1.1. Research Scope
- 1.2. Market Segmentation
- 1.3. Research Objective
- 1.4. Definitions and Assumptions
- 2. Executive Summary
- 2.1. Market Snapshot
- 3. Market Dynamics
- 3.1. Market Drivers
- 3.2. Market Restrains
- 3.3. Market Trends
- 3.4. Market Opportunities
- 4. Market Factor Analysis
- 4.1. Porters Five Forces
- 4.1.1. Bargaining Power of Suppliers
- 4.1.2. Bargaining Power of Buyers
- 4.1.3. Threat of New Entrants
- 4.1.4. Threat of Substitutes
- 4.1.5. Competitive Rivalry
- 4.2. PESTEL analysis
- 4.3. BCG Analysis
- 4.3.1. Stars (High Growth, High Market Share)
- 4.3.2. Cash Cows (Low Growth, High Market Share)
- 4.3.3. Question Mark (High Growth, Low Market Share)
- 4.3.4. Dogs (Low Growth, Low Market Share)
- 4.4. Ansoff Matrix Analysis
- 4.5. Supply Chain Analysis
- 4.6. Regulatory Landscape
- 4.7. Current Market Potential and Opportunity Assessment (TAM–SAM–SOM Framework)
- 4.8. NRP Analyst Note
- 4.1. Porters Five Forces
- 5. Market Analysis, Insights and Forecast 2021-2033
- 5.1. Market Analysis, Insights and Forecast - by Products
- 5.1.1. Drugs
- 5.1.2. Food Supplements
- 5.2. Market Analysis, Insights and Forecast - by Animal Type
- 5.2.1. Dogs
- 5.2.2. Cats
- 5.2.3. Other Animals
- 5.3. Market Analysis, Insights and Forecast - by End User
- 5.3.1. Pet Specialty Stores
- 5.3.2. E-commerce
- 5.3.3. Other End Users
- 5.4. Market Analysis, Insights and Forecast - by Region
- 5.4.1. North America
- 5.4.2. Europe
- 5.4.3. Asia Pacific
- 5.4.4. Middle East and Africa
- 5.4.5. South America
- 5.1. Market Analysis, Insights and Forecast - by Products
- 6. Global Pet Obesity Management Industry Analysis, Insights and Forecast, 2021-2033
- 6.1. Market Analysis, Insights and Forecast - by Products
- 6.1.1. Drugs
- 6.1.2. Food Supplements
- 6.2. Market Analysis, Insights and Forecast - by Animal Type
- 6.2.1. Dogs
- 6.2.2. Cats
- 6.2.3. Other Animals
- 6.3. Market Analysis, Insights and Forecast - by End User
- 6.3.1. Pet Specialty Stores
- 6.3.2. E-commerce
- 6.3.3. Other End Users
- 6.1. Market Analysis, Insights and Forecast - by Products
- 7. North America Pet Obesity Management Industry Analysis, Insights and Forecast, 2020-2032
- 7.1. Market Analysis, Insights and Forecast - by Products
- 7.1.1. Drugs
- 7.1.2. Food Supplements
- 7.2. Market Analysis, Insights and Forecast - by Animal Type
- 7.2.1. Dogs
- 7.2.2. Cats
- 7.2.3. Other Animals
- 7.3. Market Analysis, Insights and Forecast - by End User
- 7.3.1. Pet Specialty Stores
- 7.3.2. E-commerce
- 7.3.3. Other End Users
- 7.1. Market Analysis, Insights and Forecast - by Products
- 8. Europe Pet Obesity Management Industry Analysis, Insights and Forecast, 2020-2032
- 8.1. Market Analysis, Insights and Forecast - by Products
- 8.1.1. Drugs
- 8.1.2. Food Supplements
- 8.2. Market Analysis, Insights and Forecast - by Animal Type
- 8.2.1. Dogs
- 8.2.2. Cats
- 8.2.3. Other Animals
- 8.3. Market Analysis, Insights and Forecast - by End User
- 8.3.1. Pet Specialty Stores
- 8.3.2. E-commerce
- 8.3.3. Other End Users
- 8.1. Market Analysis, Insights and Forecast - by Products
- 9. Asia Pacific Pet Obesity Management Industry Analysis, Insights and Forecast, 2020-2032
- 9.1. Market Analysis, Insights and Forecast - by Products
- 9.1.1. Drugs
- 9.1.2. Food Supplements
- 9.2. Market Analysis, Insights and Forecast - by Animal Type
- 9.2.1. Dogs
- 9.2.2. Cats
- 9.2.3. Other Animals
- 9.3. Market Analysis, Insights and Forecast - by End User
- 9.3.1. Pet Specialty Stores
- 9.3.2. E-commerce
- 9.3.3. Other End Users
- 9.1. Market Analysis, Insights and Forecast - by Products
- 10. Middle East and Africa Pet Obesity Management Industry Analysis, Insights and Forecast, 2020-2032
- 10.1. Market Analysis, Insights and Forecast - by Products
- 10.1.1. Drugs
- 10.1.2. Food Supplements
- 10.2. Market Analysis, Insights and Forecast - by Animal Type
- 10.2.1. Dogs
- 10.2.2. Cats
- 10.2.3. Other Animals
- 10.3. Market Analysis, Insights and Forecast - by End User
- 10.3.1. Pet Specialty Stores
- 10.3.2. E-commerce
- 10.3.3. Other End Users
- 10.1. Market Analysis, Insights and Forecast - by Products
- 11. South America Pet Obesity Management Industry Analysis, Insights and Forecast, 2020-2032
- 11.1. Market Analysis, Insights and Forecast - by Products
- 11.1.1. Drugs
- 11.1.2. Food Supplements
- 11.2. Market Analysis, Insights and Forecast - by Animal Type
- 11.2.1. Dogs
- 11.2.2. Cats
- 11.2.3. Other Animals
- 11.3. Market Analysis, Insights and Forecast - by End User
- 11.3.1. Pet Specialty Stores
- 11.3.2. E-commerce
- 11.3.3. Other End Users
- 11.1. Market Analysis, Insights and Forecast - by Products
- 12. Competitive Analysis
- 12.1. Company Profiles
- 12.1.1 Park Vet Group
- 12.1.1.1. Company Overview
- 12.1.1.2. Products
- 12.1.1.3. Company Financials
- 12.1.1.4. SWOT Analysis
- 12.1.2 Auxthera LLC
- 12.1.2.1. Company Overview
- 12.1.2.2. Products
- 12.1.2.3. Company Financials
- 12.1.2.4. SWOT Analysis
- 12.1.3 Weight Watchers
- 12.1.3.1. Company Overview
- 12.1.3.2. Products
- 12.1.3.3. Company Financials
- 12.1.3.4. SWOT Analysis
- 12.1.4 Pedigree
- 12.1.4.1. Company Overview
- 12.1.4.2. Products
- 12.1.4.3. Company Financials
- 12.1.4.4. SWOT Analysis
- 12.1.5 Pfizer Animal Health
- 12.1.5.1. Company Overview
- 12.1.5.2. Products
- 12.1.5.3. Company Financials
- 12.1.5.4. SWOT Analysis
- 12.1.6 Vivaldis
- 12.1.6.1. Company Overview
- 12.1.6.2. Products
- 12.1.6.3. Company Financials
- 12.1.6.4. SWOT Analysis
- 12.1.7 KONG Company
- 12.1.7.1. Company Overview
- 12.1.7.2. Products
- 12.1.7.3. Company Financials
- 12.1.7.4. SWOT Analysis
- 12.1.8 Hills Pet Nutrition Inc
- 12.1.8.1. Company Overview
- 12.1.8.2. Products
- 12.1.8.3. Company Financials
- 12.1.8.4. SWOT Analysis
- 12.1.9 Royal Canin
- 12.1.9.1. Company Overview
- 12.1.9.2. Products
- 12.1.9.3. Company Financials
- 12.1.9.4. SWOT Analysis
- 12.1.1 Park Vet Group
- 12.2. Market Entropy
- 12.2.1 Company's Key Areas Served
- 12.2.2 Recent Developments
- 12.3. Company Market Share Analysis 2025
- 12.3.1 Top 5 Companies Market Share Analysis
- 12.3.2 Top 3 Companies Market Share Analysis
- 12.4. List of Potential Customers
- 13. Research Methodology
List of Figures
- Figure 1: Global Pet Obesity Management Industry Revenue Breakdown (billion, %) by Region 2025 & 2033
- Figure 2: Global Pet Obesity Management Industry Volume Breakdown (K Unit, %) by Region 2025 & 2033
- Figure 3: North America Pet Obesity Management Industry Revenue (billion), by Products 2025 & 2033
- Figure 4: North America Pet Obesity Management Industry Volume (K Unit), by Products 2025 & 2033
- Figure 5: North America Pet Obesity Management Industry Revenue Share (%), by Products 2025 & 2033
- Figure 6: North America Pet Obesity Management Industry Volume Share (%), by Products 2025 & 2033
- Figure 7: North America Pet Obesity Management Industry Revenue (billion), by Animal Type 2025 & 2033
- Figure 8: North America Pet Obesity Management Industry Volume (K Unit), by Animal Type 2025 & 2033
- Figure 9: North America Pet Obesity Management Industry Revenue Share (%), by Animal Type 2025 & 2033
- Figure 10: North America Pet Obesity Management Industry Volume Share (%), by Animal Type 2025 & 2033
- Figure 11: North America Pet Obesity Management Industry Revenue (billion), by End User 2025 & 2033
- Figure 12: North America Pet Obesity Management Industry Volume (K Unit), by End User 2025 & 2033
- Figure 13: North America Pet Obesity Management Industry Revenue Share (%), by End User 2025 & 2033
- Figure 14: North America Pet Obesity Management Industry Volume Share (%), by End User 2025 & 2033
- Figure 15: North America Pet Obesity Management Industry Revenue (billion), by Country 2025 & 2033
- Figure 16: North America Pet Obesity Management Industry Volume (K Unit), by Country 2025 & 2033
- Figure 17: North America Pet Obesity Management Industry Revenue Share (%), by Country 2025 & 2033
- Figure 18: North America Pet Obesity Management Industry Volume Share (%), by Country 2025 & 2033
- Figure 19: Europe Pet Obesity Management Industry Revenue (billion), by Products 2025 & 2033
- Figure 20: Europe Pet Obesity Management Industry Volume (K Unit), by Products 2025 & 2033
- Figure 21: Europe Pet Obesity Management Industry Revenue Share (%), by Products 2025 & 2033
- Figure 22: Europe Pet Obesity Management Industry Volume Share (%), by Products 2025 & 2033
- Figure 23: Europe Pet Obesity Management Industry Revenue (billion), by Animal Type 2025 & 2033
- Figure 24: Europe Pet Obesity Management Industry Volume (K Unit), by Animal Type 2025 & 2033
- Figure 25: Europe Pet Obesity Management Industry Revenue Share (%), by Animal Type 2025 & 2033
- Figure 26: Europe Pet Obesity Management Industry Volume Share (%), by Animal Type 2025 & 2033
- Figure 27: Europe Pet Obesity Management Industry Revenue (billion), by End User 2025 & 2033
- Figure 28: Europe Pet Obesity Management Industry Volume (K Unit), by End User 2025 & 2033
- Figure 29: Europe Pet Obesity Management Industry Revenue Share (%), by End User 2025 & 2033
- Figure 30: Europe Pet Obesity Management Industry Volume Share (%), by End User 2025 & 2033
- Figure 31: Europe Pet Obesity Management Industry Revenue (billion), by Country 2025 & 2033
- Figure 32: Europe Pet Obesity Management Industry Volume (K Unit), by Country 2025 & 2033
- Figure 33: Europe Pet Obesity Management Industry Revenue Share (%), by Country 2025 & 2033
- Figure 34: Europe Pet Obesity Management Industry Volume Share (%), by Country 2025 & 2033
- Figure 35: Asia Pacific Pet Obesity Management Industry Revenue (billion), by Products 2025 & 2033
- Figure 36: Asia Pacific Pet Obesity Management Industry Volume (K Unit), by Products 2025 & 2033
- Figure 37: Asia Pacific Pet Obesity Management Industry Revenue Share (%), by Products 2025 & 2033
- Figure 38: Asia Pacific Pet Obesity Management Industry Volume Share (%), by Products 2025 & 2033
- Figure 39: Asia Pacific Pet Obesity Management Industry Revenue (billion), by Animal Type 2025 & 2033
- Figure 40: Asia Pacific Pet Obesity Management Industry Volume (K Unit), by Animal Type 2025 & 2033
- Figure 41: Asia Pacific Pet Obesity Management Industry Revenue Share (%), by Animal Type 2025 & 2033
- Figure 42: Asia Pacific Pet Obesity Management Industry Volume Share (%), by Animal Type 2025 & 2033
- Figure 43: Asia Pacific Pet Obesity Management Industry Revenue (billion), by End User 2025 & 2033
- Figure 44: Asia Pacific Pet Obesity Management Industry Volume (K Unit), by End User 2025 & 2033
- Figure 45: Asia Pacific Pet Obesity Management Industry Revenue Share (%), by End User 2025 & 2033
- Figure 46: Asia Pacific Pet Obesity Management Industry Volume Share (%), by End User 2025 & 2033
- Figure 47: Asia Pacific Pet Obesity Management Industry Revenue (billion), by Country 2025 & 2033
- Figure 48: Asia Pacific Pet Obesity Management Industry Volume (K Unit), by Country 2025 & 2033
- Figure 49: Asia Pacific Pet Obesity Management Industry Revenue Share (%), by Country 2025 & 2033
- Figure 50: Asia Pacific Pet Obesity Management Industry Volume Share (%), by Country 2025 & 2033
- Figure 51: Middle East and Africa Pet Obesity Management Industry Revenue (billion), by Products 2025 & 2033
- Figure 52: Middle East and Africa Pet Obesity Management Industry Volume (K Unit), by Products 2025 & 2033
- Figure 53: Middle East and Africa Pet Obesity Management Industry Revenue Share (%), by Products 2025 & 2033
- Figure 54: Middle East and Africa Pet Obesity Management Industry Volume Share (%), by Products 2025 & 2033
- Figure 55: Middle East and Africa Pet Obesity Management Industry Revenue (billion), by Animal Type 2025 & 2033
- Figure 56: Middle East and Africa Pet Obesity Management Industry Volume (K Unit), by Animal Type 2025 & 2033
- Figure 57: Middle East and Africa Pet Obesity Management Industry Revenue Share (%), by Animal Type 2025 & 2033
- Figure 58: Middle East and Africa Pet Obesity Management Industry Volume Share (%), by Animal Type 2025 & 2033
- Figure 59: Middle East and Africa Pet Obesity Management Industry Revenue (billion), by End User 2025 & 2033
- Figure 60: Middle East and Africa Pet Obesity Management Industry Volume (K Unit), by End User 2025 & 2033
- Figure 61: Middle East and Africa Pet Obesity Management Industry Revenue Share (%), by End User 2025 & 2033
- Figure 62: Middle East and Africa Pet Obesity Management Industry Volume Share (%), by End User 2025 & 2033
- Figure 63: Middle East and Africa Pet Obesity Management Industry Revenue (billion), by Country 2025 & 2033
- Figure 64: Middle East and Africa Pet Obesity Management Industry Volume (K Unit), by Country 2025 & 2033
- Figure 65: Middle East and Africa Pet Obesity Management Industry Revenue Share (%), by Country 2025 & 2033
- Figure 66: Middle East and Africa Pet Obesity Management Industry Volume Share (%), by Country 2025 & 2033
- Figure 67: South America Pet Obesity Management Industry Revenue (billion), by Products 2025 & 2033
- Figure 68: South America Pet Obesity Management Industry Volume (K Unit), by Products 2025 & 2033
- Figure 69: South America Pet Obesity Management Industry Revenue Share (%), by Products 2025 & 2033
- Figure 70: South America Pet Obesity Management Industry Volume Share (%), by Products 2025 & 2033
- Figure 71: South America Pet Obesity Management Industry Revenue (billion), by Animal Type 2025 & 2033
- Figure 72: South America Pet Obesity Management Industry Volume (K Unit), by Animal Type 2025 & 2033
- Figure 73: South America Pet Obesity Management Industry Revenue Share (%), by Animal Type 2025 & 2033
- Figure 74: South America Pet Obesity Management Industry Volume Share (%), by Animal Type 2025 & 2033
- Figure 75: South America Pet Obesity Management Industry Revenue (billion), by End User 2025 & 2033
- Figure 76: South America Pet Obesity Management Industry Volume (K Unit), by End User 2025 & 2033
- Figure 77: South America Pet Obesity Management Industry Revenue Share (%), by End User 2025 & 2033
- Figure 78: South America Pet Obesity Management Industry Volume Share (%), by End User 2025 & 2033
- Figure 79: South America Pet Obesity Management Industry Revenue (billion), by Country 2025 & 2033
- Figure 80: South America Pet Obesity Management Industry Volume (K Unit), by Country 2025 & 2033
- Figure 81: South America Pet Obesity Management Industry Revenue Share (%), by Country 2025 & 2033
- Figure 82: South America Pet Obesity Management Industry Volume Share (%), by Country 2025 & 2033
List of Tables
- Table 1: Global Pet Obesity Management Industry Revenue billion Forecast, by Products 2020 & 2033
- Table 2: Global Pet Obesity Management Industry Volume K Unit Forecast, by Products 2020 & 2033
- Table 3: Global Pet Obesity Management Industry Revenue billion Forecast, by Animal Type 2020 & 2033
- Table 4: Global Pet Obesity Management Industry Volume K Unit Forecast, by Animal Type 2020 & 2033
- Table 5: Global Pet Obesity Management Industry Revenue billion Forecast, by End User 2020 & 2033
- Table 6: Global Pet Obesity Management Industry Volume K Unit Forecast, by End User 2020 & 2033
- Table 7: Global Pet Obesity Management Industry Revenue billion Forecast, by Region 2020 & 2033
- Table 8: Global Pet Obesity Management Industry Volume K Unit Forecast, by Region 2020 & 2033
- Table 9: Global Pet Obesity Management Industry Revenue billion Forecast, by Products 2020 & 2033
- Table 10: Global Pet Obesity Management Industry Volume K Unit Forecast, by Products 2020 & 2033
- Table 11: Global Pet Obesity Management Industry Revenue billion Forecast, by Animal Type 2020 & 2033
- Table 12: Global Pet Obesity Management Industry Volume K Unit Forecast, by Animal Type 2020 & 2033
- Table 13: Global Pet Obesity Management Industry Revenue billion Forecast, by End User 2020 & 2033
- Table 14: Global Pet Obesity Management Industry Volume K Unit Forecast, by End User 2020 & 2033
- Table 15: Global Pet Obesity Management Industry Revenue billion Forecast, by Country 2020 & 2033
- Table 16: Global Pet Obesity Management Industry Volume K Unit Forecast, by Country 2020 & 2033
- Table 17: United States Pet Obesity Management Industry Revenue (billion) Forecast, by Application 2020 & 2033
- Table 18: United States Pet Obesity Management Industry Volume (K Unit) Forecast, by Application 2020 & 2033
- Table 19: Canada Pet Obesity Management Industry Revenue (billion) Forecast, by Application 2020 & 2033
- Table 20: Canada Pet Obesity Management Industry Volume (K Unit) Forecast, by Application 2020 & 2033
- Table 21: Mexico Pet Obesity Management Industry Revenue (billion) Forecast, by Application 2020 & 2033
- Table 22: Mexico Pet Obesity Management Industry Volume (K Unit) Forecast, by Application 2020 & 2033
- Table 23: Global Pet Obesity Management Industry Revenue billion Forecast, by Products 2020 & 2033
- Table 24: Global Pet Obesity Management Industry Volume K Unit Forecast, by Products 2020 & 2033
- Table 25: Global Pet Obesity Management Industry Revenue billion Forecast, by Animal Type 2020 & 2033
- Table 26: Global Pet Obesity Management Industry Volume K Unit Forecast, by Animal Type 2020 & 2033
- Table 27: Global Pet Obesity Management Industry Revenue billion Forecast, by End User 2020 & 2033
- Table 28: Global Pet Obesity Management Industry Volume K Unit Forecast, by End User 2020 & 2033
- Table 29: Global Pet Obesity Management Industry Revenue billion Forecast, by Country 2020 & 2033
- Table 30: Global Pet Obesity Management Industry Volume K Unit Forecast, by Country 2020 & 2033
- Table 31: Germany Pet Obesity Management Industry Revenue (billion) Forecast, by Application 2020 & 2033
- Table 32: Germany Pet Obesity Management Industry Volume (K Unit) Forecast, by Application 2020 & 2033
- Table 33: United Kingdom Pet Obesity Management Industry Revenue (billion) Forecast, by Application 2020 & 2033
- Table 34: United Kingdom Pet Obesity Management Industry Volume (K Unit) Forecast, by Application 2020 & 2033
- Table 35: France Pet Obesity Management Industry Revenue (billion) Forecast, by Application 2020 & 2033
- Table 36: France Pet Obesity Management Industry Volume (K Unit) Forecast, by Application 2020 & 2033
- Table 37: Italy Pet Obesity Management Industry Revenue (billion) Forecast, by Application 2020 & 2033
- Table 38: Italy Pet Obesity Management Industry Volume (K Unit) Forecast, by Application 2020 & 2033
- Table 39: Spain Pet Obesity Management Industry Revenue (billion) Forecast, by Application 2020 & 2033
- Table 40: Spain Pet Obesity Management Industry Volume (K Unit) Forecast, by Application 2020 & 2033
- Table 41: Rest of Europe Pet Obesity Management Industry Revenue (billion) Forecast, by Application 2020 & 2033
- Table 42: Rest of Europe Pet Obesity Management Industry Volume (K Unit) Forecast, by Application 2020 & 2033
- Table 43: Global Pet Obesity Management Industry Revenue billion Forecast, by Products 2020 & 2033
- Table 44: Global Pet Obesity Management Industry Volume K Unit Forecast, by Products 2020 & 2033
- Table 45: Global Pet Obesity Management Industry Revenue billion Forecast, by Animal Type 2020 & 2033
- Table 46: Global Pet Obesity Management Industry Volume K Unit Forecast, by Animal Type 2020 & 2033
- Table 47: Global Pet Obesity Management Industry Revenue billion Forecast, by End User 2020 & 2033
- Table 48: Global Pet Obesity Management Industry Volume K Unit Forecast, by End User 2020 & 2033
- Table 49: Global Pet Obesity Management Industry Revenue billion Forecast, by Country 2020 & 2033
- Table 50: Global Pet Obesity Management Industry Volume K Unit Forecast, by Country 2020 & 2033
- Table 51: China Pet Obesity Management Industry Revenue (billion) Forecast, by Application 2020 & 2033
- Table 52: China Pet Obesity Management Industry Volume (K Unit) Forecast, by Application 2020 & 2033
- Table 53: Japan Pet Obesity Management Industry Revenue (billion) Forecast, by Application 2020 & 2033
- Table 54: Japan Pet Obesity Management Industry Volume (K Unit) Forecast, by Application 2020 & 2033
- Table 55: India Pet Obesity Management Industry Revenue (billion) Forecast, by Application 2020 & 2033
- Table 56: India Pet Obesity Management Industry Volume (K Unit) Forecast, by Application 2020 & 2033
- Table 57: Australia Pet Obesity Management Industry Revenue (billion) Forecast, by Application 2020 & 2033
- Table 58: Australia Pet Obesity Management Industry Volume (K Unit) Forecast, by Application 2020 & 2033
- Table 59: South Korea Pet Obesity Management Industry Revenue (billion) Forecast, by Application 2020 & 2033
- Table 60: South Korea Pet Obesity Management Industry Volume (K Unit) Forecast, by Application 2020 & 2033
- Table 61: Rest of Asia Pacific Pet Obesity Management Industry Revenue (billion) Forecast, by Application 2020 & 2033
- Table 62: Rest of Asia Pacific Pet Obesity Management Industry Volume (K Unit) Forecast, by Application 2020 & 2033
- Table 63: Global Pet Obesity Management Industry Revenue billion Forecast, by Products 2020 & 2033
- Table 64: Global Pet Obesity Management Industry Volume K Unit Forecast, by Products 2020 & 2033
- Table 65: Global Pet Obesity Management Industry Revenue billion Forecast, by Animal Type 2020 & 2033
- Table 66: Global Pet Obesity Management Industry Volume K Unit Forecast, by Animal Type 2020 & 2033
- Table 67: Global Pet Obesity Management Industry Revenue billion Forecast, by End User 2020 & 2033
- Table 68: Global Pet Obesity Management Industry Volume K Unit Forecast, by End User 2020 & 2033
- Table 69: Global Pet Obesity Management Industry Revenue billion Forecast, by Country 2020 & 2033
- Table 70: Global Pet Obesity Management Industry Volume K Unit Forecast, by Country 2020 & 2033
- Table 71: GCC Pet Obesity Management Industry Revenue (billion) Forecast, by Application 2020 & 2033
- Table 72: GCC Pet Obesity Management Industry Volume (K Unit) Forecast, by Application 2020 & 2033
- Table 73: South Africa Pet Obesity Management Industry Revenue (billion) Forecast, by Application 2020 & 2033
- Table 74: South Africa Pet Obesity Management Industry Volume (K Unit) Forecast, by Application 2020 & 2033
- Table 75: Rest of Middle East and Africa Pet Obesity Management Industry Revenue (billion) Forecast, by Application 2020 & 2033
- Table 76: Rest of Middle East and Africa Pet Obesity Management Industry Volume (K Unit) Forecast, by Application 2020 & 2033
- Table 77: Global Pet Obesity Management Industry Revenue billion Forecast, by Products 2020 & 2033
- Table 78: Global Pet Obesity Management Industry Volume K Unit Forecast, by Products 2020 & 2033
- Table 79: Global Pet Obesity Management Industry Revenue billion Forecast, by Animal Type 2020 & 2033
- Table 80: Global Pet Obesity Management Industry Volume K Unit Forecast, by Animal Type 2020 & 2033
- Table 81: Global Pet Obesity Management Industry Revenue billion Forecast, by End User 2020 & 2033
- Table 82: Global Pet Obesity Management Industry Volume K Unit Forecast, by End User 2020 & 2033
- Table 83: Global Pet Obesity Management Industry Revenue billion Forecast, by Country 2020 & 2033
- Table 84: Global Pet Obesity Management Industry Volume K Unit Forecast, by Country 2020 & 2033
- Table 85: Brazil Pet Obesity Management Industry Revenue (billion) Forecast, by Application 2020 & 2033
- Table 86: Brazil Pet Obesity Management Industry Volume (K Unit) Forecast, by Application 2020 & 2033
- Table 87: Argentina Pet Obesity Management Industry Revenue (billion) Forecast, by Application 2020 & 2033
- Table 88: Argentina Pet Obesity Management Industry Volume (K Unit) Forecast, by Application 2020 & 2033
- Table 89: Rest of South America Pet Obesity Management Industry Revenue (billion) Forecast, by Application 2020 & 2033
- Table 90: Rest of South America Pet Obesity Management Industry Volume (K Unit) Forecast, by Application 2020 & 2033
Frequently Asked Questions
1. What is the projected Compound Annual Growth Rate (CAGR) of the Pet Obesity Management Industry?
The projected CAGR is approximately 13.83%.
2. Which companies are prominent players in the Pet Obesity Management Industry?
Key companies in the market include Park Vet Group, Auxthera LLC, Weight Watchers, Pedigree, Pfizer Animal Health, Vivaldis, KONG Company, Hills Pet Nutrition Inc, Royal Canin.
3. What are the main segments of the Pet Obesity Management Industry?
The market segments include Products, Animal Type, End User.
4. Can you provide details about the market size?
The market size is estimated to be USD 9.67 billion as of 2022.
5. What are some drivers contributing to market growth?
Increasing Pet Ownership; Increasing Prevalence of Diabetes and Other Chronic Diseases Among Pets; Increasing Pet Insurance Policies and Coverage.
6. What are the notable trends driving market growth?
Dogs Segment is Expected to Hold a Major Share in the Pet Obesity Management Market.
7. Are there any restraints impacting market growth?
Lack of Awareness About Pet Obesity Management in Developing Economies.
8. Can you provide examples of recent developments in the market?
In May 2022, Park Vet Group launched the Veterinary Nursing Awareness campaign to raise awareness regarding the importance of veterinary nursing and pet nutrition balances.
9. What pricing options are available for accessing the report?
Pricing options include single-user, multi-user, and enterprise licenses priced at USD 4750, USD 5250, and USD 8750 respectively.
10. Is the market size provided in terms of value or volume?
The market size is provided in terms of value, measured in billion and volume, measured in K Unit.
11. Are there any specific market keywords associated with the report?
Yes, the market keyword associated with the report is "Pet Obesity Management Industry," which aids in identifying and referencing the specific market segment covered.
12. How do I determine which pricing option suits my needs best?
The pricing options vary based on user requirements and access needs. Individual users may opt for single-user licenses, while businesses requiring broader access may choose multi-user or enterprise licenses for cost-effective access to the report.
13. Are there any additional resources or data provided in the Pet Obesity Management Industry report?
While the report offers comprehensive insights, it's advisable to review the specific contents or supplementary materials provided to ascertain if additional resources or data are available.
14. How can I stay updated on further developments or reports in the Pet Obesity Management Industry?
To stay informed about further developments, trends, and reports in the Pet Obesity Management Industry, consider subscribing to industry newsletters, following relevant companies and organizations, or regularly checking reputable industry news sources and publications.
Methodology
Step 1 - Identification of Relevant Samples Size from Population Database


Step 2 - Approaches for Defining Global Market Size (Value, Volume* & Price*)

Note*: In applicable scenarios
Step 3 - Data Sources
Primary Research
- Web Analytics
- Survey Reports
- Research Institute
- Latest Research Reports
- Opinion Leaders
Secondary Research
- Annual Reports
- White Paper
- Latest Press Release
- Industry Association
- Paid Database
- Investor Presentations

Step 4 - Data Triangulation
Involves using different sources of information in order to increase the validity of a study
These sources are likely to be stakeholders in a program - participants, other researchers, program staff, other community members, and so on.
Then we put all data in single framework & apply various statistical tools to find out the dynamic on the market.
During the analysis stage, feedback from the stakeholder groups would be compared to determine areas of agreement as well as areas of divergence