

Key Insights
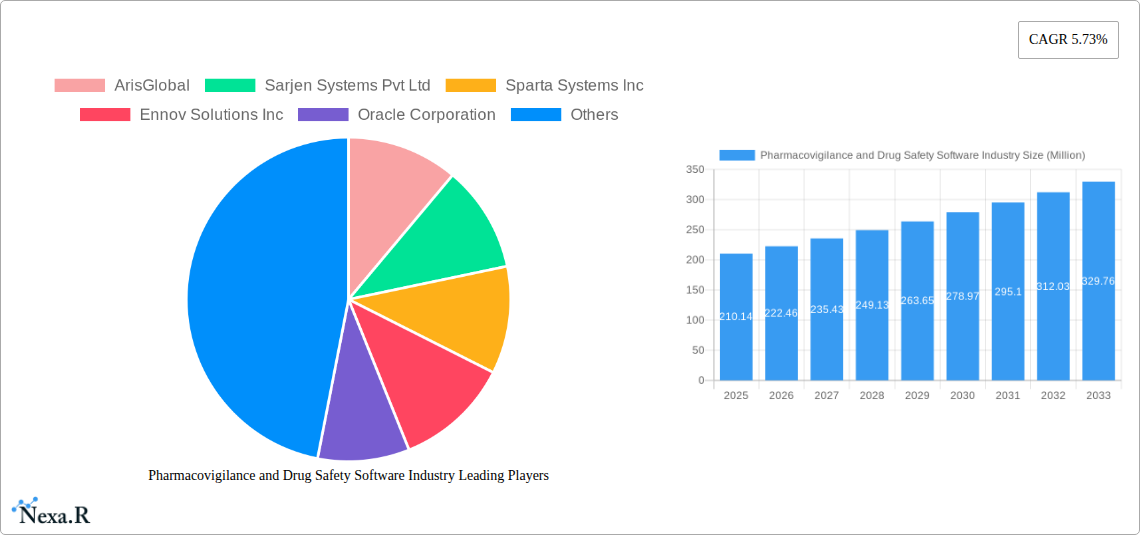
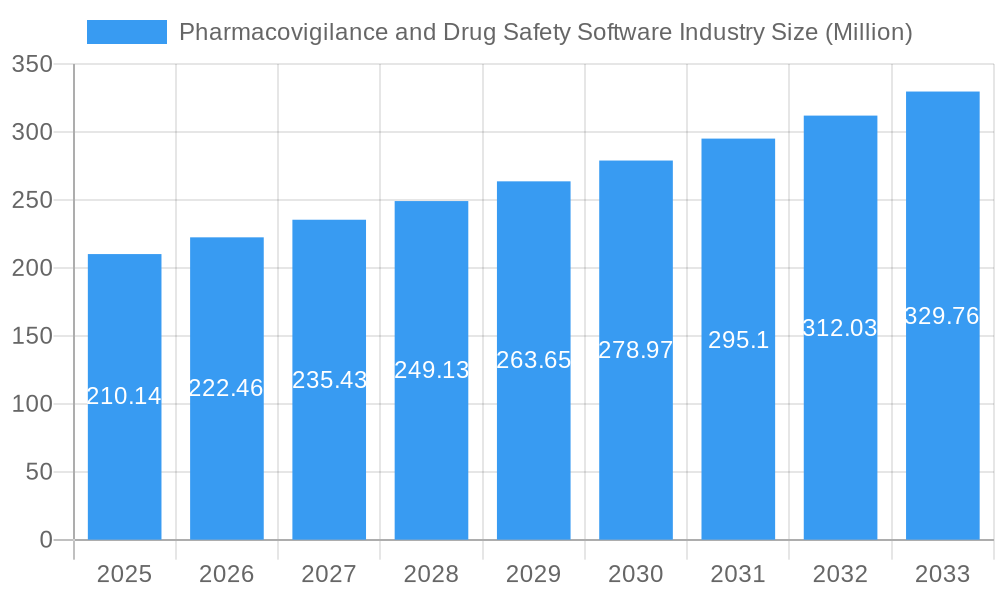
The global Pharmacovigilance and Drug Safety Software market, valued at $210.14 million in 2025, is projected to experience robust growth, driven by increasing regulatory scrutiny, rising drug development costs, and the growing need for efficient adverse event reporting and management. The market's Compound Annual Growth Rate (CAGR) of 5.73% from 2025 to 2033 indicates a significant expansion in market size over the forecast period. Key growth drivers include the increasing adoption of cloud-based solutions, which offer enhanced scalability, accessibility, and cost-effectiveness compared to on-premise deployments. Furthermore, the rising prevalence of chronic diseases and the consequent increase in drug consumption are fueling demand for sophisticated pharmacovigilance systems. The integration of artificial intelligence (AI) and machine learning (ML) in these systems is anticipated to further propel market growth by enabling faster and more accurate signal detection and risk assessment. Market segmentation reveals a strong demand across various functionalities, including adverse event reporting software, drug safety audits software, and fully integrated solutions. Pharmaceutical and biotechnology companies represent the largest end-user segment, followed by contract research organizations (CROs) and business process outsourcing (BPO) firms. Geographically, North America currently holds a significant market share, attributable to the presence of major pharmaceutical companies and robust regulatory frameworks. However, the Asia-Pacific region is poised for rapid expansion, driven by increasing healthcare expenditure and the growing adoption of advanced technologies in developing economies.
Pharmacovigilance and Drug Safety Software Industry Market Size (In Million)
While the market exhibits strong growth potential, challenges such as high implementation costs and the need for specialized expertise in deploying and maintaining these systems could pose some restraints. Moreover, data security and privacy concerns remain critical factors to address. To navigate these challenges and fully capitalize on market opportunities, vendors are increasingly focusing on developing user-friendly interfaces, improving data analytics capabilities, and strengthening security protocols. The ongoing integration of advanced technologies and the increasing adoption of cloud-based solutions are expected to mitigate these challenges and contribute to the sustained growth of the Pharmacovigilance and Drug Safety Software market.
Pharmacovigilance and Drug Safety Software Industry Company Market Share
Pharmacovigilance and Drug Safety Software Market Report: 2019-2033
This comprehensive report provides a detailed analysis of the Pharmacovigilance and Drug Safety Software market, encompassing market size, growth trends, competitive landscape, and future outlook. The study period covers 2019-2033, with 2025 as the base year and a forecast period of 2025-2033. The report segments the market by functionality (Adverse Event Reporting Software, Drug Safety Audits Software, Issue Tracking Software, Fully Integrated Software), mode of delivery (On-premise Delivery, On-demand/Cloud-based (SaaS) Delivery), and end-users (Pharmaceutical and Biotechnology Companies, Contract Research Organizations (CROs), Business Process Outsourcing (BPO) Firms, Other Pharmacovigilance Service Providers). Key players analyzed include ArisGlobal, Sarjen Systems Pvt Ltd, Sparta Systems Inc, Ennov Solutions Inc, Oracle Corporation, Anju Software Inc, Veeva Systems, Ab Cube, United BioSource Corporation, and Extedo GmbH. The report projects a market valued at xx Million units in 2025, exhibiting significant growth potential.
Pharmacovigilance and Drug Safety Software Industry Market Dynamics & Structure
The pharmacovigilance and drug safety software market is characterized by a moderately concentrated landscape, with several established players and emerging niche providers. Technological innovation, driven by advancements in AI and cloud computing, is a key growth driver. Stringent regulatory frameworks, particularly those mandated by agencies like the FDA and EMA, significantly influence market dynamics. Competitive pressures arise from both established players and innovative startups offering specialized solutions. The market is segmented by user type, reflecting varying needs and budgets across pharmaceutical companies, CROs, and BPO firms. M&A activity has been moderate, with strategic acquisitions aimed at expanding product portfolios and market reach.
- Market Concentration: Moderately concentrated, with top 10 players holding approximately xx% market share in 2025.
- Technological Innovation: AI-powered adverse event detection, cloud-based solutions, and improved data analytics are major drivers.
- Regulatory Frameworks: Compliance with FDA and EMA guidelines shapes software development and adoption.
- Competitive Substitutes: Limited direct substitutes, but alternative data management solutions pose indirect competition.
- End-User Demographics: Pharmaceutical and Biotechnology Companies represent the largest segment, followed by CROs and BPO firms.
- M&A Trends: Moderate activity, primarily focused on strategic acquisitions to enhance capabilities and market penetration (xx deals recorded between 2019-2024).
Pharmacovigilance and Drug Safety Software Industry Growth Trends & Insights
The pharmacovigilance and drug safety software market is experiencing robust growth, driven by increasing regulatory scrutiny, growing data volumes, and the rising adoption of cloud-based solutions. The market size has expanded significantly from xx Million units in 2019 to an estimated xx Million units in 2025, projecting a CAGR of xx% during the historical period (2019-2024) and a projected CAGR of xx% during the forecast period (2025-2033). This growth is fueled by a rising awareness of the importance of patient safety, the increasing complexity of drug development, and the need for efficient data management systems. The shift towards cloud-based solutions is accelerating adoption, driven by scalability, cost-effectiveness, and enhanced accessibility. The increasing penetration of AI and machine learning in pharmacovigilance is improving the efficiency of adverse event detection and risk assessment. Consumer behavior is shifting toward a preference for user-friendly and integrated systems that streamline workflows and improve collaboration among stakeholders.
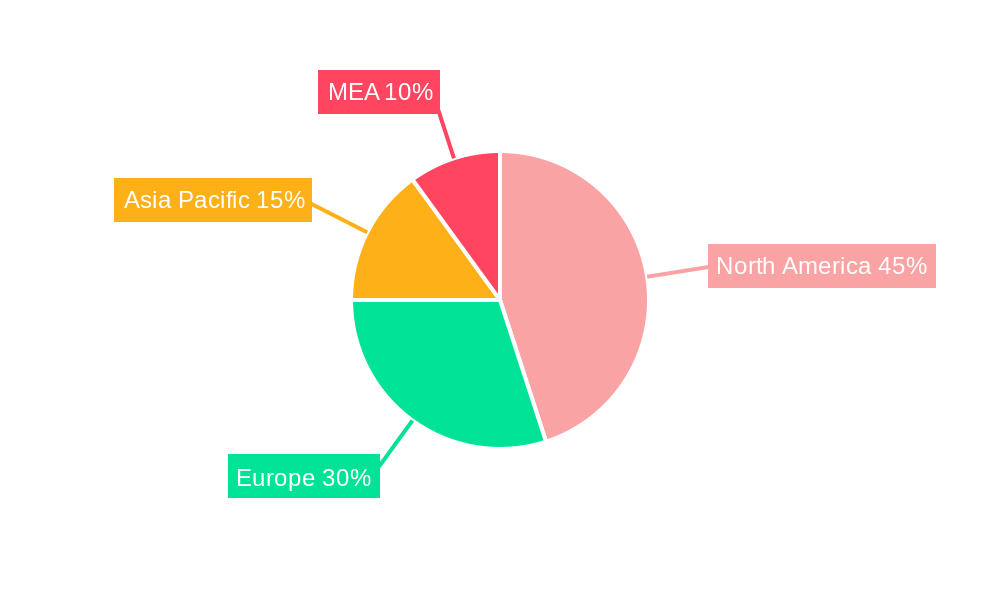
Dominant Regions, Countries, or Segments in Pharmacovigilance and Drug Safety Software Industry
North America currently dominates the pharmacovigilance and drug safety software market, driven by the presence of major pharmaceutical companies, advanced regulatory frameworks, and high adoption rates of advanced technologies. Europe follows closely, exhibiting significant growth potential. Within functionalities, the demand for fully integrated software solutions is surging, offering streamlined workflow and improved data management. Cloud-based SaaS delivery models are gaining traction over on-premise deployments. Pharmaceutical and Biotechnology companies represent the largest end-user segment.
- Key Drivers (North America): Strong regulatory environment, presence of major pharmaceutical companies, high technology adoption rates.
- Key Drivers (Europe): Growing R&D investments, increasing regulatory compliance needs, strong healthcare infrastructure.
- Dominant Functionality: Fully Integrated Software (market share xx% in 2025)
- Dominant Delivery Model: On-demand/Cloud-based (SaaS) Delivery (market share xx% in 2025)
- Dominant End-User: Pharmaceutical and Biotechnology Companies (market share xx% in 2025)
Pharmacovigilance and Drug Safety Software Industry Product Landscape
The product landscape is dynamic, characterized by a range of solutions offering varying levels of functionality and integration. Key innovations include AI-powered adverse event detection, automated reporting tools, enhanced data visualization capabilities, and improved interoperability. Leading vendors are focusing on developing user-friendly interfaces, robust security features, and scalable platforms to meet the diverse needs of users. The unique selling propositions often revolve around ease of use, compliance features, scalability, and integration with existing systems.
Key Drivers, Barriers & Challenges in Pharmacovigilance and Drug Safety Software Industry
Key Drivers: Increasing regulatory requirements, growing data volumes, the need for improved data management, and the adoption of advanced technologies like AI and cloud computing are driving market growth. The rising awareness of patient safety and the need for efficient risk management also contribute.
Challenges: High initial investment costs, complexity of integration with existing systems, data security concerns, and the need for skilled personnel to operate and maintain the software can impede adoption. Regulatory changes and compliance issues may present additional hurdles. Competition from established and emerging players impacts market share.
Emerging Opportunities in Pharmacovigilance and Drug Safety Software Industry
Untapped markets in emerging economies, the integration of wearables and other connected devices for real-time data capture, and the development of advanced analytics capabilities for predictive risk assessment offer significant opportunities. The growing demand for solutions that facilitate global collaboration and regulatory compliance is also creating new avenues for growth.
Growth Accelerators in the Pharmacovigilance and Drug Safety Software Industry Industry
Technological advancements such as AI, machine learning, and big data analytics are enhancing the capabilities of pharmacovigilance software, leading to more efficient and effective safety monitoring. Strategic partnerships and collaborations between software providers and pharmaceutical companies are accelerating innovation and market expansion. The increasing adoption of cloud-based solutions and the expansion of the market in emerging economies are further propelling growth.
Key Players Shaping the Pharmacovigilance and Drug Safety Software Market
- ArisGlobal
- Sarjen Systems Pvt Ltd
- Sparta Systems Inc
- Ennov Solutions Inc
- Oracle Corporation
- Anju Software Inc
- Veeva Systems
- Ab Cube
- United BioSource Corporation
- Extedo GmbH
Notable Milestones in Pharmacovigilance and Drug Safety Software Industry Sector
- October 2022: PegBio selected LifeSphere MultiVigilance (ArisGlobal) to manage their pharmacovigilance in-house. This highlights the growing preference for sophisticated in-house solutions.
- July 2022: Dotmatics launched its Small Molecule Drug Discovery Solution, expanding data management capabilities within scientific R&D. This signifies the broader integration of data management tools within the drug development lifecycle.
In-Depth Pharmacovigilance and Drug Safety Software Industry Market Outlook
The pharmacovigilance and drug safety software market is poised for sustained growth driven by technological advancements, increasing regulatory scrutiny, and the expanding adoption of cloud-based solutions. Strategic partnerships, expansion into emerging markets, and the development of innovative applications will continue to shape market dynamics. The market offers significant opportunities for companies that can offer comprehensive, user-friendly, and compliant solutions.
Pharmacovigilance and Drug Safety Software Industry Segmentation
-
1. Functionality
- 1.1. Adverse Event Reporting Software
- 1.2. Drug Safety Audits Software
- 1.3. Issue Tracking Software
- 1.4. Fully Integrated Software
-
2. Mode of Delivery
- 2.1. On-premise Delivery
- 2.2. On-demand/ Cloud-based (SaaS) Delivery
-
3. End Users
- 3.1. Pharmaceutical and Biotechnology Companies
- 3.2. Contract Research Organizations
- 3.3. Business Process Outsourcing Firms
- 3.4. Other Pharmacovigilance Service Providers
Pharmacovigilance and Drug Safety Software Industry Segmentation By Geography
-
1. North America
- 1.1. United States
- 1.2. Canada
- 1.3. Mexico
-
2. Europe
- 2.1. Germany
- 2.2. United Kingdom
- 2.3. France
- 2.4. Italy
- 2.5. Spain
- 2.6. Rest of Europe
-
3. Asia Pacific
- 3.1. China
- 3.2. Japan
- 3.3. India
- 3.4. Australia
- 3.5. South Korea
- 3.6. Rest of Asia Pacific
-
4. Middle East and Africa
- 4.1. GCC
- 4.2. South Africa
- 4.3. Rest of Middle East and Africa
-
5. South America
- 5.1. Brazil
- 5.2. Argentina
- 5.3. Rest of South America
Pharmacovigilance and Drug Safety Software Industry Regional Market Share
Geographic Coverage of Pharmacovigilance and Drug Safety Software Industry
Pharmacovigilance and Drug Safety Software Industry REPORT HIGHLIGHTS
| Aspects | Details |
|---|---|
| Study Period | 2020-2034 |
| Base Year | 2025 |
| Estimated Year | 2026 |
| Forecast Period | 2026-2034 |
| Historical Period | 2020-2025 |
| Growth Rate | CAGR of 5.73% from 2020-2034 |
| Segmentation |
|
Table of Contents
- 1. Introduction
- 1.1. Research Scope
- 1.2. Market Segmentation
- 1.3. Research Objective
- 1.4. Definitions and Assumptions
- 2. Executive Summary
- 2.1. Market Snapshot
- 3. Market Dynamics
- 3.1. Market Drivers
- 3.2. Market Restrains
- 3.3. Market Trends
- 3.4. Market Opportunities
- 4. Market Factor Analysis
- 4.1. Porters Five Forces
- 4.1.1. Bargaining Power of Suppliers
- 4.1.2. Bargaining Power of Buyers
- 4.1.3. Threat of New Entrants
- 4.1.4. Threat of Substitutes
- 4.1.5. Competitive Rivalry
- 4.2. PESTEL analysis
- 4.3. BCG Analysis
- 4.3.1. Stars (High Growth, High Market Share)
- 4.3.2. Cash Cows (Low Growth, High Market Share)
- 4.3.3. Question Mark (High Growth, Low Market Share)
- 4.3.4. Dogs (Low Growth, Low Market Share)
- 4.4. Ansoff Matrix Analysis
- 4.5. Supply Chain Analysis
- 4.6. Regulatory Landscape
- 4.7. Current Market Potential and Opportunity Assessment (TAM–SAM–SOM Framework)
- 4.8. NRP Analyst Note
- 4.1. Porters Five Forces
- 5. Market Analysis, Insights and Forecast 2021-2033
- 5.1. Market Analysis, Insights and Forecast - by Functionality
- 5.1.1. Adverse Event Reporting Software
- 5.1.2. Drug Safety Audits Software
- 5.1.3. Issue Tracking Software
- 5.1.4. Fully Integrated Software
- 5.2. Market Analysis, Insights and Forecast - by Mode of Delivery
- 5.2.1. On-premise Delivery
- 5.2.2. On-demand/ Cloud-based (SaaS) Delivery
- 5.3. Market Analysis, Insights and Forecast - by End Users
- 5.3.1. Pharmaceutical and Biotechnology Companies
- 5.3.2. Contract Research Organizations
- 5.3.3. Business Process Outsourcing Firms
- 5.3.4. Other Pharmacovigilance Service Providers
- 5.4. Market Analysis, Insights and Forecast - by Region
- 5.4.1. North America
- 5.4.2. Europe
- 5.4.3. Asia Pacific
- 5.4.4. Middle East and Africa
- 5.4.5. South America
- 5.1. Market Analysis, Insights and Forecast - by Functionality
- 6. Global Pharmacovigilance and Drug Safety Software Industry Analysis, Insights and Forecast, 2021-2033
- 6.1. Market Analysis, Insights and Forecast - by Functionality
- 6.1.1. Adverse Event Reporting Software
- 6.1.2. Drug Safety Audits Software
- 6.1.3. Issue Tracking Software
- 6.1.4. Fully Integrated Software
- 6.2. Market Analysis, Insights and Forecast - by Mode of Delivery
- 6.2.1. On-premise Delivery
- 6.2.2. On-demand/ Cloud-based (SaaS) Delivery
- 6.3. Market Analysis, Insights and Forecast - by End Users
- 6.3.1. Pharmaceutical and Biotechnology Companies
- 6.3.2. Contract Research Organizations
- 6.3.3. Business Process Outsourcing Firms
- 6.3.4. Other Pharmacovigilance Service Providers
- 6.1. Market Analysis, Insights and Forecast - by Functionality
- 7. North America Pharmacovigilance and Drug Safety Software Industry Analysis, Insights and Forecast, 2020-2032
- 7.1. Market Analysis, Insights and Forecast - by Functionality
- 7.1.1. Adverse Event Reporting Software
- 7.1.2. Drug Safety Audits Software
- 7.1.3. Issue Tracking Software
- 7.1.4. Fully Integrated Software
- 7.2. Market Analysis, Insights and Forecast - by Mode of Delivery
- 7.2.1. On-premise Delivery
- 7.2.2. On-demand/ Cloud-based (SaaS) Delivery
- 7.3. Market Analysis, Insights and Forecast - by End Users
- 7.3.1. Pharmaceutical and Biotechnology Companies
- 7.3.2. Contract Research Organizations
- 7.3.3. Business Process Outsourcing Firms
- 7.3.4. Other Pharmacovigilance Service Providers
- 7.1. Market Analysis, Insights and Forecast - by Functionality
- 8. Europe Pharmacovigilance and Drug Safety Software Industry Analysis, Insights and Forecast, 2020-2032
- 8.1. Market Analysis, Insights and Forecast - by Functionality
- 8.1.1. Adverse Event Reporting Software
- 8.1.2. Drug Safety Audits Software
- 8.1.3. Issue Tracking Software
- 8.1.4. Fully Integrated Software
- 8.2. Market Analysis, Insights and Forecast - by Mode of Delivery
- 8.2.1. On-premise Delivery
- 8.2.2. On-demand/ Cloud-based (SaaS) Delivery
- 8.3. Market Analysis, Insights and Forecast - by End Users
- 8.3.1. Pharmaceutical and Biotechnology Companies
- 8.3.2. Contract Research Organizations
- 8.3.3. Business Process Outsourcing Firms
- 8.3.4. Other Pharmacovigilance Service Providers
- 8.1. Market Analysis, Insights and Forecast - by Functionality
- 9. Asia Pacific Pharmacovigilance and Drug Safety Software Industry Analysis, Insights and Forecast, 2020-2032
- 9.1. Market Analysis, Insights and Forecast - by Functionality
- 9.1.1. Adverse Event Reporting Software
- 9.1.2. Drug Safety Audits Software
- 9.1.3. Issue Tracking Software
- 9.1.4. Fully Integrated Software
- 9.2. Market Analysis, Insights and Forecast - by Mode of Delivery
- 9.2.1. On-premise Delivery
- 9.2.2. On-demand/ Cloud-based (SaaS) Delivery
- 9.3. Market Analysis, Insights and Forecast - by End Users
- 9.3.1. Pharmaceutical and Biotechnology Companies
- 9.3.2. Contract Research Organizations
- 9.3.3. Business Process Outsourcing Firms
- 9.3.4. Other Pharmacovigilance Service Providers
- 9.1. Market Analysis, Insights and Forecast - by Functionality
- 10. Middle East and Africa Pharmacovigilance and Drug Safety Software Industry Analysis, Insights and Forecast, 2020-2032
- 10.1. Market Analysis, Insights and Forecast - by Functionality
- 10.1.1. Adverse Event Reporting Software
- 10.1.2. Drug Safety Audits Software
- 10.1.3. Issue Tracking Software
- 10.1.4. Fully Integrated Software
- 10.2. Market Analysis, Insights and Forecast - by Mode of Delivery
- 10.2.1. On-premise Delivery
- 10.2.2. On-demand/ Cloud-based (SaaS) Delivery
- 10.3. Market Analysis, Insights and Forecast - by End Users
- 10.3.1. Pharmaceutical and Biotechnology Companies
- 10.3.2. Contract Research Organizations
- 10.3.3. Business Process Outsourcing Firms
- 10.3.4. Other Pharmacovigilance Service Providers
- 10.1. Market Analysis, Insights and Forecast - by Functionality
- 11. South America Pharmacovigilance and Drug Safety Software Industry Analysis, Insights and Forecast, 2020-2032
- 11.1. Market Analysis, Insights and Forecast - by Functionality
- 11.1.1. Adverse Event Reporting Software
- 11.1.2. Drug Safety Audits Software
- 11.1.3. Issue Tracking Software
- 11.1.4. Fully Integrated Software
- 11.2. Market Analysis, Insights and Forecast - by Mode of Delivery
- 11.2.1. On-premise Delivery
- 11.2.2. On-demand/ Cloud-based (SaaS) Delivery
- 11.3. Market Analysis, Insights and Forecast - by End Users
- 11.3.1. Pharmaceutical and Biotechnology Companies
- 11.3.2. Contract Research Organizations
- 11.3.3. Business Process Outsourcing Firms
- 11.3.4. Other Pharmacovigilance Service Providers
- 11.1. Market Analysis, Insights and Forecast - by Functionality
- 12. Competitive Analysis
- 12.1. Company Profiles
- 12.1.1 ArisGlobal
- 12.1.1.1. Company Overview
- 12.1.1.2. Products
- 12.1.1.3. Company Financials
- 12.1.1.4. SWOT Analysis
- 12.1.2 Sarjen Systems Pvt Ltd
- 12.1.2.1. Company Overview
- 12.1.2.2. Products
- 12.1.2.3. Company Financials
- 12.1.2.4. SWOT Analysis
- 12.1.3 Sparta Systems Inc
- 12.1.3.1. Company Overview
- 12.1.3.2. Products
- 12.1.3.3. Company Financials
- 12.1.3.4. SWOT Analysis
- 12.1.4 Ennov Solutions Inc
- 12.1.4.1. Company Overview
- 12.1.4.2. Products
- 12.1.4.3. Company Financials
- 12.1.4.4. SWOT Analysis
- 12.1.5 Oracle Corporation
- 12.1.5.1. Company Overview
- 12.1.5.2. Products
- 12.1.5.3. Company Financials
- 12.1.5.4. SWOT Analysis
- 12.1.6 Anju Software Inc
- 12.1.6.1. Company Overview
- 12.1.6.2. Products
- 12.1.6.3. Company Financials
- 12.1.6.4. SWOT Analysis
- 12.1.7 Veeva Systems
- 12.1.7.1. Company Overview
- 12.1.7.2. Products
- 12.1.7.3. Company Financials
- 12.1.7.4. SWOT Analysis
- 12.1.8 Ab Cube
- 12.1.8.1. Company Overview
- 12.1.8.2. Products
- 12.1.8.3. Company Financials
- 12.1.8.4. SWOT Analysis
- 12.1.9 United BioSource Corporation
- 12.1.9.1. Company Overview
- 12.1.9.2. Products
- 12.1.9.3. Company Financials
- 12.1.9.4. SWOT Analysis
- 12.1.10 Extedo GmbH
- 12.1.10.1. Company Overview
- 12.1.10.2. Products
- 12.1.10.3. Company Financials
- 12.1.10.4. SWOT Analysis
- 12.1.1 ArisGlobal
- 12.2. Market Entropy
- 12.2.1 Company's Key Areas Served
- 12.2.2 Recent Developments
- 12.3. Company Market Share Analysis 2025
- 12.3.1 Top 5 Companies Market Share Analysis
- 12.3.2 Top 3 Companies Market Share Analysis
- 12.4. List of Potential Customers
- 13. Research Methodology
List of Figures
- Figure 1: Global Pharmacovigilance and Drug Safety Software Industry Revenue Breakdown (Million, %) by Region 2025 & 2033
- Figure 2: North America Pharmacovigilance and Drug Safety Software Industry Revenue (Million), by Functionality 2025 & 2033
- Figure 3: North America Pharmacovigilance and Drug Safety Software Industry Revenue Share (%), by Functionality 2025 & 2033
- Figure 4: North America Pharmacovigilance and Drug Safety Software Industry Revenue (Million), by Mode of Delivery 2025 & 2033
- Figure 5: North America Pharmacovigilance and Drug Safety Software Industry Revenue Share (%), by Mode of Delivery 2025 & 2033
- Figure 6: North America Pharmacovigilance and Drug Safety Software Industry Revenue (Million), by End Users 2025 & 2033
- Figure 7: North America Pharmacovigilance and Drug Safety Software Industry Revenue Share (%), by End Users 2025 & 2033
- Figure 8: North America Pharmacovigilance and Drug Safety Software Industry Revenue (Million), by Country 2025 & 2033
- Figure 9: North America Pharmacovigilance and Drug Safety Software Industry Revenue Share (%), by Country 2025 & 2033
- Figure 10: Europe Pharmacovigilance and Drug Safety Software Industry Revenue (Million), by Functionality 2025 & 2033
- Figure 11: Europe Pharmacovigilance and Drug Safety Software Industry Revenue Share (%), by Functionality 2025 & 2033
- Figure 12: Europe Pharmacovigilance and Drug Safety Software Industry Revenue (Million), by Mode of Delivery 2025 & 2033
- Figure 13: Europe Pharmacovigilance and Drug Safety Software Industry Revenue Share (%), by Mode of Delivery 2025 & 2033
- Figure 14: Europe Pharmacovigilance and Drug Safety Software Industry Revenue (Million), by End Users 2025 & 2033
- Figure 15: Europe Pharmacovigilance and Drug Safety Software Industry Revenue Share (%), by End Users 2025 & 2033
- Figure 16: Europe Pharmacovigilance and Drug Safety Software Industry Revenue (Million), by Country 2025 & 2033
- Figure 17: Europe Pharmacovigilance and Drug Safety Software Industry Revenue Share (%), by Country 2025 & 2033
- Figure 18: Asia Pacific Pharmacovigilance and Drug Safety Software Industry Revenue (Million), by Functionality 2025 & 2033
- Figure 19: Asia Pacific Pharmacovigilance and Drug Safety Software Industry Revenue Share (%), by Functionality 2025 & 2033
- Figure 20: Asia Pacific Pharmacovigilance and Drug Safety Software Industry Revenue (Million), by Mode of Delivery 2025 & 2033
- Figure 21: Asia Pacific Pharmacovigilance and Drug Safety Software Industry Revenue Share (%), by Mode of Delivery 2025 & 2033
- Figure 22: Asia Pacific Pharmacovigilance and Drug Safety Software Industry Revenue (Million), by End Users 2025 & 2033
- Figure 23: Asia Pacific Pharmacovigilance and Drug Safety Software Industry Revenue Share (%), by End Users 2025 & 2033
- Figure 24: Asia Pacific Pharmacovigilance and Drug Safety Software Industry Revenue (Million), by Country 2025 & 2033
- Figure 25: Asia Pacific Pharmacovigilance and Drug Safety Software Industry Revenue Share (%), by Country 2025 & 2033
- Figure 26: Middle East and Africa Pharmacovigilance and Drug Safety Software Industry Revenue (Million), by Functionality 2025 & 2033
- Figure 27: Middle East and Africa Pharmacovigilance and Drug Safety Software Industry Revenue Share (%), by Functionality 2025 & 2033
- Figure 28: Middle East and Africa Pharmacovigilance and Drug Safety Software Industry Revenue (Million), by Mode of Delivery 2025 & 2033
- Figure 29: Middle East and Africa Pharmacovigilance and Drug Safety Software Industry Revenue Share (%), by Mode of Delivery 2025 & 2033
- Figure 30: Middle East and Africa Pharmacovigilance and Drug Safety Software Industry Revenue (Million), by End Users 2025 & 2033
- Figure 31: Middle East and Africa Pharmacovigilance and Drug Safety Software Industry Revenue Share (%), by End Users 2025 & 2033
- Figure 32: Middle East and Africa Pharmacovigilance and Drug Safety Software Industry Revenue (Million), by Country 2025 & 2033
- Figure 33: Middle East and Africa Pharmacovigilance and Drug Safety Software Industry Revenue Share (%), by Country 2025 & 2033
- Figure 34: South America Pharmacovigilance and Drug Safety Software Industry Revenue (Million), by Functionality 2025 & 2033
- Figure 35: South America Pharmacovigilance and Drug Safety Software Industry Revenue Share (%), by Functionality 2025 & 2033
- Figure 36: South America Pharmacovigilance and Drug Safety Software Industry Revenue (Million), by Mode of Delivery 2025 & 2033
- Figure 37: South America Pharmacovigilance and Drug Safety Software Industry Revenue Share (%), by Mode of Delivery 2025 & 2033
- Figure 38: South America Pharmacovigilance and Drug Safety Software Industry Revenue (Million), by End Users 2025 & 2033
- Figure 39: South America Pharmacovigilance and Drug Safety Software Industry Revenue Share (%), by End Users 2025 & 2033
- Figure 40: South America Pharmacovigilance and Drug Safety Software Industry Revenue (Million), by Country 2025 & 2033
- Figure 41: South America Pharmacovigilance and Drug Safety Software Industry Revenue Share (%), by Country 2025 & 2033
List of Tables
- Table 1: Global Pharmacovigilance and Drug Safety Software Industry Revenue Million Forecast, by Functionality 2020 & 2033
- Table 2: Global Pharmacovigilance and Drug Safety Software Industry Revenue Million Forecast, by Mode of Delivery 2020 & 2033
- Table 3: Global Pharmacovigilance and Drug Safety Software Industry Revenue Million Forecast, by End Users 2020 & 2033
- Table 4: Global Pharmacovigilance and Drug Safety Software Industry Revenue Million Forecast, by Region 2020 & 2033
- Table 5: Global Pharmacovigilance and Drug Safety Software Industry Revenue Million Forecast, by Functionality 2020 & 2033
- Table 6: Global Pharmacovigilance and Drug Safety Software Industry Revenue Million Forecast, by Mode of Delivery 2020 & 2033
- Table 7: Global Pharmacovigilance and Drug Safety Software Industry Revenue Million Forecast, by End Users 2020 & 2033
- Table 8: Global Pharmacovigilance and Drug Safety Software Industry Revenue Million Forecast, by Country 2020 & 2033
- Table 9: United States Pharmacovigilance and Drug Safety Software Industry Revenue (Million) Forecast, by Application 2020 & 2033
- Table 10: Canada Pharmacovigilance and Drug Safety Software Industry Revenue (Million) Forecast, by Application 2020 & 2033
- Table 11: Mexico Pharmacovigilance and Drug Safety Software Industry Revenue (Million) Forecast, by Application 2020 & 2033
- Table 12: Global Pharmacovigilance and Drug Safety Software Industry Revenue Million Forecast, by Functionality 2020 & 2033
- Table 13: Global Pharmacovigilance and Drug Safety Software Industry Revenue Million Forecast, by Mode of Delivery 2020 & 2033
- Table 14: Global Pharmacovigilance and Drug Safety Software Industry Revenue Million Forecast, by End Users 2020 & 2033
- Table 15: Global Pharmacovigilance and Drug Safety Software Industry Revenue Million Forecast, by Country 2020 & 2033
- Table 16: Germany Pharmacovigilance and Drug Safety Software Industry Revenue (Million) Forecast, by Application 2020 & 2033
- Table 17: United Kingdom Pharmacovigilance and Drug Safety Software Industry Revenue (Million) Forecast, by Application 2020 & 2033
- Table 18: France Pharmacovigilance and Drug Safety Software Industry Revenue (Million) Forecast, by Application 2020 & 2033
- Table 19: Italy Pharmacovigilance and Drug Safety Software Industry Revenue (Million) Forecast, by Application 2020 & 2033
- Table 20: Spain Pharmacovigilance and Drug Safety Software Industry Revenue (Million) Forecast, by Application 2020 & 2033
- Table 21: Rest of Europe Pharmacovigilance and Drug Safety Software Industry Revenue (Million) Forecast, by Application 2020 & 2033
- Table 22: Global Pharmacovigilance and Drug Safety Software Industry Revenue Million Forecast, by Functionality 2020 & 2033
- Table 23: Global Pharmacovigilance and Drug Safety Software Industry Revenue Million Forecast, by Mode of Delivery 2020 & 2033
- Table 24: Global Pharmacovigilance and Drug Safety Software Industry Revenue Million Forecast, by End Users 2020 & 2033
- Table 25: Global Pharmacovigilance and Drug Safety Software Industry Revenue Million Forecast, by Country 2020 & 2033
- Table 26: China Pharmacovigilance and Drug Safety Software Industry Revenue (Million) Forecast, by Application 2020 & 2033
- Table 27: Japan Pharmacovigilance and Drug Safety Software Industry Revenue (Million) Forecast, by Application 2020 & 2033
- Table 28: India Pharmacovigilance and Drug Safety Software Industry Revenue (Million) Forecast, by Application 2020 & 2033
- Table 29: Australia Pharmacovigilance and Drug Safety Software Industry Revenue (Million) Forecast, by Application 2020 & 2033
- Table 30: South Korea Pharmacovigilance and Drug Safety Software Industry Revenue (Million) Forecast, by Application 2020 & 2033
- Table 31: Rest of Asia Pacific Pharmacovigilance and Drug Safety Software Industry Revenue (Million) Forecast, by Application 2020 & 2033
- Table 32: Global Pharmacovigilance and Drug Safety Software Industry Revenue Million Forecast, by Functionality 2020 & 2033
- Table 33: Global Pharmacovigilance and Drug Safety Software Industry Revenue Million Forecast, by Mode of Delivery 2020 & 2033
- Table 34: Global Pharmacovigilance and Drug Safety Software Industry Revenue Million Forecast, by End Users 2020 & 2033
- Table 35: Global Pharmacovigilance and Drug Safety Software Industry Revenue Million Forecast, by Country 2020 & 2033
- Table 36: GCC Pharmacovigilance and Drug Safety Software Industry Revenue (Million) Forecast, by Application 2020 & 2033
- Table 37: South Africa Pharmacovigilance and Drug Safety Software Industry Revenue (Million) Forecast, by Application 2020 & 2033
- Table 38: Rest of Middle East and Africa Pharmacovigilance and Drug Safety Software Industry Revenue (Million) Forecast, by Application 2020 & 2033
- Table 39: Global Pharmacovigilance and Drug Safety Software Industry Revenue Million Forecast, by Functionality 2020 & 2033
- Table 40: Global Pharmacovigilance and Drug Safety Software Industry Revenue Million Forecast, by Mode of Delivery 2020 & 2033
- Table 41: Global Pharmacovigilance and Drug Safety Software Industry Revenue Million Forecast, by End Users 2020 & 2033
- Table 42: Global Pharmacovigilance and Drug Safety Software Industry Revenue Million Forecast, by Country 2020 & 2033
- Table 43: Brazil Pharmacovigilance and Drug Safety Software Industry Revenue (Million) Forecast, by Application 2020 & 2033
- Table 44: Argentina Pharmacovigilance and Drug Safety Software Industry Revenue (Million) Forecast, by Application 2020 & 2033
- Table 45: Rest of South America Pharmacovigilance and Drug Safety Software Industry Revenue (Million) Forecast, by Application 2020 & 2033
Frequently Asked Questions
1. What is the projected Compound Annual Growth Rate (CAGR) of the Pharmacovigilance and Drug Safety Software Industry?
The projected CAGR is approximately 5.73%.
2. Which companies are prominent players in the Pharmacovigilance and Drug Safety Software Industry?
Key companies in the market include ArisGlobal, Sarjen Systems Pvt Ltd, Sparta Systems Inc, Ennov Solutions Inc, Oracle Corporation, Anju Software Inc, Veeva Systems, Ab Cube, United BioSource Corporation, Extedo GmbH.
3. What are the main segments of the Pharmacovigilance and Drug Safety Software Industry?
The market segments include Functionality, Mode of Delivery, End Users.
4. Can you provide details about the market size?
The market size is estimated to be USD 210.14 Million as of 2022.
5. What are some drivers contributing to market growth?
Increasing Incidence of Adverse Drug Reactions (ADRs); Increasing Adoption of Pharmacovigilance Software by Outsourcing Companies.
6. What are the notable trends driving market growth?
Fully Integrated Software Expected to Witness Significant Growth Over the Forecast Period.
7. Are there any restraints impacting market growth?
Lack of Awareness about Pharmacovigilance.
8. Can you provide examples of recent developments in the market?
October 2022: PegBio selected LifeSphere MultiVigilance, a flagship product by ArisGlobal, to transition their pharmacovigilance from Contract Research Organization (CRO) services to in-house practices with this leading pharmacovigilance software.
9. What pricing options are available for accessing the report?
Pricing options include single-user, multi-user, and enterprise licenses priced at USD 4750, USD 5250, and USD 8750 respectively.
10. Is the market size provided in terms of value or volume?
The market size is provided in terms of value, measured in Million.
11. Are there any specific market keywords associated with the report?
Yes, the market keyword associated with the report is "Pharmacovigilance and Drug Safety Software Industry," which aids in identifying and referencing the specific market segment covered.
12. How do I determine which pricing option suits my needs best?
The pricing options vary based on user requirements and access needs. Individual users may opt for single-user licenses, while businesses requiring broader access may choose multi-user or enterprise licenses for cost-effective access to the report.
13. Are there any additional resources or data provided in the Pharmacovigilance and Drug Safety Software Industry report?
While the report offers comprehensive insights, it's advisable to review the specific contents or supplementary materials provided to ascertain if additional resources or data are available.
14. How can I stay updated on further developments or reports in the Pharmacovigilance and Drug Safety Software Industry?
To stay informed about further developments, trends, and reports in the Pharmacovigilance and Drug Safety Software Industry, consider subscribing to industry newsletters, following relevant companies and organizations, or regularly checking reputable industry news sources and publications.
Methodology
Step 1 - Identification of Relevant Samples Size from Population Database


Step 2 - Approaches for Defining Global Market Size (Value, Volume* & Price*)

Note*: In applicable scenarios
Step 3 - Data Sources
Primary Research
- Web Analytics
- Survey Reports
- Research Institute
- Latest Research Reports
- Opinion Leaders
Secondary Research
- Annual Reports
- White Paper
- Latest Press Release
- Industry Association
- Paid Database
- Investor Presentations

Step 4 - Data Triangulation
Involves using different sources of information in order to increase the validity of a study
These sources are likely to be stakeholders in a program - participants, other researchers, program staff, other community members, and so on.
Then we put all data in single framework & apply various statistical tools to find out the dynamic on the market.
During the analysis stage, feedback from the stakeholder groups would be compared to determine areas of agreement as well as areas of divergence