

Key Insights
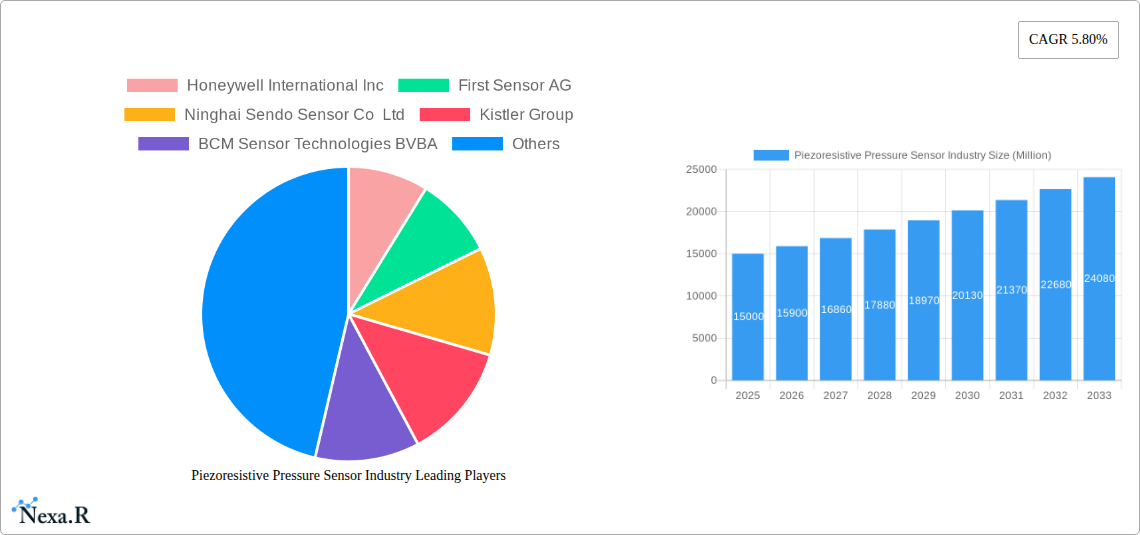
The global piezoresistive pressure sensor market is experiencing robust growth, projected to reach a substantial size by 2033. A Compound Annual Growth Rate (CAGR) of 5.80% from 2025 to 2033 indicates a steady expansion driven by several key factors. The increasing adoption of advanced driver-assistance systems (ADAS) in the automotive industry significantly fuels demand, along with the expanding healthcare sector's reliance on precise pressure measurement for medical devices. Furthermore, the growing need for efficient process control and monitoring in industrial automation and oil & gas extraction contributes to market expansion. Technological advancements resulting in smaller, more accurate, and cost-effective sensors are also crucial drivers. While material availability and supply chain complexities might pose challenges, ongoing research and development initiatives focus on improving sensor durability and performance, mitigating these restraints. Market segmentation reveals that the automotive sector currently holds a significant market share among end-users, although the healthcare and industrial segments are exhibiting faster growth rates due to increased applications in medical devices and industrial automation respectively. Silicon remains the dominant material, however, the adoption of ceramic and other advanced materials is gradually increasing to cater to the diverse application requirements for high-temperature and high-pressure environments. Geographical analysis shows a strong presence in North America and Europe, however, the Asia-Pacific region is anticipated to witness the most significant growth in the coming years owing to rapid industrialization and infrastructure development.
The competitive landscape is characterized by a mix of established players like Honeywell and Emerson, alongside smaller, specialized companies focused on niche applications. This diverse vendor base fosters innovation and ensures the availability of a wide range of solutions to meet specific industry needs. The market is expected to see further consolidation and strategic partnerships as companies strive to expand their product portfolios and geographic reach. The ongoing focus on miniaturization, improved accuracy, and enhanced sensor integration within larger systems will continue to shape market dynamics. The long-term outlook for the piezoresistive pressure sensor market remains positive, driven by continuous technological advancements and a growing need for precise pressure sensing across multiple sectors.
Piezoresistive Pressure Sensor Industry Market Report: 2019-2033
This comprehensive report provides an in-depth analysis of the global piezoresistive pressure sensor market, offering invaluable insights for industry professionals, investors, and strategic decision-makers. Covering the period from 2019 to 2033, with 2025 as the base year, this report meticulously examines market dynamics, growth trends, regional dominance, and the competitive landscape. The report segments the market by material (Silicon, Ceramic, Other Materials) and end-user (Automotive, Healthcare, Industrial, Oil and Gas, Other End Users), providing granular analysis to understand market nuances and opportunities. The total market size is projected to reach xx Million units by 2033.
Piezoresistive Pressure Sensor Industry Market Dynamics & Structure
The piezoresistive pressure sensor market is characterized by moderate concentration, with key players holding significant market share. Technological innovation, driven by the demand for higher accuracy, miniaturization, and improved durability, is a primary growth driver. Stringent regulatory frameworks, particularly in industries like automotive and healthcare, influence sensor design and manufacturing. Competitive pressure from alternative sensing technologies (e.g., capacitive, optical) necessitates continuous product improvement. The market also witnesses ongoing M&A activity, with larger players acquiring smaller companies to expand their product portfolios and market reach.
- Market Concentration: The top 5 players hold approximately xx% of the market share in 2025.
- Technological Innovation: Focus on MEMS technology, improved signal processing, and enhanced temperature compensation.
- Regulatory Landscape: Compliance with safety and performance standards (e.g., ISO, IEC) is crucial.
- Competitive Substitutes: Capacitive and optical sensors pose a significant competitive challenge.
- M&A Activity: An average of xx M&A deals per year were recorded between 2019 and 2024.
- End-User Demographics: The automotive and industrial sectors represent the largest end-user segments.
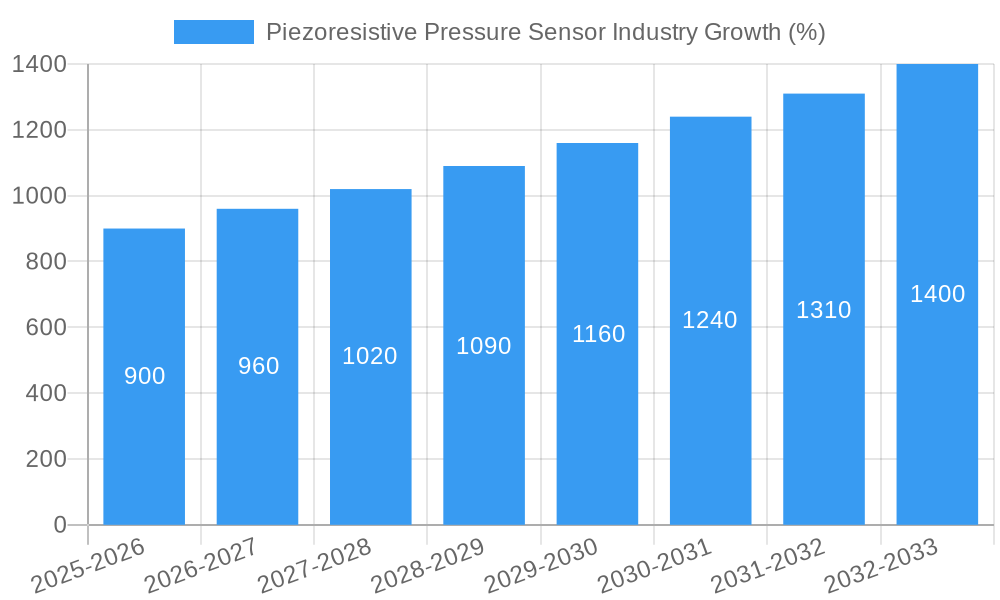
Piezoresistive Pressure Sensor Industry Growth Trends & Insights
The global piezoresistive pressure sensor market experienced significant growth between 2019 and 2024, driven by factors such as increasing automation across various industries, advancements in medical technology, and rising demand for precise pressure measurement in diverse applications. The market witnessed a CAGR of xx% during the historical period (2019-2024) and is projected to maintain a healthy CAGR of xx% during the forecast period (2025-2033). This growth is fueled by technological advancements such as the integration of smart sensors, improved signal processing capabilities, and the development of cost-effective manufacturing processes. Increased adoption across emerging economies, driven by infrastructure development and industrialization, further contributes to market expansion. Consumer behavior shifts towards smart and connected devices are also impacting demand for miniature and highly reliable pressure sensors. Market penetration in certain niche applications remains relatively low, presenting substantial growth opportunities.
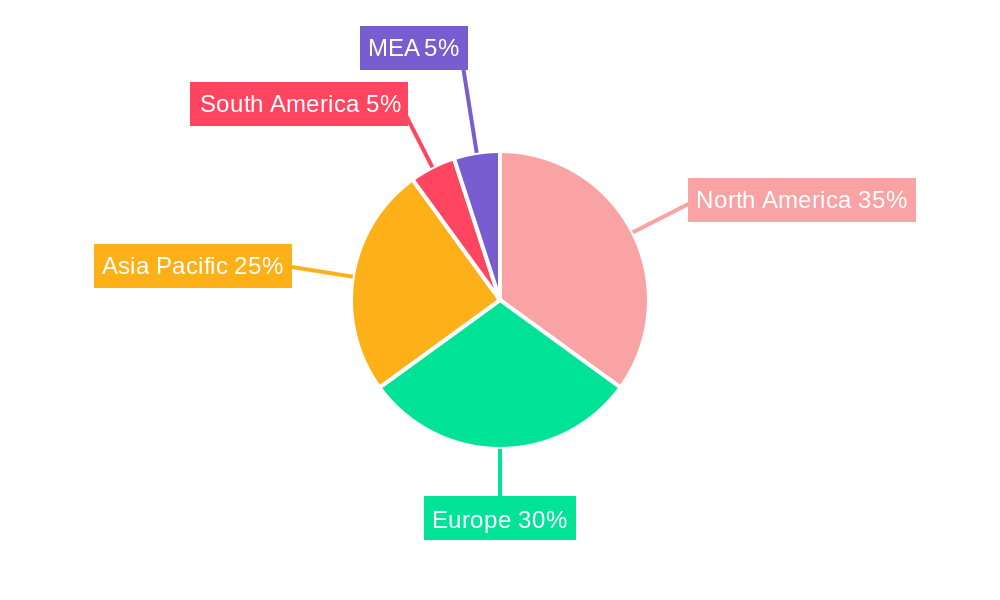
Dominant Regions, Countries, or Segments in Piezoresistive Pressure Sensor Industry
North America and Europe currently dominate the piezoresistive pressure sensor market, driven by strong technological advancements, robust industrial infrastructure, and high adoption rates across various sectors. Within these regions, specific countries such as the United States and Germany are leading the market due to significant investments in R&D and a large established manufacturing base. However, the Asia-Pacific region exhibits substantial growth potential, fueled by rapid industrialization, rising disposable incomes, and expanding automotive and healthcare sectors. The silicon-based sensor segment holds the largest market share due to its superior performance characteristics and cost-effectiveness. In terms of end-users, the automotive industry is the dominant segment, with substantial demand for pressure sensors in engine management systems, tire pressure monitoring systems (TPMS), and braking systems.
- Key Drivers in North America: Strong R&D investment, well-established automotive and industrial sectors.
- Key Drivers in Europe: High adoption of advanced technologies, stringent regulatory frameworks.
- Key Drivers in Asia-Pacific: Rapid industrialization, growing automotive and healthcare markets.
- Dominant Material Segment: Silicon, due to its cost-effectiveness and performance characteristics.
- Dominant End-User Segment: Automotive, driven by TPMS and engine management systems.
Piezoresistive Pressure Sensor Industry Product Landscape
Piezoresistive pressure sensors are available in various configurations, ranging from simple diaphragm-based sensors to highly sophisticated integrated circuits incorporating advanced signal processing capabilities. Recent product innovations focus on miniaturization, enhanced accuracy, improved temperature stability, and increased durability. These advancements cater to the needs of diverse applications, ranging from medical devices and automotive systems to industrial automation and aerospace. Unique selling propositions include high resolution, wide pressure ranges, and long-term stability. Technological advancements such as MEMS fabrication techniques and advanced signal conditioning circuits continue to drive product innovation.
Key Drivers, Barriers & Challenges in Piezoresistive Pressure Sensor Industry
Key Drivers: Increasing automation across industries, stringent emission regulations in the automotive sector, and the growing adoption of IoT and smart devices are significant drivers of market growth. Advancements in MEMS technology and the development of cost-effective manufacturing processes also contribute to market expansion.
Key Challenges: Supply chain disruptions, fluctuating raw material prices, and intense competition from alternative sensing technologies present key challenges. Regulatory hurdles and the need for high levels of sensor accuracy in various applications also pose barriers. For example, the impact of supply chain disruptions in 2022 led to a xx% decrease in production capacity for some manufacturers.
Emerging Opportunities in Piezoresistive Pressure Sensor Industry
Emerging opportunities lie in the development of highly integrated, low-power sensors for portable and wearable medical devices. The expanding smart home and industrial IoT sectors present significant opportunities for miniaturized pressure sensors with wireless communication capabilities. Further growth potential exists in niche applications such as environmental monitoring, precision agriculture, and advanced robotics.
Growth Accelerators in the Piezoresistive Pressure Sensor Industry Industry
Long-term growth will be fueled by ongoing technological advancements in MEMS technology, leading to smaller, more accurate, and energy-efficient sensors. Strategic partnerships between sensor manufacturers and system integrators will also play a critical role in expanding market penetration. Market expansion into emerging economies with growing industrial sectors presents significant opportunities for growth.
Key Players Shaping the Piezoresistive Pressure Sensor Industry Market
- Honeywell International Inc
- First Sensor AG
- Ninghai Sendo Sensor Co Ltd
- Kistler Group
- BCM Sensor Technologies BVBA
- Metallux SA
- Impress Sensors and Systems Ltd
- BD Sensors GmBH
- Pewatron AG
- All Sensors Corporation
- Rosemount Inc (Emerson Electric Company)
Notable Milestones in Piezoresistive Pressure Sensor Industry Sector
- 2020: Honeywell launches a new line of highly accurate MEMS pressure sensors for automotive applications.
- 2022: First Sensor AG acquires a smaller sensor company, expanding its product portfolio.
- 2023: Significant investment in R&D for next-generation piezoresistive pressure sensor technology. (xx Million units)
In-Depth Piezoresistive Pressure Sensor Industry Market Outlook
The future of the piezoresistive pressure sensor market is bright, driven by continuous technological innovation, the growing adoption of IoT, and the expanding demand for precise pressure measurement across diverse industries. Strategic investments in R&D, coupled with strategic partnerships and market expansion into new sectors, will play a crucial role in driving long-term growth. The market is poised for substantial expansion, with significant potential in emerging economies and niche applications.
Piezoresistive Pressure Sensor Industry Segmentation
-
1. Material
- 1.1. Silicon
- 1.2. Ceramic
- 1.3. Other Materials
-
2. End User
- 2.1. Automotive
- 2.2. Healthcare
- 2.3. Industrial
- 2.4. Oil and Gas
- 2.5. Other End Users
Piezoresistive Pressure Sensor Industry Segmentation By Geography
- 1. North America
- 2. Europe
- 3. Asia Pacific
- 4. Latin America
- 5. Middle East and Africa
Piezoresistive Pressure Sensor Industry REPORT HIGHLIGHTS
| Aspects | Details |
|---|---|
| Study Period | 2019-2033 |
| Base Year | 2024 |
| Estimated Year | 2025 |
| Forecast Period | 2025-2033 |
| Historical Period | 2019-2024 |
| Growth Rate | CAGR of 5.80% from 2019-2033 |
| Segmentation |
|
Table of Contents
- 1. Introduction
- 1.1. Research Scope
- 1.2. Market Segmentation
- 1.3. Research Methodology
- 1.4. Definitions and Assumptions
- 2. Executive Summary
- 2.1. Introduction
- 3. Market Dynamics
- 3.1. Introduction
- 3.2. Market Drivers
- 3.2.1. ; Rising Emphasis on Miniaturization of Equipment; Need for Robust Design and Enhanced Performance in Rugged Environment
- 3.3. Market Restrains
- 3.3.1. ; Technical Issues associated with the involvement of Smaller Components
- 3.4. Market Trends
- 3.4.1. Automotive Industry is Expected to Significantly Drive the Market Growth
- 4. Market Factor Analysis
- 4.1. Porters Five Forces
- 4.2. Supply/Value Chain
- 4.3. PESTEL analysis
- 4.4. Market Entropy
- 4.5. Patent/Trademark Analysis
- 5. Global Piezoresistive Pressure Sensor Industry Analysis, Insights and Forecast, 2019-2031
- 5.1. Market Analysis, Insights and Forecast - by Material
- 5.1.1. Silicon
- 5.1.2. Ceramic
- 5.1.3. Other Materials
- 5.2. Market Analysis, Insights and Forecast - by End User
- 5.2.1. Automotive
- 5.2.2. Healthcare
- 5.2.3. Industrial
- 5.2.4. Oil and Gas
- 5.2.5. Other End Users
- 5.3. Market Analysis, Insights and Forecast - by Region
- 5.3.1. North America
- 5.3.2. Europe
- 5.3.3. Asia Pacific
- 5.3.4. Latin America
- 5.3.5. Middle East and Africa
- 5.1. Market Analysis, Insights and Forecast - by Material
- 6. North America Piezoresistive Pressure Sensor Industry Analysis, Insights and Forecast, 2019-2031
- 6.1. Market Analysis, Insights and Forecast - by Material
- 6.1.1. Silicon
- 6.1.2. Ceramic
- 6.1.3. Other Materials
- 6.2. Market Analysis, Insights and Forecast - by End User
- 6.2.1. Automotive
- 6.2.2. Healthcare
- 6.2.3. Industrial
- 6.2.4. Oil and Gas
- 6.2.5. Other End Users
- 6.1. Market Analysis, Insights and Forecast - by Material
- 7. Europe Piezoresistive Pressure Sensor Industry Analysis, Insights and Forecast, 2019-2031
- 7.1. Market Analysis, Insights and Forecast - by Material
- 7.1.1. Silicon
- 7.1.2. Ceramic
- 7.1.3. Other Materials
- 7.2. Market Analysis, Insights and Forecast - by End User
- 7.2.1. Automotive
- 7.2.2. Healthcare
- 7.2.3. Industrial
- 7.2.4. Oil and Gas
- 7.2.5. Other End Users
- 7.1. Market Analysis, Insights and Forecast - by Material
- 8. Asia Pacific Piezoresistive Pressure Sensor Industry Analysis, Insights and Forecast, 2019-2031
- 8.1. Market Analysis, Insights and Forecast - by Material
- 8.1.1. Silicon
- 8.1.2. Ceramic
- 8.1.3. Other Materials
- 8.2. Market Analysis, Insights and Forecast - by End User
- 8.2.1. Automotive
- 8.2.2. Healthcare
- 8.2.3. Industrial
- 8.2.4. Oil and Gas
- 8.2.5. Other End Users
- 8.1. Market Analysis, Insights and Forecast - by Material
- 9. Latin America Piezoresistive Pressure Sensor Industry Analysis, Insights and Forecast, 2019-2031
- 9.1. Market Analysis, Insights and Forecast - by Material
- 9.1.1. Silicon
- 9.1.2. Ceramic
- 9.1.3. Other Materials
- 9.2. Market Analysis, Insights and Forecast - by End User
- 9.2.1. Automotive
- 9.2.2. Healthcare
- 9.2.3. Industrial
- 9.2.4. Oil and Gas
- 9.2.5. Other End Users
- 9.1. Market Analysis, Insights and Forecast - by Material
- 10. Middle East and Africa Piezoresistive Pressure Sensor Industry Analysis, Insights and Forecast, 2019-2031
- 10.1. Market Analysis, Insights and Forecast - by Material
- 10.1.1. Silicon
- 10.1.2. Ceramic
- 10.1.3. Other Materials
- 10.2. Market Analysis, Insights and Forecast - by End User
- 10.2.1. Automotive
- 10.2.2. Healthcare
- 10.2.3. Industrial
- 10.2.4. Oil and Gas
- 10.2.5. Other End Users
- 10.1. Market Analysis, Insights and Forecast - by Material
- 11. North America Piezoresistive Pressure Sensor Industry Analysis, Insights and Forecast, 2019-2031
- 11.1. Market Analysis, Insights and Forecast - By Country/Sub-region
- 11.1.1 United States
- 11.1.2 Canada
- 11.1.3 Mexico
- 12. Europe Piezoresistive Pressure Sensor Industry Analysis, Insights and Forecast, 2019-2031
- 12.1. Market Analysis, Insights and Forecast - By Country/Sub-region
- 12.1.1 Germany
- 12.1.2 United Kingdom
- 12.1.3 France
- 12.1.4 Spain
- 12.1.5 Italy
- 12.1.6 Spain
- 12.1.7 Belgium
- 12.1.8 Netherland
- 12.1.9 Nordics
- 12.1.10 Rest of Europe
- 13. Asia Pacific Piezoresistive Pressure Sensor Industry Analysis, Insights and Forecast, 2019-2031
- 13.1. Market Analysis, Insights and Forecast - By Country/Sub-region
- 13.1.1 China
- 13.1.2 Japan
- 13.1.3 India
- 13.1.4 South Korea
- 13.1.5 Southeast Asia
- 13.1.6 Australia
- 13.1.7 Indonesia
- 13.1.8 Phillipes
- 13.1.9 Singapore
- 13.1.10 Thailandc
- 13.1.11 Rest of Asia Pacific
- 14. South America Piezoresistive Pressure Sensor Industry Analysis, Insights and Forecast, 2019-2031
- 14.1. Market Analysis, Insights and Forecast - By Country/Sub-region
- 14.1.1 Brazil
- 14.1.2 Argentina
- 14.1.3 Peru
- 14.1.4 Chile
- 14.1.5 Colombia
- 14.1.6 Ecuador
- 14.1.7 Venezuela
- 14.1.8 Rest of South America
- 15. North America Piezoresistive Pressure Sensor Industry Analysis, Insights and Forecast, 2019-2031
- 15.1. Market Analysis, Insights and Forecast - By Country/Sub-region
- 15.1.1 United States
- 15.1.2 Canada
- 15.1.3 Mexico
- 16. MEA Piezoresistive Pressure Sensor Industry Analysis, Insights and Forecast, 2019-2031
- 16.1. Market Analysis, Insights and Forecast - By Country/Sub-region
- 16.1.1 United Arab Emirates
- 16.1.2 Saudi Arabia
- 16.1.3 South Africa
- 16.1.4 Rest of Middle East and Africa
- 17. Competitive Analysis
- 17.1. Global Market Share Analysis 2024
- 17.2. Company Profiles
- 17.2.1 Honeywell International Inc
- 17.2.1.1. Overview
- 17.2.1.2. Products
- 17.2.1.3. SWOT Analysis
- 17.2.1.4. Recent Developments
- 17.2.1.5. Financials (Based on Availability)
- 17.2.2 First Sensor AG
- 17.2.2.1. Overview
- 17.2.2.2. Products
- 17.2.2.3. SWOT Analysis
- 17.2.2.4. Recent Developments
- 17.2.2.5. Financials (Based on Availability)
- 17.2.3 Ninghai Sendo Sensor Co Ltd
- 17.2.3.1. Overview
- 17.2.3.2. Products
- 17.2.3.3. SWOT Analysis
- 17.2.3.4. Recent Developments
- 17.2.3.5. Financials (Based on Availability)
- 17.2.4 Kistler Group
- 17.2.4.1. Overview
- 17.2.4.2. Products
- 17.2.4.3. SWOT Analysis
- 17.2.4.4. Recent Developments
- 17.2.4.5. Financials (Based on Availability)
- 17.2.5 BCM Sensor Technologies BVBA
- 17.2.5.1. Overview
- 17.2.5.2. Products
- 17.2.5.3. SWOT Analysis
- 17.2.5.4. Recent Developments
- 17.2.5.5. Financials (Based on Availability)
- 17.2.6 Metallux SA
- 17.2.6.1. Overview
- 17.2.6.2. Products
- 17.2.6.3. SWOT Analysis
- 17.2.6.4. Recent Developments
- 17.2.6.5. Financials (Based on Availability)
- 17.2.7 Impress Sensors and Systems Ltd
- 17.2.7.1. Overview
- 17.2.7.2. Products
- 17.2.7.3. SWOT Analysis
- 17.2.7.4. Recent Developments
- 17.2.7.5. Financials (Based on Availability)
- 17.2.8 BD Sensors GmBH
- 17.2.8.1. Overview
- 17.2.8.2. Products
- 17.2.8.3. SWOT Analysis
- 17.2.8.4. Recent Developments
- 17.2.8.5. Financials (Based on Availability)
- 17.2.9 Pewatron AG
- 17.2.9.1. Overview
- 17.2.9.2. Products
- 17.2.9.3. SWOT Analysis
- 17.2.9.4. Recent Developments
- 17.2.9.5. Financials (Based on Availability)
- 17.2.10 All Sensors Corporation
- 17.2.10.1. Overview
- 17.2.10.2. Products
- 17.2.10.3. SWOT Analysis
- 17.2.10.4. Recent Developments
- 17.2.10.5. Financials (Based on Availability)
- 17.2.11 Rosemount Inc (Emerson Electric Company)
- 17.2.11.1. Overview
- 17.2.11.2. Products
- 17.2.11.3. SWOT Analysis
- 17.2.11.4. Recent Developments
- 17.2.11.5. Financials (Based on Availability)
- 17.2.1 Honeywell International Inc
List of Figures
- Figure 1: Global Piezoresistive Pressure Sensor Industry Revenue Breakdown (Million, %) by Region 2024 & 2032
- Figure 2: Global Piezoresistive Pressure Sensor Industry Volume Breakdown (K Unit, %) by Region 2024 & 2032
- Figure 3: North America Piezoresistive Pressure Sensor Industry Revenue (Million), by Country 2024 & 2032
- Figure 4: North America Piezoresistive Pressure Sensor Industry Volume (K Unit), by Country 2024 & 2032
- Figure 5: North America Piezoresistive Pressure Sensor Industry Revenue Share (%), by Country 2024 & 2032
- Figure 6: North America Piezoresistive Pressure Sensor Industry Volume Share (%), by Country 2024 & 2032
- Figure 7: Europe Piezoresistive Pressure Sensor Industry Revenue (Million), by Country 2024 & 2032
- Figure 8: Europe Piezoresistive Pressure Sensor Industry Volume (K Unit), by Country 2024 & 2032
- Figure 9: Europe Piezoresistive Pressure Sensor Industry Revenue Share (%), by Country 2024 & 2032
- Figure 10: Europe Piezoresistive Pressure Sensor Industry Volume Share (%), by Country 2024 & 2032
- Figure 11: Asia Pacific Piezoresistive Pressure Sensor Industry Revenue (Million), by Country 2024 & 2032
- Figure 12: Asia Pacific Piezoresistive Pressure Sensor Industry Volume (K Unit), by Country 2024 & 2032
- Figure 13: Asia Pacific Piezoresistive Pressure Sensor Industry Revenue Share (%), by Country 2024 & 2032
- Figure 14: Asia Pacific Piezoresistive Pressure Sensor Industry Volume Share (%), by Country 2024 & 2032
- Figure 15: South America Piezoresistive Pressure Sensor Industry Revenue (Million), by Country 2024 & 2032
- Figure 16: South America Piezoresistive Pressure Sensor Industry Volume (K Unit), by Country 2024 & 2032
- Figure 17: South America Piezoresistive Pressure Sensor Industry Revenue Share (%), by Country 2024 & 2032
- Figure 18: South America Piezoresistive Pressure Sensor Industry Volume Share (%), by Country 2024 & 2032
- Figure 19: North America Piezoresistive Pressure Sensor Industry Revenue (Million), by Country 2024 & 2032
- Figure 20: North America Piezoresistive Pressure Sensor Industry Volume (K Unit), by Country 2024 & 2032
- Figure 21: North America Piezoresistive Pressure Sensor Industry Revenue Share (%), by Country 2024 & 2032
- Figure 22: North America Piezoresistive Pressure Sensor Industry Volume Share (%), by Country 2024 & 2032
- Figure 23: MEA Piezoresistive Pressure Sensor Industry Revenue (Million), by Country 2024 & 2032
- Figure 24: MEA Piezoresistive Pressure Sensor Industry Volume (K Unit), by Country 2024 & 2032
- Figure 25: MEA Piezoresistive Pressure Sensor Industry Revenue Share (%), by Country 2024 & 2032
- Figure 26: MEA Piezoresistive Pressure Sensor Industry Volume Share (%), by Country 2024 & 2032
- Figure 27: North America Piezoresistive Pressure Sensor Industry Revenue (Million), by Material 2024 & 2032
- Figure 28: North America Piezoresistive Pressure Sensor Industry Volume (K Unit), by Material 2024 & 2032
- Figure 29: North America Piezoresistive Pressure Sensor Industry Revenue Share (%), by Material 2024 & 2032
- Figure 30: North America Piezoresistive Pressure Sensor Industry Volume Share (%), by Material 2024 & 2032
- Figure 31: North America Piezoresistive Pressure Sensor Industry Revenue (Million), by End User 2024 & 2032
- Figure 32: North America Piezoresistive Pressure Sensor Industry Volume (K Unit), by End User 2024 & 2032
- Figure 33: North America Piezoresistive Pressure Sensor Industry Revenue Share (%), by End User 2024 & 2032
- Figure 34: North America Piezoresistive Pressure Sensor Industry Volume Share (%), by End User 2024 & 2032
- Figure 35: North America Piezoresistive Pressure Sensor Industry Revenue (Million), by Country 2024 & 2032
- Figure 36: North America Piezoresistive Pressure Sensor Industry Volume (K Unit), by Country 2024 & 2032
- Figure 37: North America Piezoresistive Pressure Sensor Industry Revenue Share (%), by Country 2024 & 2032
- Figure 38: North America Piezoresistive Pressure Sensor Industry Volume Share (%), by Country 2024 & 2032
- Figure 39: Europe Piezoresistive Pressure Sensor Industry Revenue (Million), by Material 2024 & 2032
- Figure 40: Europe Piezoresistive Pressure Sensor Industry Volume (K Unit), by Material 2024 & 2032
- Figure 41: Europe Piezoresistive Pressure Sensor Industry Revenue Share (%), by Material 2024 & 2032
- Figure 42: Europe Piezoresistive Pressure Sensor Industry Volume Share (%), by Material 2024 & 2032
- Figure 43: Europe Piezoresistive Pressure Sensor Industry Revenue (Million), by End User 2024 & 2032
- Figure 44: Europe Piezoresistive Pressure Sensor Industry Volume (K Unit), by End User 2024 & 2032
- Figure 45: Europe Piezoresistive Pressure Sensor Industry Revenue Share (%), by End User 2024 & 2032
- Figure 46: Europe Piezoresistive Pressure Sensor Industry Volume Share (%), by End User 2024 & 2032
- Figure 47: Europe Piezoresistive Pressure Sensor Industry Revenue (Million), by Country 2024 & 2032
- Figure 48: Europe Piezoresistive Pressure Sensor Industry Volume (K Unit), by Country 2024 & 2032
- Figure 49: Europe Piezoresistive Pressure Sensor Industry Revenue Share (%), by Country 2024 & 2032
- Figure 50: Europe Piezoresistive Pressure Sensor Industry Volume Share (%), by Country 2024 & 2032
- Figure 51: Asia Pacific Piezoresistive Pressure Sensor Industry Revenue (Million), by Material 2024 & 2032
- Figure 52: Asia Pacific Piezoresistive Pressure Sensor Industry Volume (K Unit), by Material 2024 & 2032
- Figure 53: Asia Pacific Piezoresistive Pressure Sensor Industry Revenue Share (%), by Material 2024 & 2032
- Figure 54: Asia Pacific Piezoresistive Pressure Sensor Industry Volume Share (%), by Material 2024 & 2032
- Figure 55: Asia Pacific Piezoresistive Pressure Sensor Industry Revenue (Million), by End User 2024 & 2032
- Figure 56: Asia Pacific Piezoresistive Pressure Sensor Industry Volume (K Unit), by End User 2024 & 2032
- Figure 57: Asia Pacific Piezoresistive Pressure Sensor Industry Revenue Share (%), by End User 2024 & 2032
- Figure 58: Asia Pacific Piezoresistive Pressure Sensor Industry Volume Share (%), by End User 2024 & 2032
- Figure 59: Asia Pacific Piezoresistive Pressure Sensor Industry Revenue (Million), by Country 2024 & 2032
- Figure 60: Asia Pacific Piezoresistive Pressure Sensor Industry Volume (K Unit), by Country 2024 & 2032
- Figure 61: Asia Pacific Piezoresistive Pressure Sensor Industry Revenue Share (%), by Country 2024 & 2032
- Figure 62: Asia Pacific Piezoresistive Pressure Sensor Industry Volume Share (%), by Country 2024 & 2032
- Figure 63: Latin America Piezoresistive Pressure Sensor Industry Revenue (Million), by Material 2024 & 2032
- Figure 64: Latin America Piezoresistive Pressure Sensor Industry Volume (K Unit), by Material 2024 & 2032
- Figure 65: Latin America Piezoresistive Pressure Sensor Industry Revenue Share (%), by Material 2024 & 2032
- Figure 66: Latin America Piezoresistive Pressure Sensor Industry Volume Share (%), by Material 2024 & 2032
- Figure 67: Latin America Piezoresistive Pressure Sensor Industry Revenue (Million), by End User 2024 & 2032
- Figure 68: Latin America Piezoresistive Pressure Sensor Industry Volume (K Unit), by End User 2024 & 2032
- Figure 69: Latin America Piezoresistive Pressure Sensor Industry Revenue Share (%), by End User 2024 & 2032
- Figure 70: Latin America Piezoresistive Pressure Sensor Industry Volume Share (%), by End User 2024 & 2032
- Figure 71: Latin America Piezoresistive Pressure Sensor Industry Revenue (Million), by Country 2024 & 2032
- Figure 72: Latin America Piezoresistive Pressure Sensor Industry Volume (K Unit), by Country 2024 & 2032
- Figure 73: Latin America Piezoresistive Pressure Sensor Industry Revenue Share (%), by Country 2024 & 2032
- Figure 74: Latin America Piezoresistive Pressure Sensor Industry Volume Share (%), by Country 2024 & 2032
- Figure 75: Middle East and Africa Piezoresistive Pressure Sensor Industry Revenue (Million), by Material 2024 & 2032
- Figure 76: Middle East and Africa Piezoresistive Pressure Sensor Industry Volume (K Unit), by Material 2024 & 2032
- Figure 77: Middle East and Africa Piezoresistive Pressure Sensor Industry Revenue Share (%), by Material 2024 & 2032
- Figure 78: Middle East and Africa Piezoresistive Pressure Sensor Industry Volume Share (%), by Material 2024 & 2032
- Figure 79: Middle East and Africa Piezoresistive Pressure Sensor Industry Revenue (Million), by End User 2024 & 2032
- Figure 80: Middle East and Africa Piezoresistive Pressure Sensor Industry Volume (K Unit), by End User 2024 & 2032
- Figure 81: Middle East and Africa Piezoresistive Pressure Sensor Industry Revenue Share (%), by End User 2024 & 2032
- Figure 82: Middle East and Africa Piezoresistive Pressure Sensor Industry Volume Share (%), by End User 2024 & 2032
- Figure 83: Middle East and Africa Piezoresistive Pressure Sensor Industry Revenue (Million), by Country 2024 & 2032
- Figure 84: Middle East and Africa Piezoresistive Pressure Sensor Industry Volume (K Unit), by Country 2024 & 2032
- Figure 85: Middle East and Africa Piezoresistive Pressure Sensor Industry Revenue Share (%), by Country 2024 & 2032
- Figure 86: Middle East and Africa Piezoresistive Pressure Sensor Industry Volume Share (%), by Country 2024 & 2032
List of Tables
- Table 1: Global Piezoresistive Pressure Sensor Industry Revenue Million Forecast, by Region 2019 & 2032
- Table 2: Global Piezoresistive Pressure Sensor Industry Volume K Unit Forecast, by Region 2019 & 2032
- Table 3: Global Piezoresistive Pressure Sensor Industry Revenue Million Forecast, by Material 2019 & 2032
- Table 4: Global Piezoresistive Pressure Sensor Industry Volume K Unit Forecast, by Material 2019 & 2032
- Table 5: Global Piezoresistive Pressure Sensor Industry Revenue Million Forecast, by End User 2019 & 2032
- Table 6: Global Piezoresistive Pressure Sensor Industry Volume K Unit Forecast, by End User 2019 & 2032
- Table 7: Global Piezoresistive Pressure Sensor Industry Revenue Million Forecast, by Region 2019 & 2032
- Table 8: Global Piezoresistive Pressure Sensor Industry Volume K Unit Forecast, by Region 2019 & 2032
- Table 9: Global Piezoresistive Pressure Sensor Industry Revenue Million Forecast, by Country 2019 & 2032
- Table 10: Global Piezoresistive Pressure Sensor Industry Volume K Unit Forecast, by Country 2019 & 2032
- Table 11: United States Piezoresistive Pressure Sensor Industry Revenue (Million) Forecast, by Application 2019 & 2032
- Table 12: United States Piezoresistive Pressure Sensor Industry Volume (K Unit) Forecast, by Application 2019 & 2032
- Table 13: Canada Piezoresistive Pressure Sensor Industry Revenue (Million) Forecast, by Application 2019 & 2032
- Table 14: Canada Piezoresistive Pressure Sensor Industry Volume (K Unit) Forecast, by Application 2019 & 2032
- Table 15: Mexico Piezoresistive Pressure Sensor Industry Revenue (Million) Forecast, by Application 2019 & 2032
- Table 16: Mexico Piezoresistive Pressure Sensor Industry Volume (K Unit) Forecast, by Application 2019 & 2032
- Table 17: Global Piezoresistive Pressure Sensor Industry Revenue Million Forecast, by Country 2019 & 2032
- Table 18: Global Piezoresistive Pressure Sensor Industry Volume K Unit Forecast, by Country 2019 & 2032
- Table 19: Germany Piezoresistive Pressure Sensor Industry Revenue (Million) Forecast, by Application 2019 & 2032
- Table 20: Germany Piezoresistive Pressure Sensor Industry Volume (K Unit) Forecast, by Application 2019 & 2032
- Table 21: United Kingdom Piezoresistive Pressure Sensor Industry Revenue (Million) Forecast, by Application 2019 & 2032
- Table 22: United Kingdom Piezoresistive Pressure Sensor Industry Volume (K Unit) Forecast, by Application 2019 & 2032
- Table 23: France Piezoresistive Pressure Sensor Industry Revenue (Million) Forecast, by Application 2019 & 2032
- Table 24: France Piezoresistive Pressure Sensor Industry Volume (K Unit) Forecast, by Application 2019 & 2032
- Table 25: Spain Piezoresistive Pressure Sensor Industry Revenue (Million) Forecast, by Application 2019 & 2032
- Table 26: Spain Piezoresistive Pressure Sensor Industry Volume (K Unit) Forecast, by Application 2019 & 2032
- Table 27: Italy Piezoresistive Pressure Sensor Industry Revenue (Million) Forecast, by Application 2019 & 2032
- Table 28: Italy Piezoresistive Pressure Sensor Industry Volume (K Unit) Forecast, by Application 2019 & 2032
- Table 29: Spain Piezoresistive Pressure Sensor Industry Revenue (Million) Forecast, by Application 2019 & 2032
- Table 30: Spain Piezoresistive Pressure Sensor Industry Volume (K Unit) Forecast, by Application 2019 & 2032
- Table 31: Belgium Piezoresistive Pressure Sensor Industry Revenue (Million) Forecast, by Application 2019 & 2032
- Table 32: Belgium Piezoresistive Pressure Sensor Industry Volume (K Unit) Forecast, by Application 2019 & 2032
- Table 33: Netherland Piezoresistive Pressure Sensor Industry Revenue (Million) Forecast, by Application 2019 & 2032
- Table 34: Netherland Piezoresistive Pressure Sensor Industry Volume (K Unit) Forecast, by Application 2019 & 2032
- Table 35: Nordics Piezoresistive Pressure Sensor Industry Revenue (Million) Forecast, by Application 2019 & 2032
- Table 36: Nordics Piezoresistive Pressure Sensor Industry Volume (K Unit) Forecast, by Application 2019 & 2032
- Table 37: Rest of Europe Piezoresistive Pressure Sensor Industry Revenue (Million) Forecast, by Application 2019 & 2032
- Table 38: Rest of Europe Piezoresistive Pressure Sensor Industry Volume (K Unit) Forecast, by Application 2019 & 2032
- Table 39: Global Piezoresistive Pressure Sensor Industry Revenue Million Forecast, by Country 2019 & 2032
- Table 40: Global Piezoresistive Pressure Sensor Industry Volume K Unit Forecast, by Country 2019 & 2032
- Table 41: China Piezoresistive Pressure Sensor Industry Revenue (Million) Forecast, by Application 2019 & 2032
- Table 42: China Piezoresistive Pressure Sensor Industry Volume (K Unit) Forecast, by Application 2019 & 2032
- Table 43: Japan Piezoresistive Pressure Sensor Industry Revenue (Million) Forecast, by Application 2019 & 2032
- Table 44: Japan Piezoresistive Pressure Sensor Industry Volume (K Unit) Forecast, by Application 2019 & 2032
- Table 45: India Piezoresistive Pressure Sensor Industry Revenue (Million) Forecast, by Application 2019 & 2032
- Table 46: India Piezoresistive Pressure Sensor Industry Volume (K Unit) Forecast, by Application 2019 & 2032
- Table 47: South Korea Piezoresistive Pressure Sensor Industry Revenue (Million) Forecast, by Application 2019 & 2032
- Table 48: South Korea Piezoresistive Pressure Sensor Industry Volume (K Unit) Forecast, by Application 2019 & 2032
- Table 49: Southeast Asia Piezoresistive Pressure Sensor Industry Revenue (Million) Forecast, by Application 2019 & 2032
- Table 50: Southeast Asia Piezoresistive Pressure Sensor Industry Volume (K Unit) Forecast, by Application 2019 & 2032
- Table 51: Australia Piezoresistive Pressure Sensor Industry Revenue (Million) Forecast, by Application 2019 & 2032
- Table 52: Australia Piezoresistive Pressure Sensor Industry Volume (K Unit) Forecast, by Application 2019 & 2032
- Table 53: Indonesia Piezoresistive Pressure Sensor Industry Revenue (Million) Forecast, by Application 2019 & 2032
- Table 54: Indonesia Piezoresistive Pressure Sensor Industry Volume (K Unit) Forecast, by Application 2019 & 2032
- Table 55: Phillipes Piezoresistive Pressure Sensor Industry Revenue (Million) Forecast, by Application 2019 & 2032
- Table 56: Phillipes Piezoresistive Pressure Sensor Industry Volume (K Unit) Forecast, by Application 2019 & 2032
- Table 57: Singapore Piezoresistive Pressure Sensor Industry Revenue (Million) Forecast, by Application 2019 & 2032
- Table 58: Singapore Piezoresistive Pressure Sensor Industry Volume (K Unit) Forecast, by Application 2019 & 2032
- Table 59: Thailandc Piezoresistive Pressure Sensor Industry Revenue (Million) Forecast, by Application 2019 & 2032
- Table 60: Thailandc Piezoresistive Pressure Sensor Industry Volume (K Unit) Forecast, by Application 2019 & 2032
- Table 61: Rest of Asia Pacific Piezoresistive Pressure Sensor Industry Revenue (Million) Forecast, by Application 2019 & 2032
- Table 62: Rest of Asia Pacific Piezoresistive Pressure Sensor Industry Volume (K Unit) Forecast, by Application 2019 & 2032
- Table 63: Global Piezoresistive Pressure Sensor Industry Revenue Million Forecast, by Country 2019 & 2032
- Table 64: Global Piezoresistive Pressure Sensor Industry Volume K Unit Forecast, by Country 2019 & 2032
- Table 65: Brazil Piezoresistive Pressure Sensor Industry Revenue (Million) Forecast, by Application 2019 & 2032
- Table 66: Brazil Piezoresistive Pressure Sensor Industry Volume (K Unit) Forecast, by Application 2019 & 2032
- Table 67: Argentina Piezoresistive Pressure Sensor Industry Revenue (Million) Forecast, by Application 2019 & 2032
- Table 68: Argentina Piezoresistive Pressure Sensor Industry Volume (K Unit) Forecast, by Application 2019 & 2032
- Table 69: Peru Piezoresistive Pressure Sensor Industry Revenue (Million) Forecast, by Application 2019 & 2032
- Table 70: Peru Piezoresistive Pressure Sensor Industry Volume (K Unit) Forecast, by Application 2019 & 2032
- Table 71: Chile Piezoresistive Pressure Sensor Industry Revenue (Million) Forecast, by Application 2019 & 2032
- Table 72: Chile Piezoresistive Pressure Sensor Industry Volume (K Unit) Forecast, by Application 2019 & 2032
- Table 73: Colombia Piezoresistive Pressure Sensor Industry Revenue (Million) Forecast, by Application 2019 & 2032
- Table 74: Colombia Piezoresistive Pressure Sensor Industry Volume (K Unit) Forecast, by Application 2019 & 2032
- Table 75: Ecuador Piezoresistive Pressure Sensor Industry Revenue (Million) Forecast, by Application 2019 & 2032
- Table 76: Ecuador Piezoresistive Pressure Sensor Industry Volume (K Unit) Forecast, by Application 2019 & 2032
- Table 77: Venezuela Piezoresistive Pressure Sensor Industry Revenue (Million) Forecast, by Application 2019 & 2032
- Table 78: Venezuela Piezoresistive Pressure Sensor Industry Volume (K Unit) Forecast, by Application 2019 & 2032
- Table 79: Rest of South America Piezoresistive Pressure Sensor Industry Revenue (Million) Forecast, by Application 2019 & 2032
- Table 80: Rest of South America Piezoresistive Pressure Sensor Industry Volume (K Unit) Forecast, by Application 2019 & 2032
- Table 81: Global Piezoresistive Pressure Sensor Industry Revenue Million Forecast, by Country 2019 & 2032
- Table 82: Global Piezoresistive Pressure Sensor Industry Volume K Unit Forecast, by Country 2019 & 2032
- Table 83: United States Piezoresistive Pressure Sensor Industry Revenue (Million) Forecast, by Application 2019 & 2032
- Table 84: United States Piezoresistive Pressure Sensor Industry Volume (K Unit) Forecast, by Application 2019 & 2032
- Table 85: Canada Piezoresistive Pressure Sensor Industry Revenue (Million) Forecast, by Application 2019 & 2032
- Table 86: Canada Piezoresistive Pressure Sensor Industry Volume (K Unit) Forecast, by Application 2019 & 2032
- Table 87: Mexico Piezoresistive Pressure Sensor Industry Revenue (Million) Forecast, by Application 2019 & 2032
- Table 88: Mexico Piezoresistive Pressure Sensor Industry Volume (K Unit) Forecast, by Application 2019 & 2032
- Table 89: Global Piezoresistive Pressure Sensor Industry Revenue Million Forecast, by Country 2019 & 2032
- Table 90: Global Piezoresistive Pressure Sensor Industry Volume K Unit Forecast, by Country 2019 & 2032
- Table 91: United Arab Emirates Piezoresistive Pressure Sensor Industry Revenue (Million) Forecast, by Application 2019 & 2032
- Table 92: United Arab Emirates Piezoresistive Pressure Sensor Industry Volume (K Unit) Forecast, by Application 2019 & 2032
- Table 93: Saudi Arabia Piezoresistive Pressure Sensor Industry Revenue (Million) Forecast, by Application 2019 & 2032
- Table 94: Saudi Arabia Piezoresistive Pressure Sensor Industry Volume (K Unit) Forecast, by Application 2019 & 2032
- Table 95: South Africa Piezoresistive Pressure Sensor Industry Revenue (Million) Forecast, by Application 2019 & 2032
- Table 96: South Africa Piezoresistive Pressure Sensor Industry Volume (K Unit) Forecast, by Application 2019 & 2032
- Table 97: Rest of Middle East and Africa Piezoresistive Pressure Sensor Industry Revenue (Million) Forecast, by Application 2019 & 2032
- Table 98: Rest of Middle East and Africa Piezoresistive Pressure Sensor Industry Volume (K Unit) Forecast, by Application 2019 & 2032
- Table 99: Global Piezoresistive Pressure Sensor Industry Revenue Million Forecast, by Material 2019 & 2032
- Table 100: Global Piezoresistive Pressure Sensor Industry Volume K Unit Forecast, by Material 2019 & 2032
- Table 101: Global Piezoresistive Pressure Sensor Industry Revenue Million Forecast, by End User 2019 & 2032
- Table 102: Global Piezoresistive Pressure Sensor Industry Volume K Unit Forecast, by End User 2019 & 2032
- Table 103: Global Piezoresistive Pressure Sensor Industry Revenue Million Forecast, by Country 2019 & 2032
- Table 104: Global Piezoresistive Pressure Sensor Industry Volume K Unit Forecast, by Country 2019 & 2032
- Table 105: Global Piezoresistive Pressure Sensor Industry Revenue Million Forecast, by Material 2019 & 2032
- Table 106: Global Piezoresistive Pressure Sensor Industry Volume K Unit Forecast, by Material 2019 & 2032
- Table 107: Global Piezoresistive Pressure Sensor Industry Revenue Million Forecast, by End User 2019 & 2032
- Table 108: Global Piezoresistive Pressure Sensor Industry Volume K Unit Forecast, by End User 2019 & 2032
- Table 109: Global Piezoresistive Pressure Sensor Industry Revenue Million Forecast, by Country 2019 & 2032
- Table 110: Global Piezoresistive Pressure Sensor Industry Volume K Unit Forecast, by Country 2019 & 2032
- Table 111: Global Piezoresistive Pressure Sensor Industry Revenue Million Forecast, by Material 2019 & 2032
- Table 112: Global Piezoresistive Pressure Sensor Industry Volume K Unit Forecast, by Material 2019 & 2032
- Table 113: Global Piezoresistive Pressure Sensor Industry Revenue Million Forecast, by End User 2019 & 2032
- Table 114: Global Piezoresistive Pressure Sensor Industry Volume K Unit Forecast, by End User 2019 & 2032
- Table 115: Global Piezoresistive Pressure Sensor Industry Revenue Million Forecast, by Country 2019 & 2032
- Table 116: Global Piezoresistive Pressure Sensor Industry Volume K Unit Forecast, by Country 2019 & 2032
- Table 117: Global Piezoresistive Pressure Sensor Industry Revenue Million Forecast, by Material 2019 & 2032
- Table 118: Global Piezoresistive Pressure Sensor Industry Volume K Unit Forecast, by Material 2019 & 2032
- Table 119: Global Piezoresistive Pressure Sensor Industry Revenue Million Forecast, by End User 2019 & 2032
- Table 120: Global Piezoresistive Pressure Sensor Industry Volume K Unit Forecast, by End User 2019 & 2032
- Table 121: Global Piezoresistive Pressure Sensor Industry Revenue Million Forecast, by Country 2019 & 2032
- Table 122: Global Piezoresistive Pressure Sensor Industry Volume K Unit Forecast, by Country 2019 & 2032
- Table 123: Global Piezoresistive Pressure Sensor Industry Revenue Million Forecast, by Material 2019 & 2032
- Table 124: Global Piezoresistive Pressure Sensor Industry Volume K Unit Forecast, by Material 2019 & 2032
- Table 125: Global Piezoresistive Pressure Sensor Industry Revenue Million Forecast, by End User 2019 & 2032
- Table 126: Global Piezoresistive Pressure Sensor Industry Volume K Unit Forecast, by End User 2019 & 2032
- Table 127: Global Piezoresistive Pressure Sensor Industry Revenue Million Forecast, by Country 2019 & 2032
- Table 128: Global Piezoresistive Pressure Sensor Industry Volume K Unit Forecast, by Country 2019 & 2032
Frequently Asked Questions
1. What is the projected Compound Annual Growth Rate (CAGR) of the Piezoresistive Pressure Sensor Industry?
The projected CAGR is approximately 5.80%.
2. Which companies are prominent players in the Piezoresistive Pressure Sensor Industry?
Key companies in the market include Honeywell International Inc, First Sensor AG, Ninghai Sendo Sensor Co Ltd, Kistler Group, BCM Sensor Technologies BVBA, Metallux SA, Impress Sensors and Systems Ltd, BD Sensors GmBH, Pewatron AG, All Sensors Corporation, Rosemount Inc (Emerson Electric Company).
3. What are the main segments of the Piezoresistive Pressure Sensor Industry?
The market segments include Material, End User.
4. Can you provide details about the market size?
The market size is estimated to be USD XX Million as of 2022.
5. What are some drivers contributing to market growth?
; Rising Emphasis on Miniaturization of Equipment; Need for Robust Design and Enhanced Performance in Rugged Environment.
6. What are the notable trends driving market growth?
Automotive Industry is Expected to Significantly Drive the Market Growth.
7. Are there any restraints impacting market growth?
; Technical Issues associated with the involvement of Smaller Components.
8. Can you provide examples of recent developments in the market?
N/A
9. What pricing options are available for accessing the report?
Pricing options include single-user, multi-user, and enterprise licenses priced at USD 4750, USD 5250, and USD 8750 respectively.
10. Is the market size provided in terms of value or volume?
The market size is provided in terms of value, measured in Million and volume, measured in K Unit.
11. Are there any specific market keywords associated with the report?
Yes, the market keyword associated with the report is "Piezoresistive Pressure Sensor Industry," which aids in identifying and referencing the specific market segment covered.
12. How do I determine which pricing option suits my needs best?
The pricing options vary based on user requirements and access needs. Individual users may opt for single-user licenses, while businesses requiring broader access may choose multi-user or enterprise licenses for cost-effective access to the report.
13. Are there any additional resources or data provided in the Piezoresistive Pressure Sensor Industry report?
While the report offers comprehensive insights, it's advisable to review the specific contents or supplementary materials provided to ascertain if additional resources or data are available.
14. How can I stay updated on further developments or reports in the Piezoresistive Pressure Sensor Industry?
To stay informed about further developments, trends, and reports in the Piezoresistive Pressure Sensor Industry, consider subscribing to industry newsletters, following relevant companies and organizations, or regularly checking reputable industry news sources and publications.
Methodology
Step 1 - Identification of Relevant Samples Size from Population Database


Step 2 - Approaches for Defining Global Market Size (Value, Volume* & Price*)

Note*: In applicable scenarios
Step 3 - Data Sources
Primary Research
- Web Analytics
- Survey Reports
- Research Institute
- Latest Research Reports
- Opinion Leaders
Secondary Research
- Annual Reports
- White Paper
- Latest Press Release
- Industry Association
- Paid Database
- Investor Presentations

Step 4 - Data Triangulation
Involves using different sources of information in order to increase the validity of a study
These sources are likely to be stakeholders in a program - participants, other researchers, program staff, other community members, and so on.
Then we put all data in single framework & apply various statistical tools to find out the dynamic on the market.
During the analysis stage, feedback from the stakeholder groups would be compared to determine areas of agreement as well as areas of divergence
