

Key Insights
The global plant phenotyping device market is experiencing robust growth, driven by the increasing demand for high-throughput screening in agricultural research and precision farming. Technological advancements, such as the integration of advanced imaging techniques (hyperspectral, multispectral, and 3D imaging), AI-powered data analysis, and automation, are significantly enhancing the efficiency and accuracy of plant phenotyping. This allows researchers and farmers to gain deeper insights into plant growth, development, and stress responses, leading to optimized breeding strategies, improved crop yields, and sustainable agricultural practices. The market is segmented by technology (e.g., imaging systems, sensors, software), application (e.g., plant breeding, crop monitoring, stress analysis), and end-user (research institutions, agricultural companies, government agencies). Companies like WPS B.V., Saga Robotics, and BASF are major players, contributing to innovation and market expansion through product development and strategic partnerships. While initial investment costs can be a barrier, the long-term benefits in terms of increased efficiency and reduced resource utilization are driving market adoption. We project continued growth, fueled by increasing funding for agricultural research and the growing adoption of precision agriculture techniques.
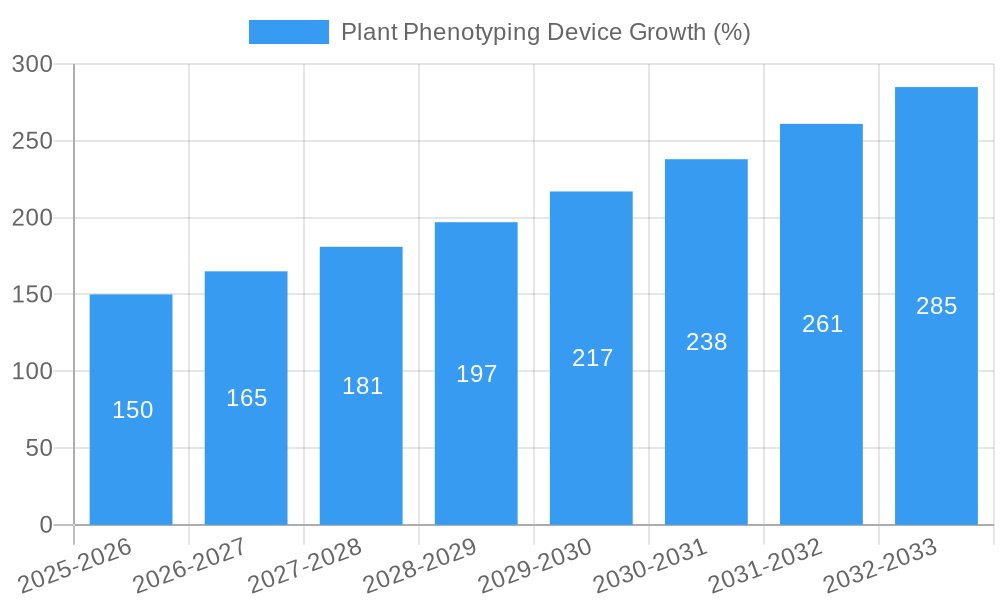
The market's growth trajectory is expected to remain positive over the forecast period (2025-2033). Factors like climate change, the need for food security, and growing interest in sustainable agriculture are creating a strong impetus for improved crop management. Further expansion will be influenced by the development of more affordable and user-friendly plant phenotyping solutions, particularly those designed for smaller farms and developing nations. Government initiatives promoting agricultural innovation and the emergence of data analytics services tailored to plant phenotyping data are also expected to contribute to market expansion. Competition is intensifying with the entry of new players, leading to innovation and price competitiveness. However, challenges remain, including the need for standardized data formats and protocols to facilitate data sharing and integration across different platforms.
Plant Phenotyping Device Market Report: 2019-2033
This comprehensive report provides a detailed analysis of the Plant Phenotyping Device market, offering invaluable insights for industry professionals, investors, and researchers. Spanning the period from 2019 to 2033, with a focus on 2025, this report meticulously examines market dynamics, growth trends, regional dominance, product landscapes, and key players. The report segments the market by technology and application, providing a granular view of the sector's evolution. The global market is projected to reach xx million units by 2033.
Plant Phenotyping Device Market Dynamics & Structure
The Plant Phenotyping Device market is characterized by moderate concentration, with key players holding significant market share. Technological innovation, driven by advancements in imaging, sensing, and data analytics, is a major driver. Regulatory frameworks related to agricultural technology and data privacy play a crucial role. Competitive substitutes include traditional field-based methods, but the superior efficiency and data-rich output of phenotyping devices are fueling adoption. The end-user demographic comprises agricultural research institutions, breeding companies, and large-scale farming operations. M&A activity is expected to remain moderate, with strategic acquisitions focused on enhancing technological capabilities and expanding market reach.
- Market Concentration: Moderately concentrated, with top 5 players holding approximately xx% market share in 2025.
- Technological Innovation: Significant advancements in high-throughput imaging, hyperspectral sensing, and AI-powered data analysis are driving market growth.
- Regulatory Landscape: Regulations regarding data privacy and the use of agricultural technologies influence market development.
- Competitive Substitutes: Traditional methods face challenges due to the higher efficiency and data richness of phenotyping devices.
- End-User Demographics: Predominantly research institutions, breeding companies, and large agricultural businesses.
- M&A Activity: An estimated xx M&A deals occurred between 2019 and 2024, focusing on technology integration and market expansion.
Plant Phenotyping Device Growth Trends & Insights
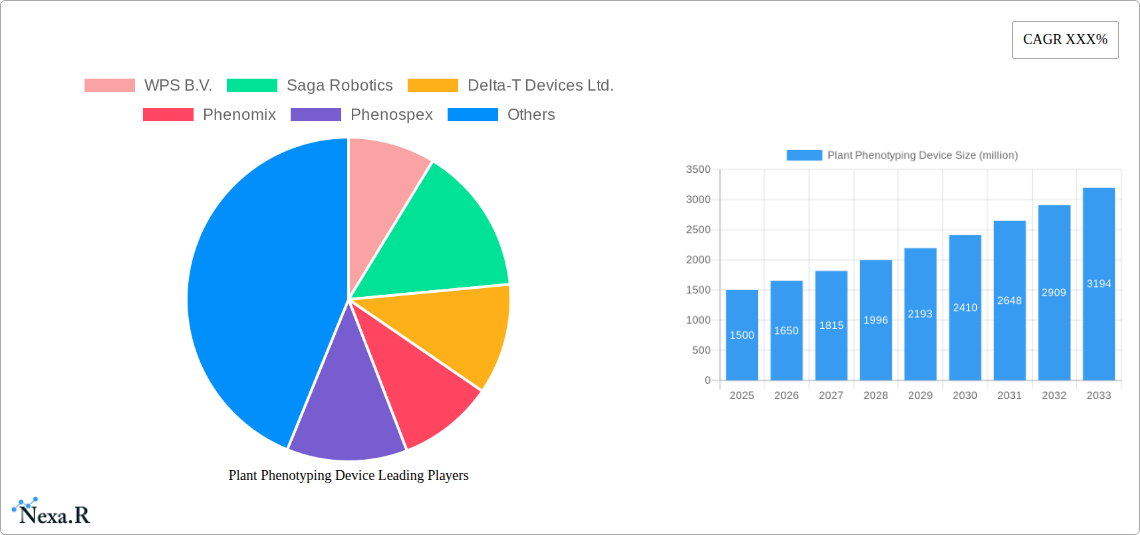
The Plant Phenotyping Device market has experienced substantial growth, driven by increasing demand for high-throughput screening, precision agriculture, and the development of climate-resilient crops. The market size expanded from xx million units in 2019 to xx million units in 2024, exhibiting a CAGR of xx%. This upward trajectory is projected to continue throughout the forecast period (2025-2033), reaching xx million units by 2033, with a projected CAGR of xx%. Adoption rates are highest in developed regions with advanced agricultural practices. Technological disruptions, such as the integration of AI and machine learning for data analysis, are further accelerating market expansion. Consumer behavior is shifting towards data-driven decision-making in agriculture, promoting the adoption of phenotyping devices.
Dominant Regions, Countries, or Segments in Plant Phenotyping Device
North America and Europe currently dominate the Plant Phenotyping Device market, driven by robust agricultural research infrastructure and substantial investments in precision agriculture technologies. However, the Asia-Pacific region is expected to witness the fastest growth rate due to increasing agricultural production and government support for technological advancements. Specific countries like the United States, Germany, China, and Japan are key contributors to market expansion. The high-throughput screening segment dominates due to its efficiency in processing large sample sizes.
- North America: Strong research infrastructure, high adoption rates, and significant investments drive market growth.
- Europe: Similar to North America, advanced agricultural practices and substantial funding in R&D contribute to high adoption.
- Asia-Pacific: Rapid growth due to increasing agricultural production and government initiatives supporting technological advancements.
- High-Throughput Screening Segment: Dominates the market due to its efficiency in processing large sample sizes.
Plant Phenotyping Device Product Landscape
The Plant Phenotyping Device market offers a diverse range of products, including high-throughput imaging systems, 3D scanners, hyperspectral cameras, and sensor networks. These devices provide detailed information on plant growth, morphology, physiology, and stress responses. Recent innovations include AI-powered data analysis platforms and automated phenotyping systems, which enhance data processing and interpretation. Key selling propositions include increased efficiency, improved accuracy, and the ability to generate large datasets for advanced analysis.
Key Drivers, Barriers & Challenges in Plant Phenotyping Device
Key Drivers:
- Increasing demand for high-throughput screening in plant breeding programs.
- Growing adoption of precision agriculture techniques to enhance crop yields.
- Advancements in imaging, sensing, and data analytics technologies.
- Government support and funding for agricultural research and development.
Key Challenges:
- High initial investment costs for advanced phenotyping systems.
- Complex data analysis and interpretation requirements.
- Lack of standardization in data formats and analytical tools.
- Dependence on robust infrastructure and skilled personnel.
Emerging Opportunities in Plant Phenotyping Device
- Expansion into untapped markets, particularly in developing countries with high agricultural potential.
- Development of cost-effective and user-friendly phenotyping solutions for smallholder farmers.
- Integration of remote sensing technologies for large-scale phenotyping applications.
- Advancements in AI and machine learning to improve data analysis and decision-making.
Growth Accelerators in the Plant Phenotyping Device Industry
Technological breakthroughs in sensor technology, data analytics, and automation are expected to drive long-term growth. Strategic partnerships between technology providers and agricultural companies will further accelerate market expansion. Government initiatives promoting the adoption of precision agriculture and investments in research and development will significantly influence the market's growth trajectory.
Key Players Shaping the Plant Phenotyping Device Market
- WPS B.V.
- Saga Robotics
- Delta-T Devices Ltd.
- Phenomix
- Phenospex
- Keygene
- Photon Systems Instruments
- WIWAM
- BASF
- Heinz Walz
Notable Milestones in Plant Phenotyping Device Sector
- 2020: Launch of the first AI-powered automated phenotyping system by Company X.
- 2022: Acquisition of Company Y by Company Z, leading to market consolidation.
- 2023: Introduction of a new hyperspectral imaging technology by Company A.
In-Depth Plant Phenotyping Device Market Outlook
The Plant Phenotyping Device market is poised for substantial growth, driven by technological advancements, increased adoption in precision agriculture, and the growing need for efficient crop improvement strategies. Strategic partnerships, government support, and continuous innovation will be key to unlocking the market's full potential. The future holds promising prospects for companies that can offer user-friendly, cost-effective, and data-rich phenotyping solutions that address the diverse needs of agricultural stakeholders.
Plant Phenotyping Device Segmentation
-
1. Application
- 1.1. Research Institutions
- 1.2. Commercial Companies
-
2. Type
- 2.1. Aerial Plant Phenotyping
- 2.2. Ground-Based Phenotyping Platforms
- 2.3. Handheld and Distributed Phenotyping Devices
Plant Phenotyping Device Segmentation By Geography
-
1. North America
- 1.1. United States
- 1.2. Canada
- 1.3. Mexico
-
2. South America
- 2.1. Brazil
- 2.2. Argentina
- 2.3. Rest of South America
-
3. Europe
- 3.1. United Kingdom
- 3.2. Germany
- 3.3. France
- 3.4. Italy
- 3.5. Spain
- 3.6. Russia
- 3.7. Benelux
- 3.8. Nordics
- 3.9. Rest of Europe
-
4. Middle East & Africa
- 4.1. Turkey
- 4.2. Israel
- 4.3. GCC
- 4.4. North Africa
- 4.5. South Africa
- 4.6. Rest of Middle East & Africa
-
5. Asia Pacific
- 5.1. China
- 5.2. India
- 5.3. Japan
- 5.4. South Korea
- 5.5. ASEAN
- 5.6. Oceania
- 5.7. Rest of Asia Pacific

Plant Phenotyping Device REPORT HIGHLIGHTS
| Aspects | Details |
|---|---|
| Study Period | 2019-2033 |
| Base Year | 2024 |
| Estimated Year | 2025 |
| Forecast Period | 2025-2033 |
| Historical Period | 2019-2024 |
| Growth Rate | CAGR of XXX% from 2019-2033 |
| Segmentation |
|
Table of Contents
- 1. Introduction
- 1.1. Research Scope
- 1.2. Market Segmentation
- 1.3. Research Methodology
- 1.4. Definitions and Assumptions
- 2. Executive Summary
- 2.1. Introduction
- 3. Market Dynamics
- 3.1. Introduction
- 3.2. Market Drivers
- 3.3. Market Restrains
- 3.4. Market Trends
- 4. Market Factor Analysis
- 4.1. Porters Five Forces
- 4.2. Supply/Value Chain
- 4.3. PESTEL analysis
- 4.4. Market Entropy
- 4.5. Patent/Trademark Analysis
- 5. Global Plant Phenotyping Device Analysis, Insights and Forecast, 2019-2031
- 5.1. Market Analysis, Insights and Forecast - by Application
- 5.1.1. Research Institutions
- 5.1.2. Commercial Companies
- 5.2. Market Analysis, Insights and Forecast - by Type
- 5.2.1. Aerial Plant Phenotyping
- 5.2.2. Ground-Based Phenotyping Platforms
- 5.2.3. Handheld and Distributed Phenotyping Devices
- 5.3. Market Analysis, Insights and Forecast - by Region
- 5.3.1. North America
- 5.3.2. South America
- 5.3.3. Europe
- 5.3.4. Middle East & Africa
- 5.3.5. Asia Pacific
- 5.1. Market Analysis, Insights and Forecast - by Application
- 6. North America Plant Phenotyping Device Analysis, Insights and Forecast, 2019-2031
- 6.1. Market Analysis, Insights and Forecast - by Application
- 6.1.1. Research Institutions
- 6.1.2. Commercial Companies
- 6.2. Market Analysis, Insights and Forecast - by Type
- 6.2.1. Aerial Plant Phenotyping
- 6.2.2. Ground-Based Phenotyping Platforms
- 6.2.3. Handheld and Distributed Phenotyping Devices
- 6.1. Market Analysis, Insights and Forecast - by Application
- 7. South America Plant Phenotyping Device Analysis, Insights and Forecast, 2019-2031
- 7.1. Market Analysis, Insights and Forecast - by Application
- 7.1.1. Research Institutions
- 7.1.2. Commercial Companies
- 7.2. Market Analysis, Insights and Forecast - by Type
- 7.2.1. Aerial Plant Phenotyping
- 7.2.2. Ground-Based Phenotyping Platforms
- 7.2.3. Handheld and Distributed Phenotyping Devices
- 7.1. Market Analysis, Insights and Forecast - by Application
- 8. Europe Plant Phenotyping Device Analysis, Insights and Forecast, 2019-2031
- 8.1. Market Analysis, Insights and Forecast - by Application
- 8.1.1. Research Institutions
- 8.1.2. Commercial Companies
- 8.2. Market Analysis, Insights and Forecast - by Type
- 8.2.1. Aerial Plant Phenotyping
- 8.2.2. Ground-Based Phenotyping Platforms
- 8.2.3. Handheld and Distributed Phenotyping Devices
- 8.1. Market Analysis, Insights and Forecast - by Application
- 9. Middle East & Africa Plant Phenotyping Device Analysis, Insights and Forecast, 2019-2031
- 9.1. Market Analysis, Insights and Forecast - by Application
- 9.1.1. Research Institutions
- 9.1.2. Commercial Companies
- 9.2. Market Analysis, Insights and Forecast - by Type
- 9.2.1. Aerial Plant Phenotyping
- 9.2.2. Ground-Based Phenotyping Platforms
- 9.2.3. Handheld and Distributed Phenotyping Devices
- 9.1. Market Analysis, Insights and Forecast - by Application
- 10. Asia Pacific Plant Phenotyping Device Analysis, Insights and Forecast, 2019-2031
- 10.1. Market Analysis, Insights and Forecast - by Application
- 10.1.1. Research Institutions
- 10.1.2. Commercial Companies
- 10.2. Market Analysis, Insights and Forecast - by Type
- 10.2.1. Aerial Plant Phenotyping
- 10.2.2. Ground-Based Phenotyping Platforms
- 10.2.3. Handheld and Distributed Phenotyping Devices
- 10.1. Market Analysis, Insights and Forecast - by Application
- 11. Competitive Analysis
- 11.1. Global Market Share Analysis 2024
- 11.2. Company Profiles
- 11.2.1 WPS B.V.
- 11.2.1.1. Overview
- 11.2.1.2. Products
- 11.2.1.3. SWOT Analysis
- 11.2.1.4. Recent Developments
- 11.2.1.5. Financials (Based on Availability)
- 11.2.2 Saga Robotics
- 11.2.2.1. Overview
- 11.2.2.2. Products
- 11.2.2.3. SWOT Analysis
- 11.2.2.4. Recent Developments
- 11.2.2.5. Financials (Based on Availability)
- 11.2.3 Delta-T Devices Ltd.
- 11.2.3.1. Overview
- 11.2.3.2. Products
- 11.2.3.3. SWOT Analysis
- 11.2.3.4. Recent Developments
- 11.2.3.5. Financials (Based on Availability)
- 11.2.4 Phenomix
- 11.2.4.1. Overview
- 11.2.4.2. Products
- 11.2.4.3. SWOT Analysis
- 11.2.4.4. Recent Developments
- 11.2.4.5. Financials (Based on Availability)
- 11.2.5 Phenospex
- 11.2.5.1. Overview
- 11.2.5.2. Products
- 11.2.5.3. SWOT Analysis
- 11.2.5.4. Recent Developments
- 11.2.5.5. Financials (Based on Availability)
- 11.2.6 Keygene
- 11.2.6.1. Overview
- 11.2.6.2. Products
- 11.2.6.3. SWOT Analysis
- 11.2.6.4. Recent Developments
- 11.2.6.5. Financials (Based on Availability)
- 11.2.7 Photon Systems Instruments
- 11.2.7.1. Overview
- 11.2.7.2. Products
- 11.2.7.3. SWOT Analysis
- 11.2.7.4. Recent Developments
- 11.2.7.5. Financials (Based on Availability)
- 11.2.8 WIWAM
- 11.2.8.1. Overview
- 11.2.8.2. Products
- 11.2.8.3. SWOT Analysis
- 11.2.8.4. Recent Developments
- 11.2.8.5. Financials (Based on Availability)
- 11.2.9 BASF
- 11.2.9.1. Overview
- 11.2.9.2. Products
- 11.2.9.3. SWOT Analysis
- 11.2.9.4. Recent Developments
- 11.2.9.5. Financials (Based on Availability)
- 11.2.10 Heinz Walz
- 11.2.10.1. Overview
- 11.2.10.2. Products
- 11.2.10.3. SWOT Analysis
- 11.2.10.4. Recent Developments
- 11.2.10.5. Financials (Based on Availability)
- 11.2.1 WPS B.V.
List of Figures
- Figure 1: Global Plant Phenotyping Device Revenue Breakdown (million, %) by Region 2024 & 2032
- Figure 2: North America Plant Phenotyping Device Revenue (million), by Application 2024 & 2032
- Figure 3: North America Plant Phenotyping Device Revenue Share (%), by Application 2024 & 2032
- Figure 4: North America Plant Phenotyping Device Revenue (million), by Type 2024 & 2032
- Figure 5: North America Plant Phenotyping Device Revenue Share (%), by Type 2024 & 2032
- Figure 6: North America Plant Phenotyping Device Revenue (million), by Country 2024 & 2032
- Figure 7: North America Plant Phenotyping Device Revenue Share (%), by Country 2024 & 2032
- Figure 8: South America Plant Phenotyping Device Revenue (million), by Application 2024 & 2032
- Figure 9: South America Plant Phenotyping Device Revenue Share (%), by Application 2024 & 2032
- Figure 10: South America Plant Phenotyping Device Revenue (million), by Type 2024 & 2032
- Figure 11: South America Plant Phenotyping Device Revenue Share (%), by Type 2024 & 2032
- Figure 12: South America Plant Phenotyping Device Revenue (million), by Country 2024 & 2032
- Figure 13: South America Plant Phenotyping Device Revenue Share (%), by Country 2024 & 2032
- Figure 14: Europe Plant Phenotyping Device Revenue (million), by Application 2024 & 2032
- Figure 15: Europe Plant Phenotyping Device Revenue Share (%), by Application 2024 & 2032
- Figure 16: Europe Plant Phenotyping Device Revenue (million), by Type 2024 & 2032
- Figure 17: Europe Plant Phenotyping Device Revenue Share (%), by Type 2024 & 2032
- Figure 18: Europe Plant Phenotyping Device Revenue (million), by Country 2024 & 2032
- Figure 19: Europe Plant Phenotyping Device Revenue Share (%), by Country 2024 & 2032
- Figure 20: Middle East & Africa Plant Phenotyping Device Revenue (million), by Application 2024 & 2032
- Figure 21: Middle East & Africa Plant Phenotyping Device Revenue Share (%), by Application 2024 & 2032
- Figure 22: Middle East & Africa Plant Phenotyping Device Revenue (million), by Type 2024 & 2032
- Figure 23: Middle East & Africa Plant Phenotyping Device Revenue Share (%), by Type 2024 & 2032
- Figure 24: Middle East & Africa Plant Phenotyping Device Revenue (million), by Country 2024 & 2032
- Figure 25: Middle East & Africa Plant Phenotyping Device Revenue Share (%), by Country 2024 & 2032
- Figure 26: Asia Pacific Plant Phenotyping Device Revenue (million), by Application 2024 & 2032
- Figure 27: Asia Pacific Plant Phenotyping Device Revenue Share (%), by Application 2024 & 2032
- Figure 28: Asia Pacific Plant Phenotyping Device Revenue (million), by Type 2024 & 2032
- Figure 29: Asia Pacific Plant Phenotyping Device Revenue Share (%), by Type 2024 & 2032
- Figure 30: Asia Pacific Plant Phenotyping Device Revenue (million), by Country 2024 & 2032
- Figure 31: Asia Pacific Plant Phenotyping Device Revenue Share (%), by Country 2024 & 2032
List of Tables
- Table 1: Global Plant Phenotyping Device Revenue million Forecast, by Region 2019 & 2032
- Table 2: Global Plant Phenotyping Device Revenue million Forecast, by Application 2019 & 2032
- Table 3: Global Plant Phenotyping Device Revenue million Forecast, by Type 2019 & 2032
- Table 4: Global Plant Phenotyping Device Revenue million Forecast, by Region 2019 & 2032
- Table 5: Global Plant Phenotyping Device Revenue million Forecast, by Application 2019 & 2032
- Table 6: Global Plant Phenotyping Device Revenue million Forecast, by Type 2019 & 2032
- Table 7: Global Plant Phenotyping Device Revenue million Forecast, by Country 2019 & 2032
- Table 8: United States Plant Phenotyping Device Revenue (million) Forecast, by Application 2019 & 2032
- Table 9: Canada Plant Phenotyping Device Revenue (million) Forecast, by Application 2019 & 2032
- Table 10: Mexico Plant Phenotyping Device Revenue (million) Forecast, by Application 2019 & 2032
- Table 11: Global Plant Phenotyping Device Revenue million Forecast, by Application 2019 & 2032
- Table 12: Global Plant Phenotyping Device Revenue million Forecast, by Type 2019 & 2032
- Table 13: Global Plant Phenotyping Device Revenue million Forecast, by Country 2019 & 2032
- Table 14: Brazil Plant Phenotyping Device Revenue (million) Forecast, by Application 2019 & 2032
- Table 15: Argentina Plant Phenotyping Device Revenue (million) Forecast, by Application 2019 & 2032
- Table 16: Rest of South America Plant Phenotyping Device Revenue (million) Forecast, by Application 2019 & 2032
- Table 17: Global Plant Phenotyping Device Revenue million Forecast, by Application 2019 & 2032
- Table 18: Global Plant Phenotyping Device Revenue million Forecast, by Type 2019 & 2032
- Table 19: Global Plant Phenotyping Device Revenue million Forecast, by Country 2019 & 2032
- Table 20: United Kingdom Plant Phenotyping Device Revenue (million) Forecast, by Application 2019 & 2032
- Table 21: Germany Plant Phenotyping Device Revenue (million) Forecast, by Application 2019 & 2032
- Table 22: France Plant Phenotyping Device Revenue (million) Forecast, by Application 2019 & 2032
- Table 23: Italy Plant Phenotyping Device Revenue (million) Forecast, by Application 2019 & 2032
- Table 24: Spain Plant Phenotyping Device Revenue (million) Forecast, by Application 2019 & 2032
- Table 25: Russia Plant Phenotyping Device Revenue (million) Forecast, by Application 2019 & 2032
- Table 26: Benelux Plant Phenotyping Device Revenue (million) Forecast, by Application 2019 & 2032
- Table 27: Nordics Plant Phenotyping Device Revenue (million) Forecast, by Application 2019 & 2032
- Table 28: Rest of Europe Plant Phenotyping Device Revenue (million) Forecast, by Application 2019 & 2032
- Table 29: Global Plant Phenotyping Device Revenue million Forecast, by Application 2019 & 2032
- Table 30: Global Plant Phenotyping Device Revenue million Forecast, by Type 2019 & 2032
- Table 31: Global Plant Phenotyping Device Revenue million Forecast, by Country 2019 & 2032
- Table 32: Turkey Plant Phenotyping Device Revenue (million) Forecast, by Application 2019 & 2032
- Table 33: Israel Plant Phenotyping Device Revenue (million) Forecast, by Application 2019 & 2032
- Table 34: GCC Plant Phenotyping Device Revenue (million) Forecast, by Application 2019 & 2032
- Table 35: North Africa Plant Phenotyping Device Revenue (million) Forecast, by Application 2019 & 2032
- Table 36: South Africa Plant Phenotyping Device Revenue (million) Forecast, by Application 2019 & 2032
- Table 37: Rest of Middle East & Africa Plant Phenotyping Device Revenue (million) Forecast, by Application 2019 & 2032
- Table 38: Global Plant Phenotyping Device Revenue million Forecast, by Application 2019 & 2032
- Table 39: Global Plant Phenotyping Device Revenue million Forecast, by Type 2019 & 2032
- Table 40: Global Plant Phenotyping Device Revenue million Forecast, by Country 2019 & 2032
- Table 41: China Plant Phenotyping Device Revenue (million) Forecast, by Application 2019 & 2032
- Table 42: India Plant Phenotyping Device Revenue (million) Forecast, by Application 2019 & 2032
- Table 43: Japan Plant Phenotyping Device Revenue (million) Forecast, by Application 2019 & 2032
- Table 44: South Korea Plant Phenotyping Device Revenue (million) Forecast, by Application 2019 & 2032
- Table 45: ASEAN Plant Phenotyping Device Revenue (million) Forecast, by Application 2019 & 2032
- Table 46: Oceania Plant Phenotyping Device Revenue (million) Forecast, by Application 2019 & 2032
- Table 47: Rest of Asia Pacific Plant Phenotyping Device Revenue (million) Forecast, by Application 2019 & 2032
Frequently Asked Questions
1. What is the projected Compound Annual Growth Rate (CAGR) of the Plant Phenotyping Device?
The projected CAGR is approximately XXX%.
2. Which companies are prominent players in the Plant Phenotyping Device?
Key companies in the market include WPS B.V., Saga Robotics, Delta-T Devices Ltd., Phenomix, Phenospex, Keygene, Photon Systems Instruments, WIWAM, BASF, Heinz Walz.
3. What are the main segments of the Plant Phenotyping Device?
The market segments include Application, Type.
4. Can you provide details about the market size?
The market size is estimated to be USD XXX million as of 2022.
5. What are some drivers contributing to market growth?
N/A
6. What are the notable trends driving market growth?
N/A
7. Are there any restraints impacting market growth?
N/A
8. Can you provide examples of recent developments in the market?
N/A
9. What pricing options are available for accessing the report?
Pricing options include single-user, multi-user, and enterprise licenses priced at USD 2900.00, USD 4350.00, and USD 5800.00 respectively.
10. Is the market size provided in terms of value or volume?
The market size is provided in terms of value, measured in million.
11. Are there any specific market keywords associated with the report?
Yes, the market keyword associated with the report is "Plant Phenotyping Device," which aids in identifying and referencing the specific market segment covered.
12. How do I determine which pricing option suits my needs best?
The pricing options vary based on user requirements and access needs. Individual users may opt for single-user licenses, while businesses requiring broader access may choose multi-user or enterprise licenses for cost-effective access to the report.
13. Are there any additional resources or data provided in the Plant Phenotyping Device report?
While the report offers comprehensive insights, it's advisable to review the specific contents or supplementary materials provided to ascertain if additional resources or data are available.
14. How can I stay updated on further developments or reports in the Plant Phenotyping Device?
To stay informed about further developments, trends, and reports in the Plant Phenotyping Device, consider subscribing to industry newsletters, following relevant companies and organizations, or regularly checking reputable industry news sources and publications.
Methodology
Step 1 - Identification of Relevant Samples Size from Population Database


Step 2 - Approaches for Defining Global Market Size (Value, Volume* & Price*)

Note*: In applicable scenarios
Step 3 - Data Sources
Primary Research
- Web Analytics
- Survey Reports
- Research Institute
- Latest Research Reports
- Opinion Leaders
Secondary Research
- Annual Reports
- White Paper
- Latest Press Release
- Industry Association
- Paid Database
- Investor Presentations

Step 4 - Data Triangulation
Involves using different sources of information in order to increase the validity of a study
These sources are likely to be stakeholders in a program - participants, other researchers, program staff, other community members, and so on.
Then we put all data in single framework & apply various statistical tools to find out the dynamic on the market.
During the analysis stage, feedback from the stakeholder groups would be compared to determine areas of agreement as well as areas of divergence
