

Key Insights
The global Edutainment market is poised for substantial expansion, projected to reach $3 billion by 2025, driven by a Compound Annual Growth Rate (CAGR) of 16.1%. This robust growth is attributed to rising parental disposable income, increased recognition of experiential learning's value, and technological innovations in interactive educational content. The market spans diverse demographics and formats, including indoor play centers, theme parks, educational applications, and online learning platforms. Intense competition exists among established brands like Legoland Discovery Center and Kidzania, as well as emerging players focusing on specialized segments such as STEM education or specific age groups. Success in this sector relies on delivering high-quality, engaging content that effectively merges education and entertainment, appealing to both children and parents. Strategic alliances with educational institutions and technology firms are crucial for enhancing offerings and expanding reach. Emerging markets with expanding middle-class populations present significant opportunities for future global growth.
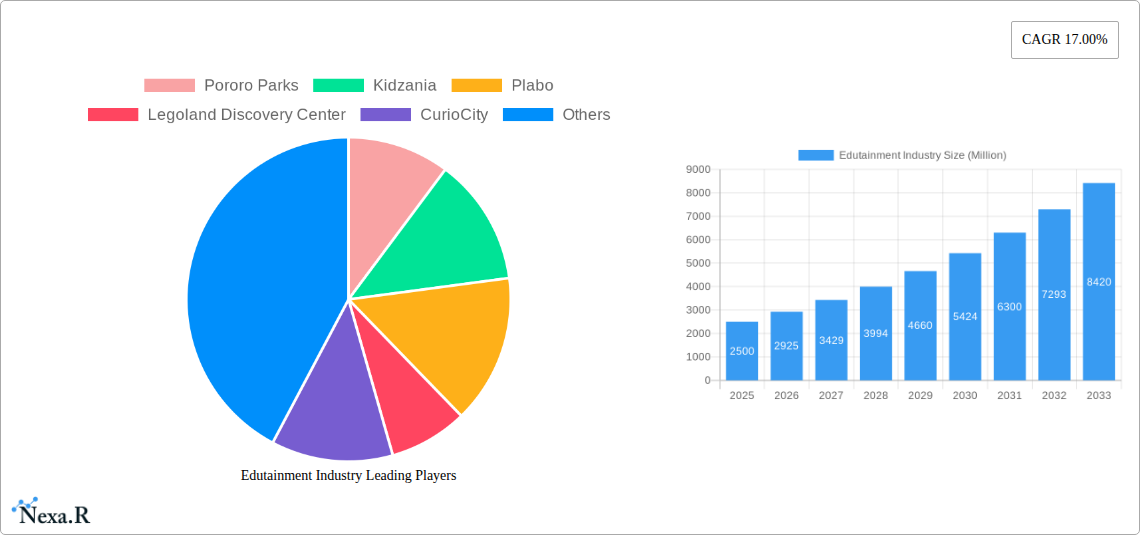
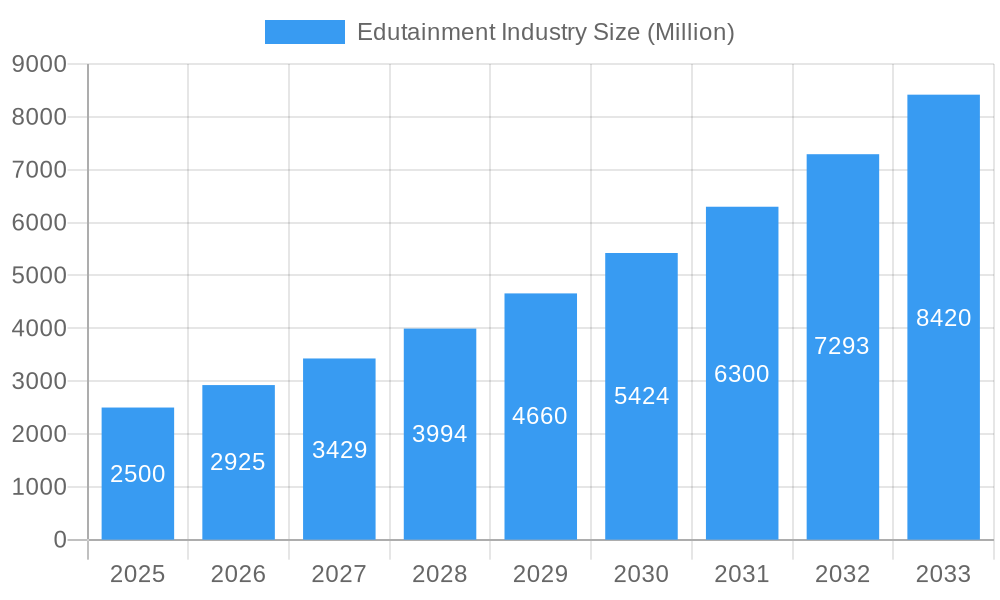
Edutainment Industry Market Size (In Billion)
Market growth is influenced by economic fluctuations affecting discretionary spending and potential market saturation in areas with a high density of competitors. Stringent regulations and safety standards necessitate considerable investment in infrastructure and compliance. Despite these challenges, the long-term outlook for Edutainment remains positive due to its contribution to holistic child development. The industry's ability to adapt to evolving educational trends, integrate emerging technologies, and uphold high safety and quality standards will be pivotal for sustained success. Analyzing the performance of key players such as Pororo Parks and Kidzania offers valuable insights into effective market strategies. Future expansion is anticipated to be fueled by a trend towards personalized learning experiences, leveraging technologies like virtual and augmented reality, alongside a heightened focus on sustainability and corporate social responsibility.
Edutainment Industry Company Market Share
Edutainment Industry Market Report: 2019-2033
This comprehensive report provides an in-depth analysis of the global edutainment market, encompassing historical data (2019-2024), current estimates (2025), and future forecasts (2025-2033). It delves into market dynamics, growth trends, regional segmentation, key players, and emerging opportunities, offering invaluable insights for industry professionals, investors, and strategic decision-makers. The report leverages extensive primary and secondary research to deliver a robust and actionable analysis of this dynamic sector. The total market size in 2025 is estimated at $XX Billion.
Edutainment Industry Market Dynamics & Structure
The global edutainment market, valued at $XX Billion in 2025, exhibits a moderately fragmented structure. Key players like Pororo Parks, Kidzania, and Legoland Discovery Center hold significant market share, but numerous smaller players also contribute substantially. Technological innovation, particularly in AR/VR and interactive learning platforms, is a major growth driver. Regulatory frameworks concerning child safety and educational standards significantly influence market operations. The industry faces competition from traditional educational methods and entertainment alternatives, creating a need for continuous product differentiation and value-addition. Mergers and acquisitions (M&A) activity has been moderate, with XX deals recorded in the past five years, primarily focusing on consolidating smaller players and expanding geographical reach.
- Market Concentration: Moderately fragmented, with top 5 players holding approximately XX% market share in 2025.
- Technological Innovation: AR/VR, gamification, personalized learning experiences are key drivers.
- Regulatory Framework: Child safety regulations, curriculum alignment, and data privacy laws influence market practices.
- Competitive Substitutes: Traditional education, home-based entertainment, online learning platforms.
- End-User Demographics: Primarily children aged 3-12, with growing interest from teenagers and adults in specific niche segments.
- M&A Trends: Moderate activity, focusing on consolidation and geographical expansion; XX deals in the last 5 years.
Edutainment Industry Growth Trends & Insights
The edutainment market experienced robust growth between 2019 and 2024, driven by increasing disposable incomes, a rising preference for experiential learning, and the integration of technology. The market exhibited a Compound Annual Growth Rate (CAGR) of XX% during this period and is projected to maintain a CAGR of XX% from 2025 to 2033, reaching an estimated $XX Billion by 2033. This growth is fueled by technological disruptions like the rise of immersive technologies and the increasing adoption of personalized learning platforms. Consumer behavior shifts towards experiential learning and a preference for interactive educational tools also contribute to market expansion. Market penetration among target demographics is expected to reach XX% by 2033.
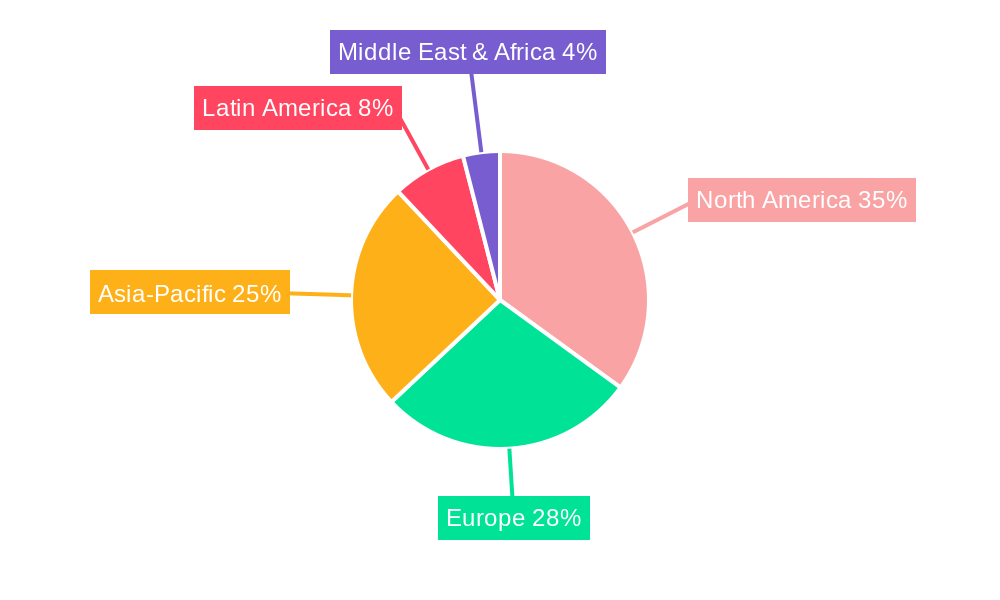
Dominant Regions, Countries, or Segments in Edutainment Industry
North America and Europe currently dominate the edutainment market, driven by strong economies, well-developed infrastructure, and high parental spending on children's education and entertainment. However, Asia-Pacific is emerging as a rapidly growing region, fueled by increasing urbanization, rising disposable incomes, and a growing middle class. Specific countries like China, India, and Japan showcase significant potential. The parent market is the broader children's entertainment industry, while the child market focuses on specific age groups (preschool, elementary school).
- North America: High disposable income, well-developed infrastructure, strong consumer demand.
- Europe: Established edutainment sector, high awareness of experiential learning.
- Asia-Pacific: Rapid growth fueled by rising incomes and urbanization; China, India, and Japan are key markets.
- Market Share: North America holds approximately XX% market share in 2025, followed by Europe with XX% and Asia-Pacific with XX%.
Edutainment Industry Product Landscape
The edutainment industry offers a diverse product landscape encompassing interactive exhibits, theme parks, educational games, apps, and online learning platforms. These products emphasize hands-on learning, gamification, and personalized experiences. Recent innovations include the integration of augmented reality (AR) and virtual reality (VR) technologies, creating immersive learning environments. Key performance metrics include visitor numbers for physical locations, user engagement for digital platforms, and educational outcomes assessed through various methods.
Key Drivers, Barriers & Challenges in Edutainment Industry
Key Drivers:
- Increasing disposable incomes and spending on children's education.
- Growing demand for experiential learning and interactive educational tools.
- Technological advancements in AR/VR and personalized learning platforms.
- Favorable government policies supporting early childhood education and development.
Challenges:
- High initial investment costs for infrastructure and technology.
- Intense competition from traditional education and entertainment providers.
- Regulatory hurdles concerning safety and data privacy.
- Supply chain disruptions affecting the availability of materials and equipment. These disruptions impacted the market by approximately XX% in 2022.
Emerging Opportunities in Edutainment Industry
- Untapped markets in developing countries with rising middle classes.
- Integration of AI and machine learning for personalized learning experiences.
- Development of edutainment content targeting specific learning needs and abilities.
- Expansion into online and hybrid edutainment models to reach broader audiences.
Growth Accelerators in the Edutainment Industry
Technological advancements, particularly in immersive technologies and AI-powered learning platforms, are key growth accelerators. Strategic partnerships between edutainment companies and educational institutions will expand market reach and credibility. Aggressive expansion into new geographical markets, especially in developing economies, will unlock significant growth potential. Focus on sustainability and ethical sourcing of materials can attract environmentally conscious consumers.
Key Players Shaping the Edutainment Industry Market
- Pororo Parks
- Kidzania
- Plabo
- Legoland Discovery Center
- CurioCity
- Kindercity
- Mattel Play! Town
- Totter's Otterville
- Kidz Holding S A L
- Little Explorers
- ConveGenius
- Grey Sim
- Edsys
- IdeaCrate Edutainment Company
- DreamUs Edutainment
Notable Milestones in Edutainment Industry Sector
- 2020-Q4: Kidzania launched a virtual reality edutainment platform.
- 2021-Q2: Legoland Discovery Center partnered with a leading educational technology company.
- 2022-Q3: A major merger between two leading edutainment companies in Asia.
- 2023-Q1: Launch of several new AR/VR edutainment apps.
In-Depth Edutainment Industry Market Outlook
The edutainment market is poised for significant growth over the next decade, driven by technological advancements, changing consumer preferences, and expansion into new markets. Strategic investments in innovative technologies, coupled with a focus on creating engaging and effective learning experiences, will be crucial for success. The integration of sustainability and ethical practices will further enhance market appeal. Companies that can adapt to the evolving technological landscape and effectively address the needs of diverse demographics will capture the greatest market share.
Edutainment Industry Segmentation
-
1. product type
- 1.1. Interactive
- 1.2. Non interactive
- 1.3. Hybrid
- 1.4. Explorative
-
2. end use age group
- 2.1. Children
- 2.2. Teenagers
- 2.3. Young Adult
-
3. region/ country
- 3.1. United States of America
- 3.2. Europe
- 3.3. China
- 3.4. Japan
- 3.5. South East Asia
- 3.6. India
- 3.7. Central and South America
Edutainment Industry Segmentation By Geography
-
1. North America
- 1.1. United States
- 1.2. Canada
- 1.3. Mexico
-
2. South America
- 2.1. Brazil
- 2.2. Argentina
- 2.3. Rest of South America
-
3. Europe
- 3.1. United Kingdom
- 3.2. Germany
- 3.3. France
- 3.4. Italy
- 3.5. Spain
- 3.6. Russia
- 3.7. Benelux
- 3.8. Nordics
- 3.9. Rest of Europe
-
4. Middle East & Africa
- 4.1. Turkey
- 4.2. Israel
- 4.3. GCC
- 4.4. North Africa
- 4.5. South Africa
- 4.6. Rest of Middle East & Africa
-
5. Asia Pacific
- 5.1. China
- 5.2. India
- 5.3. Japan
- 5.4. South Korea
- 5.5. ASEAN
- 5.6. Oceania
- 5.7. Rest of Asia Pacific
Edutainment Industry Regional Market Share
Geographic Coverage of Edutainment Industry
Edutainment Industry REPORT HIGHLIGHTS
| Aspects | Details |
|---|---|
| Study Period | 2020-2034 |
| Base Year | 2025 |
| Estimated Year | 2026 |
| Forecast Period | 2026-2034 |
| Historical Period | 2020-2025 |
| Growth Rate | CAGR of 16.1% from 2020-2034 |
| Segmentation |
|
Table of Contents
- 1. Introduction
- 1.1. Research Scope
- 1.2. Market Segmentation
- 1.3. Research Objective
- 1.4. Definitions and Assumptions
- 2. Executive Summary
- 2.1. Market Snapshot
- 3. Market Dynamics
- 3.1. Market Drivers
- 3.2. Market Restrains
- 3.3. Market Trends
- 3.4. Market Opportunities
- 4. Market Factor Analysis
- 4.1. Porters Five Forces
- 4.1.1. Bargaining Power of Suppliers
- 4.1.2. Bargaining Power of Buyers
- 4.1.3. Threat of New Entrants
- 4.1.4. Threat of Substitutes
- 4.1.5. Competitive Rivalry
- 4.2. PESTEL analysis
- 4.3. BCG Analysis
- 4.3.1. Stars (High Growth, High Market Share)
- 4.3.2. Cash Cows (Low Growth, High Market Share)
- 4.3.3. Question Mark (High Growth, Low Market Share)
- 4.3.4. Dogs (Low Growth, Low Market Share)
- 4.4. Ansoff Matrix Analysis
- 4.5. Supply Chain Analysis
- 4.6. Regulatory Landscape
- 4.7. Current Market Potential and Opportunity Assessment (TAM–SAM–SOM Framework)
- 4.8. NRP Analyst Note
- 4.1. Porters Five Forces
- 5. Market Analysis, Insights and Forecast 2021-2033
- 5.1. Market Analysis, Insights and Forecast - by product type
- 5.1.1. Interactive
- 5.1.2. Non interactive
- 5.1.3. Hybrid
- 5.1.4. Explorative
- 5.2. Market Analysis, Insights and Forecast - by end use age group
- 5.2.1. Children
- 5.2.2. Teenagers
- 5.2.3. Young Adult
- 5.3. Market Analysis, Insights and Forecast - by region/ country
- 5.3.1. United States of America
- 5.3.2. Europe
- 5.3.3. China
- 5.3.4. Japan
- 5.3.5. South East Asia
- 5.3.6. India
- 5.3.7. Central and South America
- 5.4. Market Analysis, Insights and Forecast - by Region
- 5.4.1. North America
- 5.4.2. South America
- 5.4.3. Europe
- 5.4.4. Middle East & Africa
- 5.4.5. Asia Pacific
- 5.1. Market Analysis, Insights and Forecast - by product type
- 6. Global Edutainment Industry Analysis, Insights and Forecast, 2021-2033
- 6.1. Market Analysis, Insights and Forecast - by product type
- 6.1.1. Interactive
- 6.1.2. Non interactive
- 6.1.3. Hybrid
- 6.1.4. Explorative
- 6.2. Market Analysis, Insights and Forecast - by end use age group
- 6.2.1. Children
- 6.2.2. Teenagers
- 6.2.3. Young Adult
- 6.3. Market Analysis, Insights and Forecast - by region/ country
- 6.3.1. United States of America
- 6.3.2. Europe
- 6.3.3. China
- 6.3.4. Japan
- 6.3.5. South East Asia
- 6.3.6. India
- 6.3.7. Central and South America
- 6.1. Market Analysis, Insights and Forecast - by product type
- 7. North America Edutainment Industry Analysis, Insights and Forecast, 2020-2032
- 7.1. Market Analysis, Insights and Forecast - by product type
- 7.1.1. Interactive
- 7.1.2. Non interactive
- 7.1.3. Hybrid
- 7.1.4. Explorative
- 7.2. Market Analysis, Insights and Forecast - by end use age group
- 7.2.1. Children
- 7.2.2. Teenagers
- 7.2.3. Young Adult
- 7.3. Market Analysis, Insights and Forecast - by region/ country
- 7.3.1. United States of America
- 7.3.2. Europe
- 7.3.3. China
- 7.3.4. Japan
- 7.3.5. South East Asia
- 7.3.6. India
- 7.3.7. Central and South America
- 7.1. Market Analysis, Insights and Forecast - by product type
- 8. South America Edutainment Industry Analysis, Insights and Forecast, 2020-2032
- 8.1. Market Analysis, Insights and Forecast - by product type
- 8.1.1. Interactive
- 8.1.2. Non interactive
- 8.1.3. Hybrid
- 8.1.4. Explorative
- 8.2. Market Analysis, Insights and Forecast - by end use age group
- 8.2.1. Children
- 8.2.2. Teenagers
- 8.2.3. Young Adult
- 8.3. Market Analysis, Insights and Forecast - by region/ country
- 8.3.1. United States of America
- 8.3.2. Europe
- 8.3.3. China
- 8.3.4. Japan
- 8.3.5. South East Asia
- 8.3.6. India
- 8.3.7. Central and South America
- 8.1. Market Analysis, Insights and Forecast - by product type
- 9. Europe Edutainment Industry Analysis, Insights and Forecast, 2020-2032
- 9.1. Market Analysis, Insights and Forecast - by product type
- 9.1.1. Interactive
- 9.1.2. Non interactive
- 9.1.3. Hybrid
- 9.1.4. Explorative
- 9.2. Market Analysis, Insights and Forecast - by end use age group
- 9.2.1. Children
- 9.2.2. Teenagers
- 9.2.3. Young Adult
- 9.3. Market Analysis, Insights and Forecast - by region/ country
- 9.3.1. United States of America
- 9.3.2. Europe
- 9.3.3. China
- 9.3.4. Japan
- 9.3.5. South East Asia
- 9.3.6. India
- 9.3.7. Central and South America
- 9.1. Market Analysis, Insights and Forecast - by product type
- 10. Middle East & Africa Edutainment Industry Analysis, Insights and Forecast, 2020-2032
- 10.1. Market Analysis, Insights and Forecast - by product type
- 10.1.1. Interactive
- 10.1.2. Non interactive
- 10.1.3. Hybrid
- 10.1.4. Explorative
- 10.2. Market Analysis, Insights and Forecast - by end use age group
- 10.2.1. Children
- 10.2.2. Teenagers
- 10.2.3. Young Adult
- 10.3. Market Analysis, Insights and Forecast - by region/ country
- 10.3.1. United States of America
- 10.3.2. Europe
- 10.3.3. China
- 10.3.4. Japan
- 10.3.5. South East Asia
- 10.3.6. India
- 10.3.7. Central and South America
- 10.1. Market Analysis, Insights and Forecast - by product type
- 11. Asia Pacific Edutainment Industry Analysis, Insights and Forecast, 2020-2032
- 11.1. Market Analysis, Insights and Forecast - by product type
- 11.1.1. Interactive
- 11.1.2. Non interactive
- 11.1.3. Hybrid
- 11.1.4. Explorative
- 11.2. Market Analysis, Insights and Forecast - by end use age group
- 11.2.1. Children
- 11.2.2. Teenagers
- 11.2.3. Young Adult
- 11.3. Market Analysis, Insights and Forecast - by region/ country
- 11.3.1. United States of America
- 11.3.2. Europe
- 11.3.3. China
- 11.3.4. Japan
- 11.3.5. South East Asia
- 11.3.6. India
- 11.3.7. Central and South America
- 11.1. Market Analysis, Insights and Forecast - by product type
- 12. Competitive Analysis
- 12.1. Company Profiles
- 12.1.1 Pororo Parks
- 12.1.1.1. Company Overview
- 12.1.1.2. Products
- 12.1.1.3. Company Financials
- 12.1.1.4. SWOT Analysis
- 12.1.2 Kidzania
- 12.1.2.1. Company Overview
- 12.1.2.2. Products
- 12.1.2.3. Company Financials
- 12.1.2.4. SWOT Analysis
- 12.1.3 Plabo
- 12.1.3.1. Company Overview
- 12.1.3.2. Products
- 12.1.3.3. Company Financials
- 12.1.3.4. SWOT Analysis
- 12.1.4 Legoland Discovery Center
- 12.1.4.1. Company Overview
- 12.1.4.2. Products
- 12.1.4.3. Company Financials
- 12.1.4.4. SWOT Analysis
- 12.1.5 CurioCity
- 12.1.5.1. Company Overview
- 12.1.5.2. Products
- 12.1.5.3. Company Financials
- 12.1.5.4. SWOT Analysis
- 12.1.6 Kindercity
- 12.1.6.1. Company Overview
- 12.1.6.2. Products
- 12.1.6.3. Company Financials
- 12.1.6.4. SWOT Analysis
- 12.1.7 Mattel Play! Town
- 12.1.7.1. Company Overview
- 12.1.7.2. Products
- 12.1.7.3. Company Financials
- 12.1.7.4. SWOT Analysis
- 12.1.8 Totter's Otterville
- 12.1.8.1. Company Overview
- 12.1.8.2. Products
- 12.1.8.3. Company Financials
- 12.1.8.4. SWOT Analysis
- 12.1.9 Kidz Holding S A L
- 12.1.9.1. Company Overview
- 12.1.9.2. Products
- 12.1.9.3. Company Financials
- 12.1.9.4. SWOT Analysis
- 12.1.10 Little Explorers
- 12.1.10.1. Company Overview
- 12.1.10.2. Products
- 12.1.10.3. Company Financials
- 12.1.10.4. SWOT Analysis
- 12.1.11 ConveGenius
- 12.1.11.1. Company Overview
- 12.1.11.2. Products
- 12.1.11.3. Company Financials
- 12.1.11.4. SWOT Analysis
- 12.1.12 Grey Sim
- 12.1.12.1. Company Overview
- 12.1.12.2. Products
- 12.1.12.3. Company Financials
- 12.1.12.4. SWOT Analysis
- 12.1.13 Edsys
- 12.1.13.1. Company Overview
- 12.1.13.2. Products
- 12.1.13.3. Company Financials
- 12.1.13.4. SWOT Analysis
- 12.1.14 IdeaCrate Edutainment Company
- 12.1.14.1. Company Overview
- 12.1.14.2. Products
- 12.1.14.3. Company Financials
- 12.1.14.4. SWOT Analysis
- 12.1.15 DreamUs Edutainment*List Not Exhaustive
- 12.1.15.1. Company Overview
- 12.1.15.2. Products
- 12.1.15.3. Company Financials
- 12.1.15.4. SWOT Analysis
- 12.1.1 Pororo Parks
- 12.2. Market Entropy
- 12.2.1 Company's Key Areas Served
- 12.2.2 Recent Developments
- 12.3. Company Market Share Analysis 2025
- 12.3.1 Top 5 Companies Market Share Analysis
- 12.3.2 Top 3 Companies Market Share Analysis
- 12.4. List of Potential Customers
- 13. Research Methodology
List of Figures
- Figure 1: Global Edutainment Industry Revenue Breakdown (billion, %) by Region 2025 & 2033
- Figure 2: North America Edutainment Industry Revenue (billion), by product type 2025 & 2033
- Figure 3: North America Edutainment Industry Revenue Share (%), by product type 2025 & 2033
- Figure 4: North America Edutainment Industry Revenue (billion), by end use age group 2025 & 2033
- Figure 5: North America Edutainment Industry Revenue Share (%), by end use age group 2025 & 2033
- Figure 6: North America Edutainment Industry Revenue (billion), by region/ country 2025 & 2033
- Figure 7: North America Edutainment Industry Revenue Share (%), by region/ country 2025 & 2033
- Figure 8: North America Edutainment Industry Revenue (billion), by Country 2025 & 2033
- Figure 9: North America Edutainment Industry Revenue Share (%), by Country 2025 & 2033
- Figure 10: South America Edutainment Industry Revenue (billion), by product type 2025 & 2033
- Figure 11: South America Edutainment Industry Revenue Share (%), by product type 2025 & 2033
- Figure 12: South America Edutainment Industry Revenue (billion), by end use age group 2025 & 2033
- Figure 13: South America Edutainment Industry Revenue Share (%), by end use age group 2025 & 2033
- Figure 14: South America Edutainment Industry Revenue (billion), by region/ country 2025 & 2033
- Figure 15: South America Edutainment Industry Revenue Share (%), by region/ country 2025 & 2033
- Figure 16: South America Edutainment Industry Revenue (billion), by Country 2025 & 2033
- Figure 17: South America Edutainment Industry Revenue Share (%), by Country 2025 & 2033
- Figure 18: Europe Edutainment Industry Revenue (billion), by product type 2025 & 2033
- Figure 19: Europe Edutainment Industry Revenue Share (%), by product type 2025 & 2033
- Figure 20: Europe Edutainment Industry Revenue (billion), by end use age group 2025 & 2033
- Figure 21: Europe Edutainment Industry Revenue Share (%), by end use age group 2025 & 2033
- Figure 22: Europe Edutainment Industry Revenue (billion), by region/ country 2025 & 2033
- Figure 23: Europe Edutainment Industry Revenue Share (%), by region/ country 2025 & 2033
- Figure 24: Europe Edutainment Industry Revenue (billion), by Country 2025 & 2033
- Figure 25: Europe Edutainment Industry Revenue Share (%), by Country 2025 & 2033
- Figure 26: Middle East & Africa Edutainment Industry Revenue (billion), by product type 2025 & 2033
- Figure 27: Middle East & Africa Edutainment Industry Revenue Share (%), by product type 2025 & 2033
- Figure 28: Middle East & Africa Edutainment Industry Revenue (billion), by end use age group 2025 & 2033
- Figure 29: Middle East & Africa Edutainment Industry Revenue Share (%), by end use age group 2025 & 2033
- Figure 30: Middle East & Africa Edutainment Industry Revenue (billion), by region/ country 2025 & 2033
- Figure 31: Middle East & Africa Edutainment Industry Revenue Share (%), by region/ country 2025 & 2033
- Figure 32: Middle East & Africa Edutainment Industry Revenue (billion), by Country 2025 & 2033
- Figure 33: Middle East & Africa Edutainment Industry Revenue Share (%), by Country 2025 & 2033
- Figure 34: Asia Pacific Edutainment Industry Revenue (billion), by product type 2025 & 2033
- Figure 35: Asia Pacific Edutainment Industry Revenue Share (%), by product type 2025 & 2033
- Figure 36: Asia Pacific Edutainment Industry Revenue (billion), by end use age group 2025 & 2033
- Figure 37: Asia Pacific Edutainment Industry Revenue Share (%), by end use age group 2025 & 2033
- Figure 38: Asia Pacific Edutainment Industry Revenue (billion), by region/ country 2025 & 2033
- Figure 39: Asia Pacific Edutainment Industry Revenue Share (%), by region/ country 2025 & 2033
- Figure 40: Asia Pacific Edutainment Industry Revenue (billion), by Country 2025 & 2033
- Figure 41: Asia Pacific Edutainment Industry Revenue Share (%), by Country 2025 & 2033
List of Tables
- Table 1: Global Edutainment Industry Revenue billion Forecast, by product type 2020 & 2033
- Table 2: Global Edutainment Industry Revenue billion Forecast, by end use age group 2020 & 2033
- Table 3: Global Edutainment Industry Revenue billion Forecast, by region/ country 2020 & 2033
- Table 4: Global Edutainment Industry Revenue billion Forecast, by Region 2020 & 2033
- Table 5: Global Edutainment Industry Revenue billion Forecast, by product type 2020 & 2033
- Table 6: Global Edutainment Industry Revenue billion Forecast, by end use age group 2020 & 2033
- Table 7: Global Edutainment Industry Revenue billion Forecast, by region/ country 2020 & 2033
- Table 8: Global Edutainment Industry Revenue billion Forecast, by Country 2020 & 2033
- Table 9: United States Edutainment Industry Revenue (billion) Forecast, by Application 2020 & 2033
- Table 10: Canada Edutainment Industry Revenue (billion) Forecast, by Application 2020 & 2033
- Table 11: Mexico Edutainment Industry Revenue (billion) Forecast, by Application 2020 & 2033
- Table 12: Global Edutainment Industry Revenue billion Forecast, by product type 2020 & 2033
- Table 13: Global Edutainment Industry Revenue billion Forecast, by end use age group 2020 & 2033
- Table 14: Global Edutainment Industry Revenue billion Forecast, by region/ country 2020 & 2033
- Table 15: Global Edutainment Industry Revenue billion Forecast, by Country 2020 & 2033
- Table 16: Brazil Edutainment Industry Revenue (billion) Forecast, by Application 2020 & 2033
- Table 17: Argentina Edutainment Industry Revenue (billion) Forecast, by Application 2020 & 2033
- Table 18: Rest of South America Edutainment Industry Revenue (billion) Forecast, by Application 2020 & 2033
- Table 19: Global Edutainment Industry Revenue billion Forecast, by product type 2020 & 2033
- Table 20: Global Edutainment Industry Revenue billion Forecast, by end use age group 2020 & 2033
- Table 21: Global Edutainment Industry Revenue billion Forecast, by region/ country 2020 & 2033
- Table 22: Global Edutainment Industry Revenue billion Forecast, by Country 2020 & 2033
- Table 23: United Kingdom Edutainment Industry Revenue (billion) Forecast, by Application 2020 & 2033
- Table 24: Germany Edutainment Industry Revenue (billion) Forecast, by Application 2020 & 2033
- Table 25: France Edutainment Industry Revenue (billion) Forecast, by Application 2020 & 2033
- Table 26: Italy Edutainment Industry Revenue (billion) Forecast, by Application 2020 & 2033
- Table 27: Spain Edutainment Industry Revenue (billion) Forecast, by Application 2020 & 2033
- Table 28: Russia Edutainment Industry Revenue (billion) Forecast, by Application 2020 & 2033
- Table 29: Benelux Edutainment Industry Revenue (billion) Forecast, by Application 2020 & 2033
- Table 30: Nordics Edutainment Industry Revenue (billion) Forecast, by Application 2020 & 2033
- Table 31: Rest of Europe Edutainment Industry Revenue (billion) Forecast, by Application 2020 & 2033
- Table 32: Global Edutainment Industry Revenue billion Forecast, by product type 2020 & 2033
- Table 33: Global Edutainment Industry Revenue billion Forecast, by end use age group 2020 & 2033
- Table 34: Global Edutainment Industry Revenue billion Forecast, by region/ country 2020 & 2033
- Table 35: Global Edutainment Industry Revenue billion Forecast, by Country 2020 & 2033
- Table 36: Turkey Edutainment Industry Revenue (billion) Forecast, by Application 2020 & 2033
- Table 37: Israel Edutainment Industry Revenue (billion) Forecast, by Application 2020 & 2033
- Table 38: GCC Edutainment Industry Revenue (billion) Forecast, by Application 2020 & 2033
- Table 39: North Africa Edutainment Industry Revenue (billion) Forecast, by Application 2020 & 2033
- Table 40: South Africa Edutainment Industry Revenue (billion) Forecast, by Application 2020 & 2033
- Table 41: Rest of Middle East & Africa Edutainment Industry Revenue (billion) Forecast, by Application 2020 & 2033
- Table 42: Global Edutainment Industry Revenue billion Forecast, by product type 2020 & 2033
- Table 43: Global Edutainment Industry Revenue billion Forecast, by end use age group 2020 & 2033
- Table 44: Global Edutainment Industry Revenue billion Forecast, by region/ country 2020 & 2033
- Table 45: Global Edutainment Industry Revenue billion Forecast, by Country 2020 & 2033
- Table 46: China Edutainment Industry Revenue (billion) Forecast, by Application 2020 & 2033
- Table 47: India Edutainment Industry Revenue (billion) Forecast, by Application 2020 & 2033
- Table 48: Japan Edutainment Industry Revenue (billion) Forecast, by Application 2020 & 2033
- Table 49: South Korea Edutainment Industry Revenue (billion) Forecast, by Application 2020 & 2033
- Table 50: ASEAN Edutainment Industry Revenue (billion) Forecast, by Application 2020 & 2033
- Table 51: Oceania Edutainment Industry Revenue (billion) Forecast, by Application 2020 & 2033
- Table 52: Rest of Asia Pacific Edutainment Industry Revenue (billion) Forecast, by Application 2020 & 2033
Frequently Asked Questions
1. What is the projected Compound Annual Growth Rate (CAGR) of the Edutainment Industry?
The projected CAGR is approximately 16.1%.
2. Which companies are prominent players in the Edutainment Industry?
Key companies in the market include Pororo Parks, Kidzania, Plabo, Legoland Discovery Center, CurioCity, Kindercity, Mattel Play! Town, Totter's Otterville, Kidz Holding S A L, Little Explorers, ConveGenius, Grey Sim, Edsys, IdeaCrate Edutainment Company, DreamUs Edutainment*List Not Exhaustive.
3. What are the main segments of the Edutainment Industry?
The market segments include product type, end use age group, region/ country.
4. Can you provide details about the market size?
The market size is estimated to be USD 3 billion as of 2022.
5. What are some drivers contributing to market growth?
N/A
6. What are the notable trends driving market growth?
Technological Advancement Is Driving Edutech To Newer Heights.
7. Are there any restraints impacting market growth?
N/A
8. Can you provide examples of recent developments in the market?
N/A
9. What pricing options are available for accessing the report?
Pricing options include single-user, multi-user, and enterprise licenses priced at USD 4750, USD 4950, and USD 6800 respectively.
10. Is the market size provided in terms of value or volume?
The market size is provided in terms of value, measured in billion.
11. Are there any specific market keywords associated with the report?
Yes, the market keyword associated with the report is "Edutainment Industry," which aids in identifying and referencing the specific market segment covered.
12. How do I determine which pricing option suits my needs best?
The pricing options vary based on user requirements and access needs. Individual users may opt for single-user licenses, while businesses requiring broader access may choose multi-user or enterprise licenses for cost-effective access to the report.
13. Are there any additional resources or data provided in the Edutainment Industry report?
While the report offers comprehensive insights, it's advisable to review the specific contents or supplementary materials provided to ascertain if additional resources or data are available.
14. How can I stay updated on further developments or reports in the Edutainment Industry?
To stay informed about further developments, trends, and reports in the Edutainment Industry, consider subscribing to industry newsletters, following relevant companies and organizations, or regularly checking reputable industry news sources and publications.
Methodology
Step 1 - Identification of Relevant Samples Size from Population Database


Step 2 - Approaches for Defining Global Market Size (Value, Volume* & Price*)

Note*: In applicable scenarios
Step 3 - Data Sources
Primary Research
- Web Analytics
- Survey Reports
- Research Institute
- Latest Research Reports
- Opinion Leaders
Secondary Research
- Annual Reports
- White Paper
- Latest Press Release
- Industry Association
- Paid Database
- Investor Presentations

Step 4 - Data Triangulation
Involves using different sources of information in order to increase the validity of a study
These sources are likely to be stakeholders in a program - participants, other researchers, program staff, other community members, and so on.
Then we put all data in single framework & apply various statistical tools to find out the dynamic on the market.
During the analysis stage, feedback from the stakeholder groups would be compared to determine areas of agreement as well as areas of divergence