

Key Insights
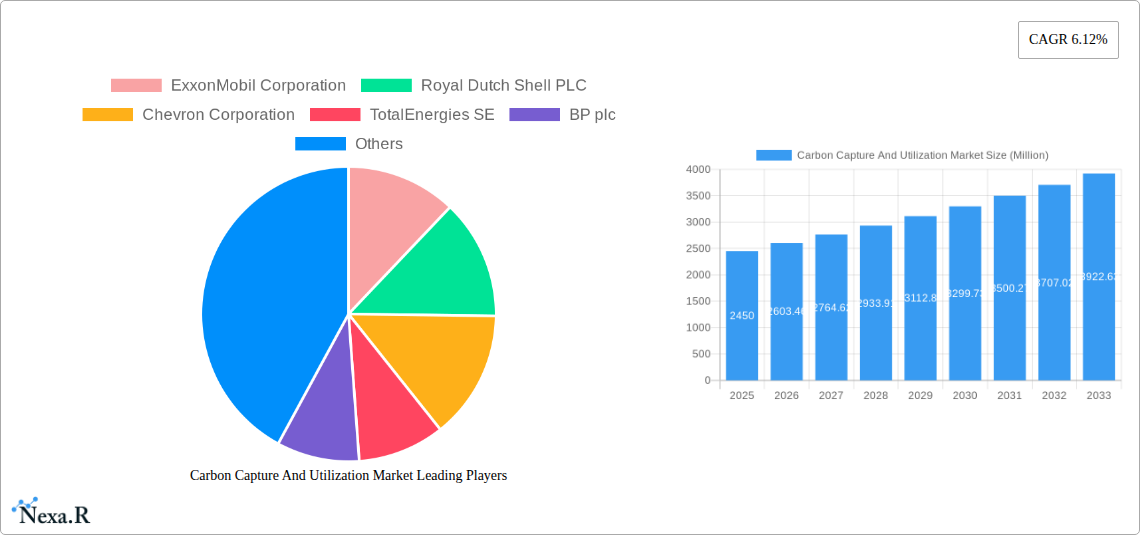
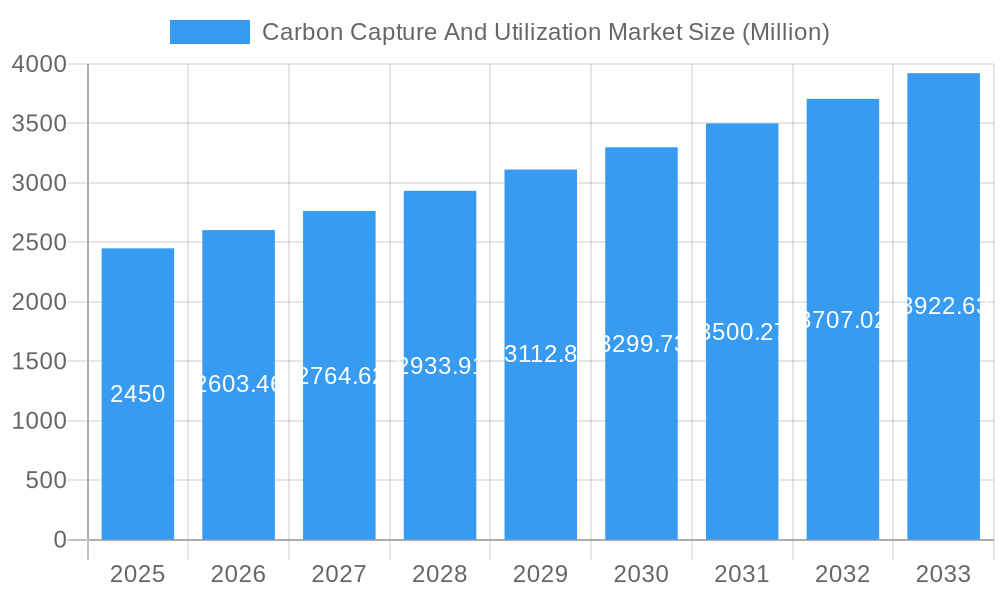
The Carbon Capture and Utilization (CCU) market is poised for substantial growth, projected to reach a value of $2.45 billion in 2025 and exhibiting a Compound Annual Growth Rate (CAGR) of 6.12% from 2025 to 2033. This expansion is driven by increasing global concerns regarding climate change and the urgent need to reduce carbon emissions. Government regulations promoting cleaner energy sources and carbon neutrality targets are significant catalysts, incentivizing investments in CCU technologies. Furthermore, advancements in capture, transportation, and utilization technologies are improving efficiency and reducing costs, making CCU a more viable solution for various industries. The market is segmented by technology type (e.g., pre-combustion, post-combustion, oxy-fuel), application (e.g., enhanced oil recovery, building materials, chemicals), and geography. Key players like ExxonMobil, Shell, Chevron, and TotalEnergies are actively involved in research, development, and deployment of CCU projects, further fueling market growth. However, high initial capital costs associated with CCU implementation and the technological complexities involved remain key restraints to wider adoption. Ongoing research and development efforts, along with supportive government policies, are expected to mitigate these challenges and unlock significant growth potential in the coming years.
Carbon Capture And Utilization Market Market Size (In Billion)
The dominance of major oil and gas companies in the CCU market highlights the sector's potential to leverage existing infrastructure and expertise. The increasing focus on circular economy principles, coupled with the development of innovative CCU applications in diverse sectors like manufacturing and agriculture, presents exciting opportunities. While the market is currently concentrated geographically, developing regions with burgeoning industrial sectors are anticipated to witness significant growth in CCU adoption. As technological advancements continue to improve cost-effectiveness and scalability, the CCU market is projected to experience an accelerated expansion throughout the forecast period, potentially exceeding initial projections if further technological breakthroughs occur. The interplay between technological innovation, policy support, and market demand will ultimately determine the trajectory and pace of CCU market development.
Carbon Capture And Utilization Market Company Market Share
Carbon Capture and Utilization (CCU) Market Report: 2019-2033
This comprehensive report provides a detailed analysis of the Carbon Capture and Utilization (CCU) market, encompassing market dynamics, growth trends, regional analysis, product landscape, key players, and future outlook. The study period covers 2019-2033, with 2025 as the base and estimated year. This report is crucial for industry professionals, investors, and policymakers seeking to understand and capitalize on the burgeoning CCU market. The parent market is the broader carbon management sector, while the child market is specifically focused on CCU technologies and their applications.
Market Size (in Million USD): The global CCU market size was valued at xx Million in 2024 and is projected to reach xx Million by 2033, exhibiting a CAGR of xx% during the forecast period (2025-2033).
Carbon Capture And Utilization Market Market Dynamics & Structure
The CCU market is characterized by moderate concentration, with a few major players dominating, but also showcasing significant room for smaller specialized companies to thrive. Technological innovation, particularly in direct air capture (DAC) and other advanced capture methods, is a primary driver. Stringent environmental regulations globally are pushing adoption, while the availability of carbon credits and government subsidies further incentivize market growth. Competitive substitutes, such as carbon offsets and traditional emission reduction strategies, present ongoing challenges. End-user demographics are diverse, encompassing power generation, industrial manufacturing, and even direct-to-consumer applications. M&A activity has been steadily increasing, reflecting the strategic importance of CCU technologies.
- Market Concentration: Moderately concentrated, with top 10 players holding approximately xx% market share in 2024.
- Technological Innovation: Rapid advancements in DAC, solvent-based capture, and membrane technologies are driving efficiency gains and cost reductions.
- Regulatory Landscape: Increasingly stringent carbon emission regulations in key markets are creating a favorable environment for CCU adoption. The carbon pricing mechanisms are acting as a strong catalyst for deployment.
- Competitive Substitutes: Traditional emission reduction strategies and carbon offsets pose competition, however CCU offers a more concrete and impactful solution for long-term sustainability.
- End-User Demographics: Power generation, industrial processes (cement, steel, chemicals), transportation fuels and consumer products (e.g., enhanced plastics).
- M&A Activity: A total of xx M&A deals were recorded in the historical period, signaling a growing interest from larger corporations to expand their CCU capabilities.
Carbon Capture And Utilization Market Growth Trends & Insights
The CCU market has experienced significant growth over the past five years, driven by increasing awareness of climate change and the need for effective carbon mitigation strategies. Adoption rates are accelerating, particularly in regions with strong regulatory frameworks and supportive government policies. Technological advancements, such as improved capture efficiency and cost-effective utilization methods, are fueling market expansion. Consumer preference for sustainable products and corporate sustainability initiatives are further boosting market demand. The market is expected to continue its upward trajectory, driven by the need for sustainable solutions that go beyond mere carbon reduction and allow for a more circular carbon economy.
- Market Size Evolution: Market size has grown from xx Million in 2019 to xx Million in 2024.
- Adoption Rates: Increasing adoption in various sectors, with a notable surge in the power generation and industrial segments.
- Technological Disruptions: Advancements in DAC, electrochemical methods, and bio-energy with carbon capture and storage (BECCS) technologies are reshaping the market landscape.
- Consumer Behavior Shifts: Growing consumer demand for sustainable products and services is driving adoption of CCU technologies in various sectors.
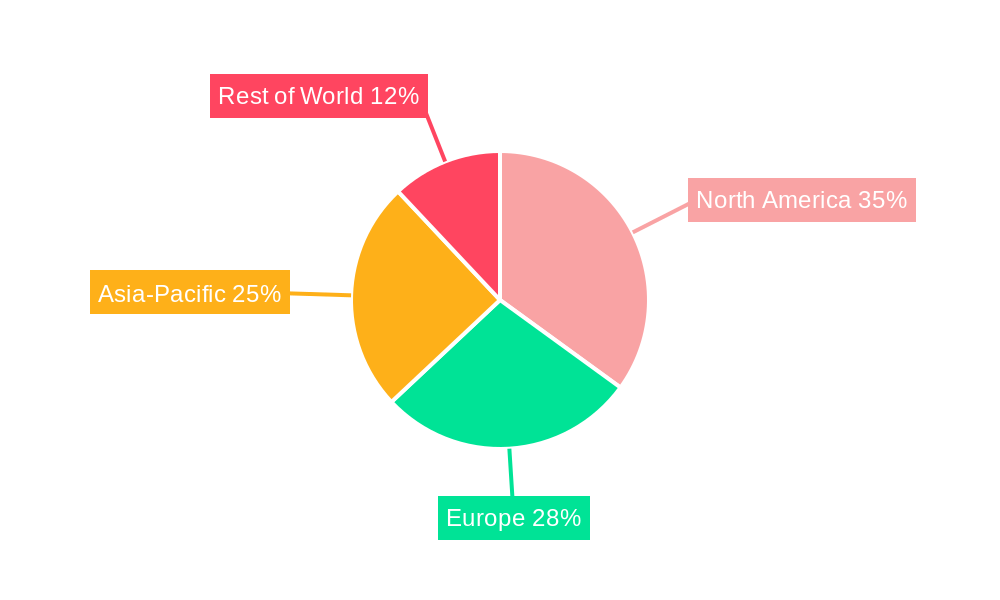
Dominant Regions, Countries, or Segments in Carbon Capture And Utilization Market
North America and Europe currently dominate the CCU market due to strong regulatory frameworks, substantial investments in research and development, and the presence of major industry players. However, Asia-Pacific is poised for rapid growth, driven by increasing industrial activity and government initiatives to address climate change. The power generation segment currently holds the largest market share, followed by the industrial sector.
- North America: Strong government support, mature technological landscape, and presence of major players contribute to high adoption rates.
- Europe: Stringent emission reduction targets and supportive policies are driving market expansion.
- Asia-Pacific: Rapid industrialization and increasing investments in renewable energy are fueling growth, particularly in China and India.
- Market Share: North America holds approximately xx% market share, followed by Europe with xx% and Asia-Pacific with xx%.
Carbon Capture And Utilization Market Product Landscape
The CCU market offers a diverse range of products, including various capture technologies (e.g., pre-combustion, post-combustion, oxy-fuel), utilization pathways (e.g., enhanced oil recovery, production of chemicals and fuels), and associated infrastructure components (e.g., pipelines, storage facilities). Recent innovations focus on improving capture efficiency, reducing operational costs, and expanding the range of valuable products produced from captured CO2. Unique selling propositions revolve around cost-effectiveness, scalability, environmental impact, and the added value of created products.
Key Drivers, Barriers & Challenges in Carbon Capture And Utilization Market
Key Drivers:
- Stringent environmental regulations globally.
- Increasing carbon pricing mechanisms.
- Government incentives and subsidies.
- Technological advancements leading to improved efficiency and cost-reduction.
Challenges & Restraints:
- High initial capital costs associated with CCU infrastructure.
- Technological maturity varies across different capture and utilization methods.
- Complexity in integration with existing industrial processes.
- Lack of large-scale deployment and cost competitiveness compared to traditional fossil fuel-based solutions.
- Supply chain challenges with materials required for CCU construction and operation.
- Regulatory uncertainties and inconsistencies across different regions.
Emerging Opportunities in Carbon Capture And Utilization Market
- Direct Air Capture (DAC): Growing market demand for scalable and efficient DAC solutions.
- Utilization in value-added products: Production of sustainable fuels (e.g., synthetic fuels), chemicals (e.g., plastics), and building materials.
- Integration with renewable energy: Coupling CCU with renewable energy sources to produce clean and sustainable energy.
- Carbon mineralization: Development of cost-effective methods for permanently storing captured CO2 in geological formations.
Growth Accelerators in the Carbon Capture And Utilization Market Industry
Significant advancements in materials science, improved capture technologies, and efficient utilization pathways are accelerating the growth of the CCU market. Strategic partnerships between energy companies, technology providers, and governments are crucial for scaling up deployment and accelerating technological development. Furthermore, the development of standardized methodologies for carbon accounting and monitoring is key to ensure market transparency and incentivize adoption.
Key Players Shaping the Carbon Capture And Utilization Market Market
Notable Milestones in Carbon Capture And Utilization Market Sector
- April 2024: TotalEnergies and Vanguard Renewables form a joint venture to develop Farm Powered RNG projects across the US.
- February 2023: Aker Solutions secures a contract for the Draugen project, expected to reduce CO2 emissions by up to 200,000 tons annually.
In-Depth Carbon Capture And Utilization Market Market Outlook
The future of the CCU market is bright, driven by continued technological innovation, supportive government policies, and increasing corporate commitments to sustainability. Strategic partnerships and collaborations are essential for accelerating market expansion. The development of cost-effective and scalable CCU technologies will unlock significant opportunities, enabling the large-scale deployment of CCU systems across various sectors. The market is poised for substantial growth, creating a significant opportunity for investors, technology developers, and companies seeking to reduce their carbon footprint.
Carbon Capture And Utilization Market Segmentation
-
1. Service
- 1.1. Capture
- 1.2. Transportation
- 1.3. Utilization
- 1.4. Storage
-
2. Technology
- 2.1. Pre-combustion Capture
- 2.2. Oxy-fuel Combustion Capture
- 2.3. Post-combustion Capture
-
3. End User
- 3.1. Oil and Gas
- 3.2. Power Generation
- 3.3. Iron and Steel
- 3.4. Chemical and Petrochemical
- 3.5. Cement
- 3.6. Other End Users
Carbon Capture And Utilization Market Segmentation By Geography
-
1. Asia Pacific
- 1.1. India
- 1.2. China
- 1.3. Japan
- 1.4. Australia
- 1.5. Rest of Asia Pacific
-
2. North America
- 2.1. United States
- 2.2. Canada
- 2.3. Rest of North America
-
3. Europe
- 3.1. Germany
- 3.2. United Kingdom
- 3.3. France
- 3.4. Russia
- 3.5. Rest of Europe
-
4. South America
- 4.1. Brazil
- 4.2. Argentina
- 4.3. Rest of South America
-
5. Middle East and Africa
- 5.1. United Arab Emirates
- 5.2. South Africa
- 5.3. Rest of Middle East and Africa
Carbon Capture And Utilization Market Regional Market Share
Geographic Coverage of Carbon Capture And Utilization Market
Carbon Capture And Utilization Market REPORT HIGHLIGHTS
| Aspects | Details |
|---|---|
| Study Period | 2020-2034 |
| Base Year | 2025 |
| Estimated Year | 2026 |
| Forecast Period | 2026-2034 |
| Historical Period | 2020-2025 |
| Growth Rate | CAGR of 6.12% from 2020-2034 |
| Segmentation |
|
Table of Contents
- 1. Introduction
- 1.1. Research Scope
- 1.2. Market Segmentation
- 1.3. Research Objective
- 1.4. Definitions and Assumptions
- 2. Executive Summary
- 2.1. Market Snapshot
- 3. Market Dynamics
- 3.1. Market Drivers
- 3.2. Market Restrains
- 3.3. Market Trends
- 3.4. Market Opportunities
- 4. Market Factor Analysis
- 4.1. Porters Five Forces
- 4.1.1. Bargaining Power of Suppliers
- 4.1.2. Bargaining Power of Buyers
- 4.1.3. Threat of New Entrants
- 4.1.4. Threat of Substitutes
- 4.1.5. Competitive Rivalry
- 4.2. PESTEL analysis
- 4.3. BCG Analysis
- 4.3.1. Stars (High Growth, High Market Share)
- 4.3.2. Cash Cows (Low Growth, High Market Share)
- 4.3.3. Question Mark (High Growth, Low Market Share)
- 4.3.4. Dogs (Low Growth, Low Market Share)
- 4.4. Ansoff Matrix Analysis
- 4.5. Supply Chain Analysis
- 4.6. Regulatory Landscape
- 4.7. Current Market Potential and Opportunity Assessment (TAM–SAM–SOM Framework)
- 4.8. NRP Analyst Note
- 4.1. Porters Five Forces
- 5. Market Analysis, Insights and Forecast 2021-2033
- 5.1. Market Analysis, Insights and Forecast - by Service
- 5.1.1. Capture
- 5.1.2. Transportation
- 5.1.3. Utilization
- 5.1.4. Storage
- 5.2. Market Analysis, Insights and Forecast - by Technology
- 5.2.1. Pre-combustion Capture
- 5.2.2. Oxy-fuel Combustion Capture
- 5.2.3. Post-combustion Capture
- 5.3. Market Analysis, Insights and Forecast - by End User
- 5.3.1. Oil and Gas
- 5.3.2. Power Generation
- 5.3.3. Iron and Steel
- 5.3.4. Chemical and Petrochemical
- 5.3.5. Cement
- 5.3.6. Other End Users
- 5.4. Market Analysis, Insights and Forecast - by Region
- 5.4.1. Asia Pacific
- 5.4.2. North America
- 5.4.3. Europe
- 5.4.4. South America
- 5.4.5. Middle East and Africa
- 5.1. Market Analysis, Insights and Forecast - by Service
- 6. Global Carbon Capture And Utilization Market Analysis, Insights and Forecast, 2021-2033
- 6.1. Market Analysis, Insights and Forecast - by Service
- 6.1.1. Capture
- 6.1.2. Transportation
- 6.1.3. Utilization
- 6.1.4. Storage
- 6.2. Market Analysis, Insights and Forecast - by Technology
- 6.2.1. Pre-combustion Capture
- 6.2.2. Oxy-fuel Combustion Capture
- 6.2.3. Post-combustion Capture
- 6.3. Market Analysis, Insights and Forecast - by End User
- 6.3.1. Oil and Gas
- 6.3.2. Power Generation
- 6.3.3. Iron and Steel
- 6.3.4. Chemical and Petrochemical
- 6.3.5. Cement
- 6.3.6. Other End Users
- 6.1. Market Analysis, Insights and Forecast - by Service
- 7. Asia Pacific Carbon Capture And Utilization Market Analysis, Insights and Forecast, 2020-2032
- 7.1. Market Analysis, Insights and Forecast - by Service
- 7.1.1. Capture
- 7.1.2. Transportation
- 7.1.3. Utilization
- 7.1.4. Storage
- 7.2. Market Analysis, Insights and Forecast - by Technology
- 7.2.1. Pre-combustion Capture
- 7.2.2. Oxy-fuel Combustion Capture
- 7.2.3. Post-combustion Capture
- 7.3. Market Analysis, Insights and Forecast - by End User
- 7.3.1. Oil and Gas
- 7.3.2. Power Generation
- 7.3.3. Iron and Steel
- 7.3.4. Chemical and Petrochemical
- 7.3.5. Cement
- 7.3.6. Other End Users
- 7.1. Market Analysis, Insights and Forecast - by Service
- 8. North America Carbon Capture And Utilization Market Analysis, Insights and Forecast, 2020-2032
- 8.1. Market Analysis, Insights and Forecast - by Service
- 8.1.1. Capture
- 8.1.2. Transportation
- 8.1.3. Utilization
- 8.1.4. Storage
- 8.2. Market Analysis, Insights and Forecast - by Technology
- 8.2.1. Pre-combustion Capture
- 8.2.2. Oxy-fuel Combustion Capture
- 8.2.3. Post-combustion Capture
- 8.3. Market Analysis, Insights and Forecast - by End User
- 8.3.1. Oil and Gas
- 8.3.2. Power Generation
- 8.3.3. Iron and Steel
- 8.3.4. Chemical and Petrochemical
- 8.3.5. Cement
- 8.3.6. Other End Users
- 8.1. Market Analysis, Insights and Forecast - by Service
- 9. Europe Carbon Capture And Utilization Market Analysis, Insights and Forecast, 2020-2032
- 9.1. Market Analysis, Insights and Forecast - by Service
- 9.1.1. Capture
- 9.1.2. Transportation
- 9.1.3. Utilization
- 9.1.4. Storage
- 9.2. Market Analysis, Insights and Forecast - by Technology
- 9.2.1. Pre-combustion Capture
- 9.2.2. Oxy-fuel Combustion Capture
- 9.2.3. Post-combustion Capture
- 9.3. Market Analysis, Insights and Forecast - by End User
- 9.3.1. Oil and Gas
- 9.3.2. Power Generation
- 9.3.3. Iron and Steel
- 9.3.4. Chemical and Petrochemical
- 9.3.5. Cement
- 9.3.6. Other End Users
- 9.1. Market Analysis, Insights and Forecast - by Service
- 10. South America Carbon Capture And Utilization Market Analysis, Insights and Forecast, 2020-2032
- 10.1. Market Analysis, Insights and Forecast - by Service
- 10.1.1. Capture
- 10.1.2. Transportation
- 10.1.3. Utilization
- 10.1.4. Storage
- 10.2. Market Analysis, Insights and Forecast - by Technology
- 10.2.1. Pre-combustion Capture
- 10.2.2. Oxy-fuel Combustion Capture
- 10.2.3. Post-combustion Capture
- 10.3. Market Analysis, Insights and Forecast - by End User
- 10.3.1. Oil and Gas
- 10.3.2. Power Generation
- 10.3.3. Iron and Steel
- 10.3.4. Chemical and Petrochemical
- 10.3.5. Cement
- 10.3.6. Other End Users
- 10.1. Market Analysis, Insights and Forecast - by Service
- 11. Middle East and Africa Carbon Capture And Utilization Market Analysis, Insights and Forecast, 2020-2032
- 11.1. Market Analysis, Insights and Forecast - by Service
- 11.1.1. Capture
- 11.1.2. Transportation
- 11.1.3. Utilization
- 11.1.4. Storage
- 11.2. Market Analysis, Insights and Forecast - by Technology
- 11.2.1. Pre-combustion Capture
- 11.2.2. Oxy-fuel Combustion Capture
- 11.2.3. Post-combustion Capture
- 11.3. Market Analysis, Insights and Forecast - by End User
- 11.3.1. Oil and Gas
- 11.3.2. Power Generation
- 11.3.3. Iron and Steel
- 11.3.4. Chemical and Petrochemical
- 11.3.5. Cement
- 11.3.6. Other End Users
- 11.1. Market Analysis, Insights and Forecast - by Service
- 12. Competitive Analysis
- 12.1. Company Profiles
- 12.1.1 ExxonMobil Corporation
- 12.1.1.1. Company Overview
- 12.1.1.2. Products
- 12.1.1.3. Company Financials
- 12.1.1.4. SWOT Analysis
- 12.1.2 Royal Dutch Shell PLC
- 12.1.2.1. Company Overview
- 12.1.2.2. Products
- 12.1.2.3. Company Financials
- 12.1.2.4. SWOT Analysis
- 12.1.3 Chevron Corporation
- 12.1.3.1. Company Overview
- 12.1.3.2. Products
- 12.1.3.3. Company Financials
- 12.1.3.4. SWOT Analysis
- 12.1.4 TotalEnergies SE
- 12.1.4.1. Company Overview
- 12.1.4.2. Products
- 12.1.4.3. Company Financials
- 12.1.4.4. SWOT Analysis
- 12.1.5 BP plc
- 12.1.5.1. Company Overview
- 12.1.5.2. Products
- 12.1.5.3. Company Financials
- 12.1.5.4. SWOT Analysis
- 12.1.6 Equinor ASA
- 12.1.6.1. Company Overview
- 12.1.6.2. Products
- 12.1.6.3. Company Financials
- 12.1.6.4. SWOT Analysis
- 12.1.7 Mitsubishi Heavy Industries Ltd
- 12.1.7.1. Company Overview
- 12.1.7.2. Products
- 12.1.7.3. Company Financials
- 12.1.7.4. SWOT Analysis
- 12.1.8 Air Products and Chemicals Inc
- 12.1.8.1. Company Overview
- 12.1.8.2. Products
- 12.1.8.3. Company Financials
- 12.1.8.4. SWOT Analysis
- 12.1.9 Aker Solutions ASA
- 12.1.9.1. Company Overview
- 12.1.9.2. Products
- 12.1.9.3. Company Financials
- 12.1.9.4. SWOT Analysis
- 12.1.10 Schlumberger Limited
- 12.1.10.1. Company Overview
- 12.1.10.2. Products
- 12.1.10.3. Company Financials
- 12.1.10.4. SWOT Analysis
- 12.1.1 ExxonMobil Corporation
- 12.2. Market Entropy
- 12.2.1 Company's Key Areas Served
- 12.2.2 Recent Developments
- 12.3. Company Market Share Analysis 2025
- 12.3.1 Top 5 Companies Market Share Analysis
- 12.3.2 Top 3 Companies Market Share Analysis
- 12.4. List of Potential Customers
- 13. Research Methodology
List of Figures
- Figure 1: Global Carbon Capture And Utilization Market Revenue Breakdown (Million, %) by Region 2025 & 2033
- Figure 2: Global Carbon Capture And Utilization Market Volume Breakdown (Billion, %) by Region 2025 & 2033
- Figure 3: Asia Pacific Carbon Capture And Utilization Market Revenue (Million), by Service 2025 & 2033
- Figure 4: Asia Pacific Carbon Capture And Utilization Market Volume (Billion), by Service 2025 & 2033
- Figure 5: Asia Pacific Carbon Capture And Utilization Market Revenue Share (%), by Service 2025 & 2033
- Figure 6: Asia Pacific Carbon Capture And Utilization Market Volume Share (%), by Service 2025 & 2033
- Figure 7: Asia Pacific Carbon Capture And Utilization Market Revenue (Million), by Technology 2025 & 2033
- Figure 8: Asia Pacific Carbon Capture And Utilization Market Volume (Billion), by Technology 2025 & 2033
- Figure 9: Asia Pacific Carbon Capture And Utilization Market Revenue Share (%), by Technology 2025 & 2033
- Figure 10: Asia Pacific Carbon Capture And Utilization Market Volume Share (%), by Technology 2025 & 2033
- Figure 11: Asia Pacific Carbon Capture And Utilization Market Revenue (Million), by End User 2025 & 2033
- Figure 12: Asia Pacific Carbon Capture And Utilization Market Volume (Billion), by End User 2025 & 2033
- Figure 13: Asia Pacific Carbon Capture And Utilization Market Revenue Share (%), by End User 2025 & 2033
- Figure 14: Asia Pacific Carbon Capture And Utilization Market Volume Share (%), by End User 2025 & 2033
- Figure 15: Asia Pacific Carbon Capture And Utilization Market Revenue (Million), by Country 2025 & 2033
- Figure 16: Asia Pacific Carbon Capture And Utilization Market Volume (Billion), by Country 2025 & 2033
- Figure 17: Asia Pacific Carbon Capture And Utilization Market Revenue Share (%), by Country 2025 & 2033
- Figure 18: Asia Pacific Carbon Capture And Utilization Market Volume Share (%), by Country 2025 & 2033
- Figure 19: North America Carbon Capture And Utilization Market Revenue (Million), by Service 2025 & 2033
- Figure 20: North America Carbon Capture And Utilization Market Volume (Billion), by Service 2025 & 2033
- Figure 21: North America Carbon Capture And Utilization Market Revenue Share (%), by Service 2025 & 2033
- Figure 22: North America Carbon Capture And Utilization Market Volume Share (%), by Service 2025 & 2033
- Figure 23: North America Carbon Capture And Utilization Market Revenue (Million), by Technology 2025 & 2033
- Figure 24: North America Carbon Capture And Utilization Market Volume (Billion), by Technology 2025 & 2033
- Figure 25: North America Carbon Capture And Utilization Market Revenue Share (%), by Technology 2025 & 2033
- Figure 26: North America Carbon Capture And Utilization Market Volume Share (%), by Technology 2025 & 2033
- Figure 27: North America Carbon Capture And Utilization Market Revenue (Million), by End User 2025 & 2033
- Figure 28: North America Carbon Capture And Utilization Market Volume (Billion), by End User 2025 & 2033
- Figure 29: North America Carbon Capture And Utilization Market Revenue Share (%), by End User 2025 & 2033
- Figure 30: North America Carbon Capture And Utilization Market Volume Share (%), by End User 2025 & 2033
- Figure 31: North America Carbon Capture And Utilization Market Revenue (Million), by Country 2025 & 2033
- Figure 32: North America Carbon Capture And Utilization Market Volume (Billion), by Country 2025 & 2033
- Figure 33: North America Carbon Capture And Utilization Market Revenue Share (%), by Country 2025 & 2033
- Figure 34: North America Carbon Capture And Utilization Market Volume Share (%), by Country 2025 & 2033
- Figure 35: Europe Carbon Capture And Utilization Market Revenue (Million), by Service 2025 & 2033
- Figure 36: Europe Carbon Capture And Utilization Market Volume (Billion), by Service 2025 & 2033
- Figure 37: Europe Carbon Capture And Utilization Market Revenue Share (%), by Service 2025 & 2033
- Figure 38: Europe Carbon Capture And Utilization Market Volume Share (%), by Service 2025 & 2033
- Figure 39: Europe Carbon Capture And Utilization Market Revenue (Million), by Technology 2025 & 2033
- Figure 40: Europe Carbon Capture And Utilization Market Volume (Billion), by Technology 2025 & 2033
- Figure 41: Europe Carbon Capture And Utilization Market Revenue Share (%), by Technology 2025 & 2033
- Figure 42: Europe Carbon Capture And Utilization Market Volume Share (%), by Technology 2025 & 2033
- Figure 43: Europe Carbon Capture And Utilization Market Revenue (Million), by End User 2025 & 2033
- Figure 44: Europe Carbon Capture And Utilization Market Volume (Billion), by End User 2025 & 2033
- Figure 45: Europe Carbon Capture And Utilization Market Revenue Share (%), by End User 2025 & 2033
- Figure 46: Europe Carbon Capture And Utilization Market Volume Share (%), by End User 2025 & 2033
- Figure 47: Europe Carbon Capture And Utilization Market Revenue (Million), by Country 2025 & 2033
- Figure 48: Europe Carbon Capture And Utilization Market Volume (Billion), by Country 2025 & 2033
- Figure 49: Europe Carbon Capture And Utilization Market Revenue Share (%), by Country 2025 & 2033
- Figure 50: Europe Carbon Capture And Utilization Market Volume Share (%), by Country 2025 & 2033
- Figure 51: South America Carbon Capture And Utilization Market Revenue (Million), by Service 2025 & 2033
- Figure 52: South America Carbon Capture And Utilization Market Volume (Billion), by Service 2025 & 2033
- Figure 53: South America Carbon Capture And Utilization Market Revenue Share (%), by Service 2025 & 2033
- Figure 54: South America Carbon Capture And Utilization Market Volume Share (%), by Service 2025 & 2033
- Figure 55: South America Carbon Capture And Utilization Market Revenue (Million), by Technology 2025 & 2033
- Figure 56: South America Carbon Capture And Utilization Market Volume (Billion), by Technology 2025 & 2033
- Figure 57: South America Carbon Capture And Utilization Market Revenue Share (%), by Technology 2025 & 2033
- Figure 58: South America Carbon Capture And Utilization Market Volume Share (%), by Technology 2025 & 2033
- Figure 59: South America Carbon Capture And Utilization Market Revenue (Million), by End User 2025 & 2033
- Figure 60: South America Carbon Capture And Utilization Market Volume (Billion), by End User 2025 & 2033
- Figure 61: South America Carbon Capture And Utilization Market Revenue Share (%), by End User 2025 & 2033
- Figure 62: South America Carbon Capture And Utilization Market Volume Share (%), by End User 2025 & 2033
- Figure 63: South America Carbon Capture And Utilization Market Revenue (Million), by Country 2025 & 2033
- Figure 64: South America Carbon Capture And Utilization Market Volume (Billion), by Country 2025 & 2033
- Figure 65: South America Carbon Capture And Utilization Market Revenue Share (%), by Country 2025 & 2033
- Figure 66: South America Carbon Capture And Utilization Market Volume Share (%), by Country 2025 & 2033
- Figure 67: Middle East and Africa Carbon Capture And Utilization Market Revenue (Million), by Service 2025 & 2033
- Figure 68: Middle East and Africa Carbon Capture And Utilization Market Volume (Billion), by Service 2025 & 2033
- Figure 69: Middle East and Africa Carbon Capture And Utilization Market Revenue Share (%), by Service 2025 & 2033
- Figure 70: Middle East and Africa Carbon Capture And Utilization Market Volume Share (%), by Service 2025 & 2033
- Figure 71: Middle East and Africa Carbon Capture And Utilization Market Revenue (Million), by Technology 2025 & 2033
- Figure 72: Middle East and Africa Carbon Capture And Utilization Market Volume (Billion), by Technology 2025 & 2033
- Figure 73: Middle East and Africa Carbon Capture And Utilization Market Revenue Share (%), by Technology 2025 & 2033
- Figure 74: Middle East and Africa Carbon Capture And Utilization Market Volume Share (%), by Technology 2025 & 2033
- Figure 75: Middle East and Africa Carbon Capture And Utilization Market Revenue (Million), by End User 2025 & 2033
- Figure 76: Middle East and Africa Carbon Capture And Utilization Market Volume (Billion), by End User 2025 & 2033
- Figure 77: Middle East and Africa Carbon Capture And Utilization Market Revenue Share (%), by End User 2025 & 2033
- Figure 78: Middle East and Africa Carbon Capture And Utilization Market Volume Share (%), by End User 2025 & 2033
- Figure 79: Middle East and Africa Carbon Capture And Utilization Market Revenue (Million), by Country 2025 & 2033
- Figure 80: Middle East and Africa Carbon Capture And Utilization Market Volume (Billion), by Country 2025 & 2033
- Figure 81: Middle East and Africa Carbon Capture And Utilization Market Revenue Share (%), by Country 2025 & 2033
- Figure 82: Middle East and Africa Carbon Capture And Utilization Market Volume Share (%), by Country 2025 & 2033
List of Tables
- Table 1: Global Carbon Capture And Utilization Market Revenue Million Forecast, by Service 2020 & 2033
- Table 2: Global Carbon Capture And Utilization Market Volume Billion Forecast, by Service 2020 & 2033
- Table 3: Global Carbon Capture And Utilization Market Revenue Million Forecast, by Technology 2020 & 2033
- Table 4: Global Carbon Capture And Utilization Market Volume Billion Forecast, by Technology 2020 & 2033
- Table 5: Global Carbon Capture And Utilization Market Revenue Million Forecast, by End User 2020 & 2033
- Table 6: Global Carbon Capture And Utilization Market Volume Billion Forecast, by End User 2020 & 2033
- Table 7: Global Carbon Capture And Utilization Market Revenue Million Forecast, by Region 2020 & 2033
- Table 8: Global Carbon Capture And Utilization Market Volume Billion Forecast, by Region 2020 & 2033
- Table 9: Global Carbon Capture And Utilization Market Revenue Million Forecast, by Service 2020 & 2033
- Table 10: Global Carbon Capture And Utilization Market Volume Billion Forecast, by Service 2020 & 2033
- Table 11: Global Carbon Capture And Utilization Market Revenue Million Forecast, by Technology 2020 & 2033
- Table 12: Global Carbon Capture And Utilization Market Volume Billion Forecast, by Technology 2020 & 2033
- Table 13: Global Carbon Capture And Utilization Market Revenue Million Forecast, by End User 2020 & 2033
- Table 14: Global Carbon Capture And Utilization Market Volume Billion Forecast, by End User 2020 & 2033
- Table 15: Global Carbon Capture And Utilization Market Revenue Million Forecast, by Country 2020 & 2033
- Table 16: Global Carbon Capture And Utilization Market Volume Billion Forecast, by Country 2020 & 2033
- Table 17: India Carbon Capture And Utilization Market Revenue (Million) Forecast, by Application 2020 & 2033
- Table 18: India Carbon Capture And Utilization Market Volume (Billion) Forecast, by Application 2020 & 2033
- Table 19: China Carbon Capture And Utilization Market Revenue (Million) Forecast, by Application 2020 & 2033
- Table 20: China Carbon Capture And Utilization Market Volume (Billion) Forecast, by Application 2020 & 2033
- Table 21: Japan Carbon Capture And Utilization Market Revenue (Million) Forecast, by Application 2020 & 2033
- Table 22: Japan Carbon Capture And Utilization Market Volume (Billion) Forecast, by Application 2020 & 2033
- Table 23: Australia Carbon Capture And Utilization Market Revenue (Million) Forecast, by Application 2020 & 2033
- Table 24: Australia Carbon Capture And Utilization Market Volume (Billion) Forecast, by Application 2020 & 2033
- Table 25: Rest of Asia Pacific Carbon Capture And Utilization Market Revenue (Million) Forecast, by Application 2020 & 2033
- Table 26: Rest of Asia Pacific Carbon Capture And Utilization Market Volume (Billion) Forecast, by Application 2020 & 2033
- Table 27: Global Carbon Capture And Utilization Market Revenue Million Forecast, by Service 2020 & 2033
- Table 28: Global Carbon Capture And Utilization Market Volume Billion Forecast, by Service 2020 & 2033
- Table 29: Global Carbon Capture And Utilization Market Revenue Million Forecast, by Technology 2020 & 2033
- Table 30: Global Carbon Capture And Utilization Market Volume Billion Forecast, by Technology 2020 & 2033
- Table 31: Global Carbon Capture And Utilization Market Revenue Million Forecast, by End User 2020 & 2033
- Table 32: Global Carbon Capture And Utilization Market Volume Billion Forecast, by End User 2020 & 2033
- Table 33: Global Carbon Capture And Utilization Market Revenue Million Forecast, by Country 2020 & 2033
- Table 34: Global Carbon Capture And Utilization Market Volume Billion Forecast, by Country 2020 & 2033
- Table 35: United States Carbon Capture And Utilization Market Revenue (Million) Forecast, by Application 2020 & 2033
- Table 36: United States Carbon Capture And Utilization Market Volume (Billion) Forecast, by Application 2020 & 2033
- Table 37: Canada Carbon Capture And Utilization Market Revenue (Million) Forecast, by Application 2020 & 2033
- Table 38: Canada Carbon Capture And Utilization Market Volume (Billion) Forecast, by Application 2020 & 2033
- Table 39: Rest of North America Carbon Capture And Utilization Market Revenue (Million) Forecast, by Application 2020 & 2033
- Table 40: Rest of North America Carbon Capture And Utilization Market Volume (Billion) Forecast, by Application 2020 & 2033
- Table 41: Global Carbon Capture And Utilization Market Revenue Million Forecast, by Service 2020 & 2033
- Table 42: Global Carbon Capture And Utilization Market Volume Billion Forecast, by Service 2020 & 2033
- Table 43: Global Carbon Capture And Utilization Market Revenue Million Forecast, by Technology 2020 & 2033
- Table 44: Global Carbon Capture And Utilization Market Volume Billion Forecast, by Technology 2020 & 2033
- Table 45: Global Carbon Capture And Utilization Market Revenue Million Forecast, by End User 2020 & 2033
- Table 46: Global Carbon Capture And Utilization Market Volume Billion Forecast, by End User 2020 & 2033
- Table 47: Global Carbon Capture And Utilization Market Revenue Million Forecast, by Country 2020 & 2033
- Table 48: Global Carbon Capture And Utilization Market Volume Billion Forecast, by Country 2020 & 2033
- Table 49: Germany Carbon Capture And Utilization Market Revenue (Million) Forecast, by Application 2020 & 2033
- Table 50: Germany Carbon Capture And Utilization Market Volume (Billion) Forecast, by Application 2020 & 2033
- Table 51: United Kingdom Carbon Capture And Utilization Market Revenue (Million) Forecast, by Application 2020 & 2033
- Table 52: United Kingdom Carbon Capture And Utilization Market Volume (Billion) Forecast, by Application 2020 & 2033
- Table 53: France Carbon Capture And Utilization Market Revenue (Million) Forecast, by Application 2020 & 2033
- Table 54: France Carbon Capture And Utilization Market Volume (Billion) Forecast, by Application 2020 & 2033
- Table 55: Russia Carbon Capture And Utilization Market Revenue (Million) Forecast, by Application 2020 & 2033
- Table 56: Russia Carbon Capture And Utilization Market Volume (Billion) Forecast, by Application 2020 & 2033
- Table 57: Rest of Europe Carbon Capture And Utilization Market Revenue (Million) Forecast, by Application 2020 & 2033
- Table 58: Rest of Europe Carbon Capture And Utilization Market Volume (Billion) Forecast, by Application 2020 & 2033
- Table 59: Global Carbon Capture And Utilization Market Revenue Million Forecast, by Service 2020 & 2033
- Table 60: Global Carbon Capture And Utilization Market Volume Billion Forecast, by Service 2020 & 2033
- Table 61: Global Carbon Capture And Utilization Market Revenue Million Forecast, by Technology 2020 & 2033
- Table 62: Global Carbon Capture And Utilization Market Volume Billion Forecast, by Technology 2020 & 2033
- Table 63: Global Carbon Capture And Utilization Market Revenue Million Forecast, by End User 2020 & 2033
- Table 64: Global Carbon Capture And Utilization Market Volume Billion Forecast, by End User 2020 & 2033
- Table 65: Global Carbon Capture And Utilization Market Revenue Million Forecast, by Country 2020 & 2033
- Table 66: Global Carbon Capture And Utilization Market Volume Billion Forecast, by Country 2020 & 2033
- Table 67: Brazil Carbon Capture And Utilization Market Revenue (Million) Forecast, by Application 2020 & 2033
- Table 68: Brazil Carbon Capture And Utilization Market Volume (Billion) Forecast, by Application 2020 & 2033
- Table 69: Argentina Carbon Capture And Utilization Market Revenue (Million) Forecast, by Application 2020 & 2033
- Table 70: Argentina Carbon Capture And Utilization Market Volume (Billion) Forecast, by Application 2020 & 2033
- Table 71: Rest of South America Carbon Capture And Utilization Market Revenue (Million) Forecast, by Application 2020 & 2033
- Table 72: Rest of South America Carbon Capture And Utilization Market Volume (Billion) Forecast, by Application 2020 & 2033
- Table 73: Global Carbon Capture And Utilization Market Revenue Million Forecast, by Service 2020 & 2033
- Table 74: Global Carbon Capture And Utilization Market Volume Billion Forecast, by Service 2020 & 2033
- Table 75: Global Carbon Capture And Utilization Market Revenue Million Forecast, by Technology 2020 & 2033
- Table 76: Global Carbon Capture And Utilization Market Volume Billion Forecast, by Technology 2020 & 2033
- Table 77: Global Carbon Capture And Utilization Market Revenue Million Forecast, by End User 2020 & 2033
- Table 78: Global Carbon Capture And Utilization Market Volume Billion Forecast, by End User 2020 & 2033
- Table 79: Global Carbon Capture And Utilization Market Revenue Million Forecast, by Country 2020 & 2033
- Table 80: Global Carbon Capture And Utilization Market Volume Billion Forecast, by Country 2020 & 2033
- Table 81: United Arab Emirates Carbon Capture And Utilization Market Revenue (Million) Forecast, by Application 2020 & 2033
- Table 82: United Arab Emirates Carbon Capture And Utilization Market Volume (Billion) Forecast, by Application 2020 & 2033
- Table 83: South Africa Carbon Capture And Utilization Market Revenue (Million) Forecast, by Application 2020 & 2033
- Table 84: South Africa Carbon Capture And Utilization Market Volume (Billion) Forecast, by Application 2020 & 2033
- Table 85: Rest of Middle East and Africa Carbon Capture And Utilization Market Revenue (Million) Forecast, by Application 2020 & 2033
- Table 86: Rest of Middle East and Africa Carbon Capture And Utilization Market Volume (Billion) Forecast, by Application 2020 & 2033
Frequently Asked Questions
1. What is the projected Compound Annual Growth Rate (CAGR) of the Carbon Capture And Utilization Market?
The projected CAGR is approximately 6.12%.
2. Which companies are prominent players in the Carbon Capture And Utilization Market?
Key companies in the market include ExxonMobil Corporation, Royal Dutch Shell PLC, Chevron Corporation, TotalEnergies SE, BP plc, Equinor ASA, Mitsubishi Heavy Industries Ltd, Air Products and Chemicals Inc, Aker Solutions ASA, Schlumberger Limited.
3. What are the main segments of the Carbon Capture And Utilization Market?
The market segments include Service, Technology, End User.
4. Can you provide details about the market size?
The market size is estimated to be USD 2.45 Million as of 2022.
5. What are some drivers contributing to market growth?
Environmental Regulations and Climate Change Goal; Growing Focuse on Reducing Co2 Emission.
6. What are the notable trends driving market growth?
Oil & Gas Industry was the Major End User in Market.
7. Are there any restraints impacting market growth?
Environmental Regulations and Climate Change Goal; Growing Focuse on Reducing Co2 Emission.
8. Can you provide examples of recent developments in the market?
April 2024: TotalEnergies, a prominent global energy firm, and Vanguard Renewables, a leading US player in converting organic farm waste into renewable natural gas (RNG), inked a deal. The agreement establishes a 50-50 joint venture, intending to develop, construct, and manage Farm Powered RNG initiatives across the United States. Vanguard Renewables, incidentally, is a portfolio company under BlackRock's Diversified Infrastructure business.February 2023: Aker Solutions confirmed signing the contract for the Draugen project with OKEA. The project is expected to reduce emissions by up to 200,000 tons of CO2 per year.
9. What pricing options are available for accessing the report?
Pricing options include single-user, multi-user, and enterprise licenses priced at USD 4750, USD 5250, and USD 8750 respectively.
10. Is the market size provided in terms of value or volume?
The market size is provided in terms of value, measured in Million and volume, measured in Billion.
11. Are there any specific market keywords associated with the report?
Yes, the market keyword associated with the report is "Carbon Capture And Utilization Market," which aids in identifying and referencing the specific market segment covered.
12. How do I determine which pricing option suits my needs best?
The pricing options vary based on user requirements and access needs. Individual users may opt for single-user licenses, while businesses requiring broader access may choose multi-user or enterprise licenses for cost-effective access to the report.
13. Are there any additional resources or data provided in the Carbon Capture And Utilization Market report?
While the report offers comprehensive insights, it's advisable to review the specific contents or supplementary materials provided to ascertain if additional resources or data are available.
14. How can I stay updated on further developments or reports in the Carbon Capture And Utilization Market?
To stay informed about further developments, trends, and reports in the Carbon Capture And Utilization Market, consider subscribing to industry newsletters, following relevant companies and organizations, or regularly checking reputable industry news sources and publications.
Methodology
Step 1 - Identification of Relevant Samples Size from Population Database


Step 2 - Approaches for Defining Global Market Size (Value, Volume* & Price*)

Note*: In applicable scenarios
Step 3 - Data Sources
Primary Research
- Web Analytics
- Survey Reports
- Research Institute
- Latest Research Reports
- Opinion Leaders
Secondary Research
- Annual Reports
- White Paper
- Latest Press Release
- Industry Association
- Paid Database
- Investor Presentations

Step 4 - Data Triangulation
Involves using different sources of information in order to increase the validity of a study
These sources are likely to be stakeholders in a program - participants, other researchers, program staff, other community members, and so on.
Then we put all data in single framework & apply various statistical tools to find out the dynamic on the market.
During the analysis stage, feedback from the stakeholder groups would be compared to determine areas of agreement as well as areas of divergence