

Key Insights
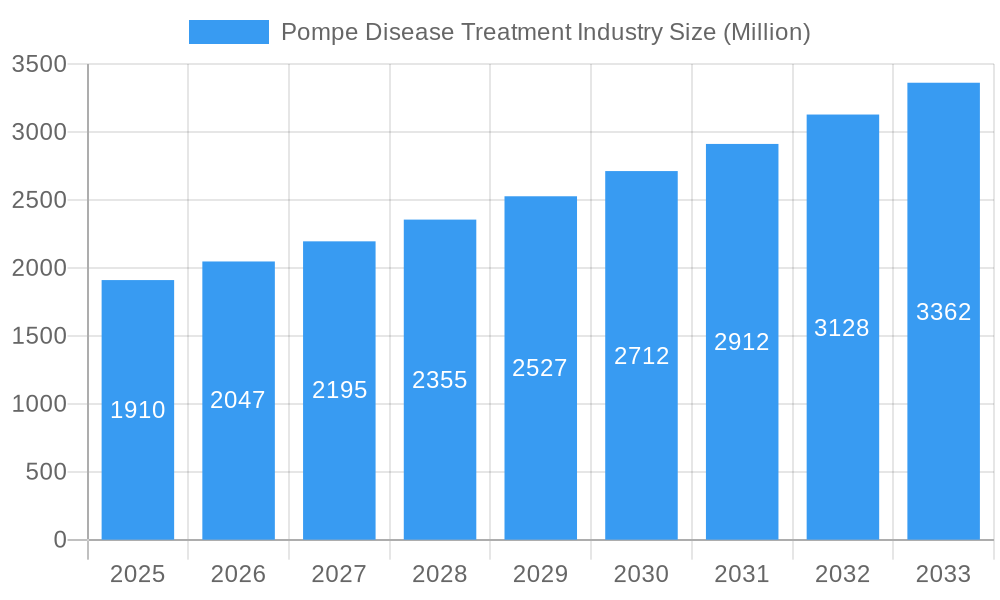
The Pompe Disease Treatment market is poised for significant expansion, projected to reach USD 1.91 billion in 2025, with a compelling Compound Annual Growth Rate (CAGR) of 7.32% extending through 2033. This robust growth is primarily fueled by advancements in therapeutic approaches, particularly the increasing adoption of Substrate Reduction Therapy (SRT) and Enzyme Replacement Therapy (ERT). The development of novel drug delivery systems, including advanced oral formulations and more efficient parenteral options, is also a critical driver, aiming to improve patient compliance and treatment efficacy. Furthermore, a growing understanding of Pompe disease's genetic underpinnings and the resulting focus on targeted therapies are contributing to market momentum. The expanding pipeline of investigational drugs and the potential for earlier diagnosis through newborn screening programs are expected to further bolster market demand in the coming years.
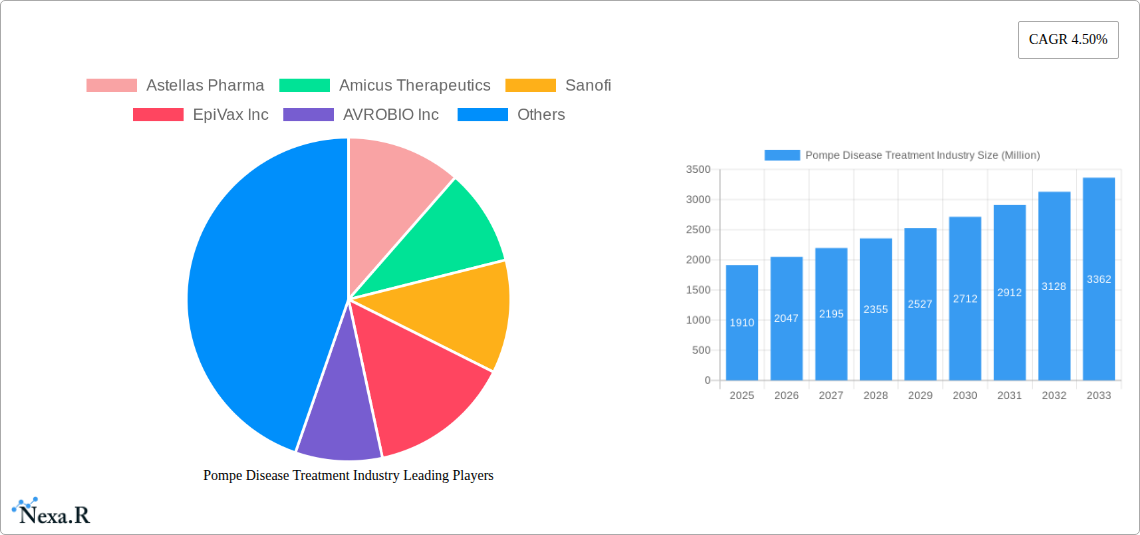
Pompe Disease Treatment Industry Market Size (In Billion)
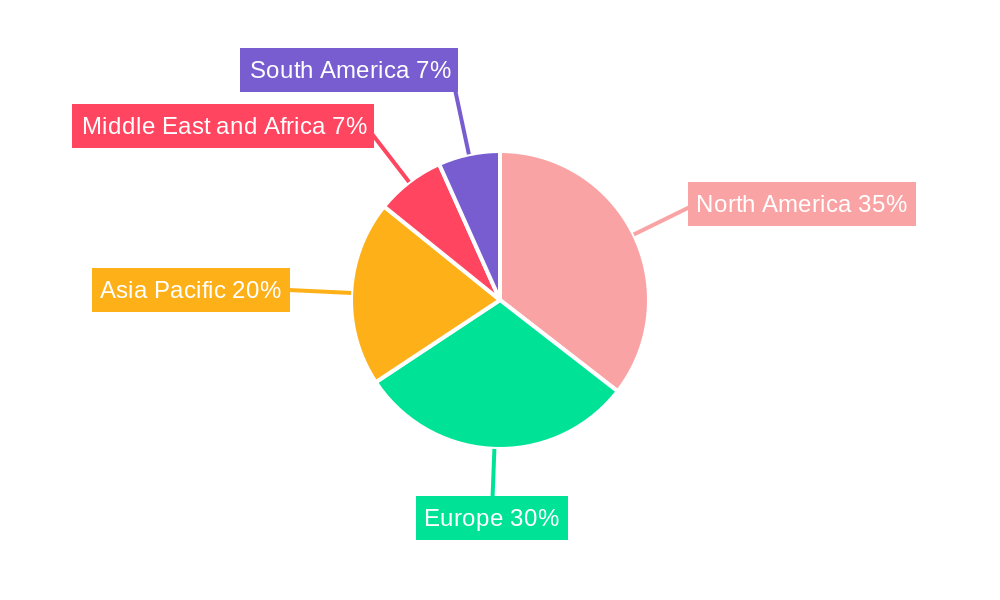
The market's trajectory is influenced by several key trends, including a strong emphasis on personalized medicine and the integration of gene therapies. While the high cost of treatment and the limited availability of specialized treatment centers pose significant restraints, ongoing research and development efforts are focused on addressing these challenges. Hospitals and specialized treatment centers represent the dominant end-user segments, reflecting the complex nature of Pompe disease management. Geographically, North America and Europe are expected to lead the market, driven by well-established healthcare infrastructures and higher patient awareness. However, the Asia Pacific region is anticipated to witness the fastest growth, propelled by increasing healthcare expenditure and a growing patient population seeking advanced treatment options. The competitive landscape features prominent players like Sanofi, Amicus Therapeutics, and Astellas Pharma, actively engaged in research, strategic collaborations, and product development to capture a larger market share.
Pompe Disease Treatment Industry Company Market Share
Pompe Disease Treatment Industry Report: Market Dynamics, Growth Trends, and Key Players (2019-2033)
This comprehensive report provides an in-depth analysis of the Pompe Disease Treatment Industry, encompassing market dynamics, growth trajectories, competitive landscape, and future opportunities. Covering the historical period from 2019-2024, with a base year of 2025 and a forecast period extending to 2033, this report leverages critical data points and industry insights to guide stakeholders in this niche but vital sector. Discover the market's evolution, dominant regions, product landscape, and the strategic imperatives for success in treating this rare and progressive neuromuscular disorder.
Pompe Disease Treatment Industry Market Dynamics & Structure
The Pompe Disease Treatment Industry is characterized by a moderately concentrated market structure, with a few key players holding significant market share, particularly in the Enzyme Replacement Therapy (ERT) segment. Technological innovation is a primary driver, fueled by advancements in gene therapy and substrate reduction strategies. Regulatory frameworks, while stringent due to the rare disease designation, are crucial in facilitating market access for novel therapies. Competitive product substitutes are limited but evolving, with ongoing research into alternative treatment modalities. End-user demographics primarily include hospitals and specialized treatment centers, with increasing focus on patient advocacy and support for improved diagnostics and treatment adherence. Mergers and acquisitions (M&A) are becoming more prevalent as larger pharmaceutical companies seek to expand their rare disease portfolios.
- Market Concentration: Dominated by a few major pharmaceutical companies with established ERT offerings.
- Technological Innovation Drivers: Gene therapy, novel drug delivery systems, and advancements in understanding disease pathways.
- Regulatory Frameworks: EMA and FDA approvals are critical for market entry, often accelerated due to rare disease status.
- Competitive Product Substitutes: Emerging SRTs and promising gene therapies are beginning to offer alternatives to ERT.
- End-User Demographics: Hospitals and specialized rare disease centers are the primary end-users.
- M&A Trends: Strategic acquisitions to strengthen rare disease pipelines and gain market access.
Pompe Disease Treatment Industry Growth Trends & Insights
The global Pompe Disease Treatment Industry is poised for significant growth, projected to expand from an estimated market size of $2.5 billion in 2025 to $5.8 billion by 2033, exhibiting a robust Compound Annual Growth Rate (CAGR) of approximately 10.5% during the forecast period. This upward trajectory is primarily propelled by increasing disease diagnosis rates, enhanced awareness among healthcare professionals and patients, and the continuous development of more effective and convenient treatment options. The adoption rate of Enzyme Replacement Therapy (ERT) has been steadily increasing, driven by its established efficacy in managing symptoms and improving quality of life for patients. However, the advent of novel treatment modalities, such as gene therapy and substrate reduction therapy (SRT), is beginning to disrupt the market landscape. These innovative approaches offer the potential for more targeted treatment and may even provide a functional cure for certain patient populations, leading to a gradual shift in treatment preferences.
Consumer behavior shifts are also playing a crucial role. Patients and their families are becoming more proactive in seeking advanced treatment options, driven by access to information and strong patient advocacy groups. This heightened demand, coupled with improving reimbursement policies for rare disease treatments, further fuels market expansion. Technological disruptions are central to this evolution, with ongoing research focusing on developing oral formulations to enhance patient compliance and reduce the burden of intravenous infusions, a common administration route for current ERTs. The increasing investment in rare disease research and development by pharmaceutical giants, alongside a growing number of biotech startups, underscores the lucrative potential and the urgent unmet need within the Pompe disease therapeutic landscape. These factors collectively contribute to a dynamic and expanding market, promising substantial improvements in patient outcomes and significant returns for industry stakeholders.
Dominant Regions, Countries, or Segments in Pompe Disease Treatment Industry
North America currently dominates the Pompe Disease Treatment Industry, driven by its robust healthcare infrastructure, high disease prevalence, early adoption of innovative therapies, and favorable reimbursement policies. The United States, in particular, represents a significant market due to its large patient population and the presence of leading research institutions and pharmaceutical companies actively involved in Pompe disease therapeutics. The Parenteral route of administration currently holds the largest market share within the industry, largely due to the established efficacy of Enzyme Replacement Therapy (ERT) which is predominantly administered intravenously. ERT itself is the leading treatment type, accounting for the lion's share of the market revenue due to its long-standing availability and proven benefits in managing both infantile and late-onset Pompe disease.
Hospitals represent the dominant end-user segment, as they are equipped to administer complex intravenous therapies and manage the multidisciplinary care required for patients with Pompe disease. However, there is a growing trend towards specialized infusion centers and home healthcare services, indicating a gradual shift in end-user preferences towards more patient-centric and convenient treatment delivery models.
- Dominant Region: North America (specifically the United States).
- Key Drivers: Advanced healthcare systems, high diagnosis rates, strong R&D investment, favorable reimbursement.
- Market Share: Estimated to hold over 40% of the global market share in 2025.
- Dominant Route of Administration: Parenteral.
- Key Drivers: Efficacy of current ERTs, established administration protocols.
- Market Share: Expected to capture over 85% of the market in 2025.
- Dominant Treatment Type: Enzyme Replacement Therapy (ERT).
- Key Drivers: Proven clinical efficacy, broad patient applicability.
- Market Share: Accounts for approximately 80% of the market in 2025.
- Dominant End-User: Hospitals.
- Key Drivers: Infrastructure for complex treatments, specialized medical teams.
- Market Share: Representing over 70% of end-user revenue in 2025.
Pompe Disease Treatment Industry Product Landscape
The Pompe Disease Treatment Industry's product landscape is primarily defined by Enzyme Replacement Therapies (ERTs) like alglucosidase alfa and avalglucosidase alfa, which aim to replenish the deficient enzyme responsible for breaking down glycogen. These products, administered parenterally, have revolutionized patient care by mitigating disease progression and improving muscle function. Emerging innovations include substrate reduction therapies (SRTs) targeting the underlying metabolic imbalance and gene therapies offering the potential for long-term correction. Companies are actively pursuing product line extensions and exploring novel drug delivery systems to enhance patient convenience and treatment outcomes.
Key Drivers, Barriers & Challenges in Pompe Disease Treatment Industry
Key Drivers:
- Technological Advancements: Development of novel ERTs, gene therapies, and SRTs offering improved efficacy and patient convenience.
- Increasing Disease Awareness & Diagnosis: Improved diagnostic tools and greater awareness among healthcare professionals are leading to earlier and more accurate diagnoses.
- Favorable Reimbursement Policies: Government initiatives and insurance coverage for rare disease treatments facilitate patient access.
- Growing Investment in Rare Disease R&D: Pharmaceutical and biotech companies are increasing their focus on rare disease therapeutics.
Barriers & Challenges:
- High Cost of Treatment: ERTs and novel therapies are exceptionally expensive, posing a significant financial burden on healthcare systems and patients.
- Limited Patient Pool: Pompe disease is rare, leading to smaller patient populations which can impact market size and return on investment.
- Complex Treatment Administration: Current ERTs require regular intravenous infusions, impacting patient lifestyle and adherence.
- Regulatory Hurdles for Novel Therapies: While rare disease pathways exist, rigorous clinical trials are still necessary for new treatment approvals.
- Supply Chain Vulnerabilities: Manufacturing complex biological therapies can be susceptible to disruptions.
Emerging Opportunities in Pompe Disease Treatment Industry
Emerging opportunities in the Pompe Disease Treatment Industry lie in the development of oral SRTs, which promise greater patient convenience and improved adherence compared to current parenteral ERTs. Gene therapy holds immense potential for a functional cure, representing a significant long-term opportunity as research progresses. Expansion into underserved geographical regions with increasing diagnostic capabilities also presents a growth avenue. Furthermore, personalized medicine approaches, tailoring treatments based on genetic profiles and disease severity, are likely to gain traction.
Growth Accelerators in the Pompe Disease Treatment Industry Industry
Growth accelerators in the Pompe Disease Treatment Industry are primarily driven by significant investments in gene therapy research and development, which promises potentially curative long-term solutions. Strategic partnerships between established pharmaceutical companies and innovative biotech firms are crucial for advancing novel drug candidates through clinical trials and towards market approval. The ongoing expansion of diagnostic capabilities and increasing global awareness of rare diseases are also accelerating patient identification, thereby broadening the eligible patient base for existing and upcoming therapies. Furthermore, advancements in manufacturing technologies are poised to reduce production costs, potentially making treatments more accessible.
Key Players Shaping the Pompe Disease Treatment Industry Market
- Astellas Pharma
- Amicus Therapeutics
- Sanofi
- EpiVax Inc
- AVROBIO Inc
- Genethon
- Oxyrane
Notable Milestones in Pompe Disease Treatment Industry Sector
- June 2022: The European Commission granted marketing authorization for Nexvia Dyme (alglucosidase alfa), an enzyme replacement therapy (ERT) for the long-term treatment of both late-onset and infantile-onset Pompe disease, a rare, progressive, and debilitating muscle disorder.
- February 2022: Maze Therapeutics, a company translating genetic insights into new precision medicines, reported new preclinical data supporting the advancement of MZE001, which aims to address Pompe disease by reducing pathologic glycogen accumulation through the inhibition of muscle glycogen synthase (GYS1).
In-Depth Pompe Disease Treatment Industry Market Outlook
The future outlook for the Pompe Disease Treatment Industry is exceptionally positive, buoyed by ongoing breakthroughs in gene therapy and the development of more patient-friendly oral treatments. The expanding pipeline of novel therapies, coupled with increasing diagnostic capabilities and enhanced global disease awareness, will significantly drive market growth. Strategic collaborations and a continued focus on rare disease research by key industry players will further accelerate innovation and market penetration. The industry is expected to witness a shift towards personalized medicine and potentially curative treatments, presenting substantial opportunities for companies that can navigate the complex regulatory landscape and address the high cost of therapies.
Pompe Disease Treatment Industry Segmentation
-
1. Route of Administration
- 1.1. Oral
- 1.2. Parenteral
-
2. Treatment Type
- 2.1. Substrate Reduction Therapy (SRT)
- 2.2. Enzyme Replacement Therapy (ERT)
- 2.3. Other Treatment Types
-
3. End-User
- 3.1. Hospitals
- 3.2. Ambulatory Surgical Centers
- 3.3. Other End-Users
Pompe Disease Treatment Industry Segmentation By Geography
-
1. North America
- 1.1. United States
- 1.2. Canada
- 1.3. Mexico
-
2. Europe
- 2.1. Germany
- 2.2. United Kingdom
- 2.3. France
- 2.4. Italy
- 2.5. Spain
- 2.6. Rest of Europe
-
3. Asia Pacific
- 3.1. China
- 3.2. Japan
- 3.3. India
- 3.4. Australia
- 3.5. South Korea
- 3.6. Rest of Asia Pacific
-
4. Middle East and Africa
- 4.1. GCC
- 4.2. South Africa
- 4.3. Rest of Middle East and Africa
-
5. South America
- 5.1. Brazil
- 5.2. Argentina
- 5.3. Rest of South America
Pompe Disease Treatment Industry Regional Market Share
Geographic Coverage of Pompe Disease Treatment Industry
Pompe Disease Treatment Industry REPORT HIGHLIGHTS
| Aspects | Details |
|---|---|
| Study Period | 2020-2034 |
| Base Year | 2025 |
| Estimated Year | 2026 |
| Forecast Period | 2026-2034 |
| Historical Period | 2020-2025 |
| Growth Rate | CAGR of 4.4% from 2020-2034 |
| Segmentation |
|
Table of Contents
- 1. Introduction
- 1.1. Research Scope
- 1.2. Market Segmentation
- 1.3. Research Objective
- 1.4. Definitions and Assumptions
- 2. Executive Summary
- 2.1. Market Snapshot
- 3. Market Dynamics
- 3.1. Market Drivers
- 3.2. Market Restrains
- 3.3. Market Trends
- 3.4. Market Opportunities
- 4. Market Factor Analysis
- 4.1. Porters Five Forces
- 4.1.1. Bargaining Power of Suppliers
- 4.1.2. Bargaining Power of Buyers
- 4.1.3. Threat of New Entrants
- 4.1.4. Threat of Substitutes
- 4.1.5. Competitive Rivalry
- 4.2. PESTEL analysis
- 4.3. BCG Analysis
- 4.3.1. Stars (High Growth, High Market Share)
- 4.3.2. Cash Cows (Low Growth, High Market Share)
- 4.3.3. Question Mark (High Growth, Low Market Share)
- 4.3.4. Dogs (Low Growth, Low Market Share)
- 4.4. Ansoff Matrix Analysis
- 4.5. Supply Chain Analysis
- 4.6. Regulatory Landscape
- 4.7. Current Market Potential and Opportunity Assessment (TAM–SAM–SOM Framework)
- 4.8. NRP Analyst Note
- 4.1. Porters Five Forces
- 5. Market Analysis, Insights and Forecast 2021-2033
- 5.1. Market Analysis, Insights and Forecast - by Route of Administration
- 5.1.1. Oral
- 5.1.2. Parenteral
- 5.2. Market Analysis, Insights and Forecast - by Treatment Type
- 5.2.1. Substrate Reduction Therapy (SRT)
- 5.2.2. Enzyme Replacement Therapy (ERT)
- 5.2.3. Other Treatment Types
- 5.3. Market Analysis, Insights and Forecast - by End-User
- 5.3.1. Hospitals
- 5.3.2. Ambulatory Surgical Centers
- 5.3.3. Other End-Users
- 5.4. Market Analysis, Insights and Forecast - by Region
- 5.4.1. North America
- 5.4.2. Europe
- 5.4.3. Asia Pacific
- 5.4.4. Middle East and Africa
- 5.4.5. South America
- 5.1. Market Analysis, Insights and Forecast - by Route of Administration
- 6. Global Pompe Disease Treatment Industry Analysis, Insights and Forecast, 2021-2033
- 6.1. Market Analysis, Insights and Forecast - by Route of Administration
- 6.1.1. Oral
- 6.1.2. Parenteral
- 6.2. Market Analysis, Insights and Forecast - by Treatment Type
- 6.2.1. Substrate Reduction Therapy (SRT)
- 6.2.2. Enzyme Replacement Therapy (ERT)
- 6.2.3. Other Treatment Types
- 6.3. Market Analysis, Insights and Forecast - by End-User
- 6.3.1. Hospitals
- 6.3.2. Ambulatory Surgical Centers
- 6.3.3. Other End-Users
- 6.1. Market Analysis, Insights and Forecast - by Route of Administration
- 7. North America Pompe Disease Treatment Industry Analysis, Insights and Forecast, 2020-2032
- 7.1. Market Analysis, Insights and Forecast - by Route of Administration
- 7.1.1. Oral
- 7.1.2. Parenteral
- 7.2. Market Analysis, Insights and Forecast - by Treatment Type
- 7.2.1. Substrate Reduction Therapy (SRT)
- 7.2.2. Enzyme Replacement Therapy (ERT)
- 7.2.3. Other Treatment Types
- 7.3. Market Analysis, Insights and Forecast - by End-User
- 7.3.1. Hospitals
- 7.3.2. Ambulatory Surgical Centers
- 7.3.3. Other End-Users
- 7.1. Market Analysis, Insights and Forecast - by Route of Administration
- 8. Europe Pompe Disease Treatment Industry Analysis, Insights and Forecast, 2020-2032
- 8.1. Market Analysis, Insights and Forecast - by Route of Administration
- 8.1.1. Oral
- 8.1.2. Parenteral
- 8.2. Market Analysis, Insights and Forecast - by Treatment Type
- 8.2.1. Substrate Reduction Therapy (SRT)
- 8.2.2. Enzyme Replacement Therapy (ERT)
- 8.2.3. Other Treatment Types
- 8.3. Market Analysis, Insights and Forecast - by End-User
- 8.3.1. Hospitals
- 8.3.2. Ambulatory Surgical Centers
- 8.3.3. Other End-Users
- 8.1. Market Analysis, Insights and Forecast - by Route of Administration
- 9. Asia Pacific Pompe Disease Treatment Industry Analysis, Insights and Forecast, 2020-2032
- 9.1. Market Analysis, Insights and Forecast - by Route of Administration
- 9.1.1. Oral
- 9.1.2. Parenteral
- 9.2. Market Analysis, Insights and Forecast - by Treatment Type
- 9.2.1. Substrate Reduction Therapy (SRT)
- 9.2.2. Enzyme Replacement Therapy (ERT)
- 9.2.3. Other Treatment Types
- 9.3. Market Analysis, Insights and Forecast - by End-User
- 9.3.1. Hospitals
- 9.3.2. Ambulatory Surgical Centers
- 9.3.3. Other End-Users
- 9.1. Market Analysis, Insights and Forecast - by Route of Administration
- 10. Middle East and Africa Pompe Disease Treatment Industry Analysis, Insights and Forecast, 2020-2032
- 10.1. Market Analysis, Insights and Forecast - by Route of Administration
- 10.1.1. Oral
- 10.1.2. Parenteral
- 10.2. Market Analysis, Insights and Forecast - by Treatment Type
- 10.2.1. Substrate Reduction Therapy (SRT)
- 10.2.2. Enzyme Replacement Therapy (ERT)
- 10.2.3. Other Treatment Types
- 10.3. Market Analysis, Insights and Forecast - by End-User
- 10.3.1. Hospitals
- 10.3.2. Ambulatory Surgical Centers
- 10.3.3. Other End-Users
- 10.1. Market Analysis, Insights and Forecast - by Route of Administration
- 11. South America Pompe Disease Treatment Industry Analysis, Insights and Forecast, 2020-2032
- 11.1. Market Analysis, Insights and Forecast - by Route of Administration
- 11.1.1. Oral
- 11.1.2. Parenteral
- 11.2. Market Analysis, Insights and Forecast - by Treatment Type
- 11.2.1. Substrate Reduction Therapy (SRT)
- 11.2.2. Enzyme Replacement Therapy (ERT)
- 11.2.3. Other Treatment Types
- 11.3. Market Analysis, Insights and Forecast - by End-User
- 11.3.1. Hospitals
- 11.3.2. Ambulatory Surgical Centers
- 11.3.3. Other End-Users
- 11.1. Market Analysis, Insights and Forecast - by Route of Administration
- 12. Competitive Analysis
- 12.1. Company Profiles
- 12.1.1 Astellas Pharma
- 12.1.1.1. Company Overview
- 12.1.1.2. Products
- 12.1.1.3. Company Financials
- 12.1.1.4. SWOT Analysis
- 12.1.2 Amicus Therapeutics
- 12.1.2.1. Company Overview
- 12.1.2.2. Products
- 12.1.2.3. Company Financials
- 12.1.2.4. SWOT Analysis
- 12.1.3 Sanofi
- 12.1.3.1. Company Overview
- 12.1.3.2. Products
- 12.1.3.3. Company Financials
- 12.1.3.4. SWOT Analysis
- 12.1.4 EpiVax Inc
- 12.1.4.1. Company Overview
- 12.1.4.2. Products
- 12.1.4.3. Company Financials
- 12.1.4.4. SWOT Analysis
- 12.1.5 AVROBIO Inc
- 12.1.5.1. Company Overview
- 12.1.5.2. Products
- 12.1.5.3. Company Financials
- 12.1.5.4. SWOT Analysis
- 12.1.6 Genethon
- 12.1.6.1. Company Overview
- 12.1.6.2. Products
- 12.1.6.3. Company Financials
- 12.1.6.4. SWOT Analysis
- 12.1.7 Oxyrane
- 12.1.7.1. Company Overview
- 12.1.7.2. Products
- 12.1.7.3. Company Financials
- 12.1.7.4. SWOT Analysis
- 12.1.1 Astellas Pharma
- 12.2. Market Entropy
- 12.2.1 Company's Key Areas Served
- 12.2.2 Recent Developments
- 12.3. Company Market Share Analysis 2025
- 12.3.1 Top 5 Companies Market Share Analysis
- 12.3.2 Top 3 Companies Market Share Analysis
- 12.4. List of Potential Customers
- 13. Research Methodology
List of Figures
- Figure 1: Global Pompe Disease Treatment Industry Revenue Breakdown (billion, %) by Region 2025 & 2033
- Figure 2: Global Pompe Disease Treatment Industry Volume Breakdown (K Unit, %) by Region 2025 & 2033
- Figure 3: North America Pompe Disease Treatment Industry Revenue (billion), by Route of Administration 2025 & 2033
- Figure 4: North America Pompe Disease Treatment Industry Volume (K Unit), by Route of Administration 2025 & 2033
- Figure 5: North America Pompe Disease Treatment Industry Revenue Share (%), by Route of Administration 2025 & 2033
- Figure 6: North America Pompe Disease Treatment Industry Volume Share (%), by Route of Administration 2025 & 2033
- Figure 7: North America Pompe Disease Treatment Industry Revenue (billion), by Treatment Type 2025 & 2033
- Figure 8: North America Pompe Disease Treatment Industry Volume (K Unit), by Treatment Type 2025 & 2033
- Figure 9: North America Pompe Disease Treatment Industry Revenue Share (%), by Treatment Type 2025 & 2033
- Figure 10: North America Pompe Disease Treatment Industry Volume Share (%), by Treatment Type 2025 & 2033
- Figure 11: North America Pompe Disease Treatment Industry Revenue (billion), by End-User 2025 & 2033
- Figure 12: North America Pompe Disease Treatment Industry Volume (K Unit), by End-User 2025 & 2033
- Figure 13: North America Pompe Disease Treatment Industry Revenue Share (%), by End-User 2025 & 2033
- Figure 14: North America Pompe Disease Treatment Industry Volume Share (%), by End-User 2025 & 2033
- Figure 15: North America Pompe Disease Treatment Industry Revenue (billion), by Country 2025 & 2033
- Figure 16: North America Pompe Disease Treatment Industry Volume (K Unit), by Country 2025 & 2033
- Figure 17: North America Pompe Disease Treatment Industry Revenue Share (%), by Country 2025 & 2033
- Figure 18: North America Pompe Disease Treatment Industry Volume Share (%), by Country 2025 & 2033
- Figure 19: Europe Pompe Disease Treatment Industry Revenue (billion), by Route of Administration 2025 & 2033
- Figure 20: Europe Pompe Disease Treatment Industry Volume (K Unit), by Route of Administration 2025 & 2033
- Figure 21: Europe Pompe Disease Treatment Industry Revenue Share (%), by Route of Administration 2025 & 2033
- Figure 22: Europe Pompe Disease Treatment Industry Volume Share (%), by Route of Administration 2025 & 2033
- Figure 23: Europe Pompe Disease Treatment Industry Revenue (billion), by Treatment Type 2025 & 2033
- Figure 24: Europe Pompe Disease Treatment Industry Volume (K Unit), by Treatment Type 2025 & 2033
- Figure 25: Europe Pompe Disease Treatment Industry Revenue Share (%), by Treatment Type 2025 & 2033
- Figure 26: Europe Pompe Disease Treatment Industry Volume Share (%), by Treatment Type 2025 & 2033
- Figure 27: Europe Pompe Disease Treatment Industry Revenue (billion), by End-User 2025 & 2033
- Figure 28: Europe Pompe Disease Treatment Industry Volume (K Unit), by End-User 2025 & 2033
- Figure 29: Europe Pompe Disease Treatment Industry Revenue Share (%), by End-User 2025 & 2033
- Figure 30: Europe Pompe Disease Treatment Industry Volume Share (%), by End-User 2025 & 2033
- Figure 31: Europe Pompe Disease Treatment Industry Revenue (billion), by Country 2025 & 2033
- Figure 32: Europe Pompe Disease Treatment Industry Volume (K Unit), by Country 2025 & 2033
- Figure 33: Europe Pompe Disease Treatment Industry Revenue Share (%), by Country 2025 & 2033
- Figure 34: Europe Pompe Disease Treatment Industry Volume Share (%), by Country 2025 & 2033
- Figure 35: Asia Pacific Pompe Disease Treatment Industry Revenue (billion), by Route of Administration 2025 & 2033
- Figure 36: Asia Pacific Pompe Disease Treatment Industry Volume (K Unit), by Route of Administration 2025 & 2033
- Figure 37: Asia Pacific Pompe Disease Treatment Industry Revenue Share (%), by Route of Administration 2025 & 2033
- Figure 38: Asia Pacific Pompe Disease Treatment Industry Volume Share (%), by Route of Administration 2025 & 2033
- Figure 39: Asia Pacific Pompe Disease Treatment Industry Revenue (billion), by Treatment Type 2025 & 2033
- Figure 40: Asia Pacific Pompe Disease Treatment Industry Volume (K Unit), by Treatment Type 2025 & 2033
- Figure 41: Asia Pacific Pompe Disease Treatment Industry Revenue Share (%), by Treatment Type 2025 & 2033
- Figure 42: Asia Pacific Pompe Disease Treatment Industry Volume Share (%), by Treatment Type 2025 & 2033
- Figure 43: Asia Pacific Pompe Disease Treatment Industry Revenue (billion), by End-User 2025 & 2033
- Figure 44: Asia Pacific Pompe Disease Treatment Industry Volume (K Unit), by End-User 2025 & 2033
- Figure 45: Asia Pacific Pompe Disease Treatment Industry Revenue Share (%), by End-User 2025 & 2033
- Figure 46: Asia Pacific Pompe Disease Treatment Industry Volume Share (%), by End-User 2025 & 2033
- Figure 47: Asia Pacific Pompe Disease Treatment Industry Revenue (billion), by Country 2025 & 2033
- Figure 48: Asia Pacific Pompe Disease Treatment Industry Volume (K Unit), by Country 2025 & 2033
- Figure 49: Asia Pacific Pompe Disease Treatment Industry Revenue Share (%), by Country 2025 & 2033
- Figure 50: Asia Pacific Pompe Disease Treatment Industry Volume Share (%), by Country 2025 & 2033
- Figure 51: Middle East and Africa Pompe Disease Treatment Industry Revenue (billion), by Route of Administration 2025 & 2033
- Figure 52: Middle East and Africa Pompe Disease Treatment Industry Volume (K Unit), by Route of Administration 2025 & 2033
- Figure 53: Middle East and Africa Pompe Disease Treatment Industry Revenue Share (%), by Route of Administration 2025 & 2033
- Figure 54: Middle East and Africa Pompe Disease Treatment Industry Volume Share (%), by Route of Administration 2025 & 2033
- Figure 55: Middle East and Africa Pompe Disease Treatment Industry Revenue (billion), by Treatment Type 2025 & 2033
- Figure 56: Middle East and Africa Pompe Disease Treatment Industry Volume (K Unit), by Treatment Type 2025 & 2033
- Figure 57: Middle East and Africa Pompe Disease Treatment Industry Revenue Share (%), by Treatment Type 2025 & 2033
- Figure 58: Middle East and Africa Pompe Disease Treatment Industry Volume Share (%), by Treatment Type 2025 & 2033
- Figure 59: Middle East and Africa Pompe Disease Treatment Industry Revenue (billion), by End-User 2025 & 2033
- Figure 60: Middle East and Africa Pompe Disease Treatment Industry Volume (K Unit), by End-User 2025 & 2033
- Figure 61: Middle East and Africa Pompe Disease Treatment Industry Revenue Share (%), by End-User 2025 & 2033
- Figure 62: Middle East and Africa Pompe Disease Treatment Industry Volume Share (%), by End-User 2025 & 2033
- Figure 63: Middle East and Africa Pompe Disease Treatment Industry Revenue (billion), by Country 2025 & 2033
- Figure 64: Middle East and Africa Pompe Disease Treatment Industry Volume (K Unit), by Country 2025 & 2033
- Figure 65: Middle East and Africa Pompe Disease Treatment Industry Revenue Share (%), by Country 2025 & 2033
- Figure 66: Middle East and Africa Pompe Disease Treatment Industry Volume Share (%), by Country 2025 & 2033
- Figure 67: South America Pompe Disease Treatment Industry Revenue (billion), by Route of Administration 2025 & 2033
- Figure 68: South America Pompe Disease Treatment Industry Volume (K Unit), by Route of Administration 2025 & 2033
- Figure 69: South America Pompe Disease Treatment Industry Revenue Share (%), by Route of Administration 2025 & 2033
- Figure 70: South America Pompe Disease Treatment Industry Volume Share (%), by Route of Administration 2025 & 2033
- Figure 71: South America Pompe Disease Treatment Industry Revenue (billion), by Treatment Type 2025 & 2033
- Figure 72: South America Pompe Disease Treatment Industry Volume (K Unit), by Treatment Type 2025 & 2033
- Figure 73: South America Pompe Disease Treatment Industry Revenue Share (%), by Treatment Type 2025 & 2033
- Figure 74: South America Pompe Disease Treatment Industry Volume Share (%), by Treatment Type 2025 & 2033
- Figure 75: South America Pompe Disease Treatment Industry Revenue (billion), by End-User 2025 & 2033
- Figure 76: South America Pompe Disease Treatment Industry Volume (K Unit), by End-User 2025 & 2033
- Figure 77: South America Pompe Disease Treatment Industry Revenue Share (%), by End-User 2025 & 2033
- Figure 78: South America Pompe Disease Treatment Industry Volume Share (%), by End-User 2025 & 2033
- Figure 79: South America Pompe Disease Treatment Industry Revenue (billion), by Country 2025 & 2033
- Figure 80: South America Pompe Disease Treatment Industry Volume (K Unit), by Country 2025 & 2033
- Figure 81: South America Pompe Disease Treatment Industry Revenue Share (%), by Country 2025 & 2033
- Figure 82: South America Pompe Disease Treatment Industry Volume Share (%), by Country 2025 & 2033
List of Tables
- Table 1: Global Pompe Disease Treatment Industry Revenue billion Forecast, by Route of Administration 2020 & 2033
- Table 2: Global Pompe Disease Treatment Industry Volume K Unit Forecast, by Route of Administration 2020 & 2033
- Table 3: Global Pompe Disease Treatment Industry Revenue billion Forecast, by Treatment Type 2020 & 2033
- Table 4: Global Pompe Disease Treatment Industry Volume K Unit Forecast, by Treatment Type 2020 & 2033
- Table 5: Global Pompe Disease Treatment Industry Revenue billion Forecast, by End-User 2020 & 2033
- Table 6: Global Pompe Disease Treatment Industry Volume K Unit Forecast, by End-User 2020 & 2033
- Table 7: Global Pompe Disease Treatment Industry Revenue billion Forecast, by Region 2020 & 2033
- Table 8: Global Pompe Disease Treatment Industry Volume K Unit Forecast, by Region 2020 & 2033
- Table 9: Global Pompe Disease Treatment Industry Revenue billion Forecast, by Route of Administration 2020 & 2033
- Table 10: Global Pompe Disease Treatment Industry Volume K Unit Forecast, by Route of Administration 2020 & 2033
- Table 11: Global Pompe Disease Treatment Industry Revenue billion Forecast, by Treatment Type 2020 & 2033
- Table 12: Global Pompe Disease Treatment Industry Volume K Unit Forecast, by Treatment Type 2020 & 2033
- Table 13: Global Pompe Disease Treatment Industry Revenue billion Forecast, by End-User 2020 & 2033
- Table 14: Global Pompe Disease Treatment Industry Volume K Unit Forecast, by End-User 2020 & 2033
- Table 15: Global Pompe Disease Treatment Industry Revenue billion Forecast, by Country 2020 & 2033
- Table 16: Global Pompe Disease Treatment Industry Volume K Unit Forecast, by Country 2020 & 2033
- Table 17: United States Pompe Disease Treatment Industry Revenue (billion) Forecast, by Application 2020 & 2033
- Table 18: United States Pompe Disease Treatment Industry Volume (K Unit) Forecast, by Application 2020 & 2033
- Table 19: Canada Pompe Disease Treatment Industry Revenue (billion) Forecast, by Application 2020 & 2033
- Table 20: Canada Pompe Disease Treatment Industry Volume (K Unit) Forecast, by Application 2020 & 2033
- Table 21: Mexico Pompe Disease Treatment Industry Revenue (billion) Forecast, by Application 2020 & 2033
- Table 22: Mexico Pompe Disease Treatment Industry Volume (K Unit) Forecast, by Application 2020 & 2033
- Table 23: Global Pompe Disease Treatment Industry Revenue billion Forecast, by Route of Administration 2020 & 2033
- Table 24: Global Pompe Disease Treatment Industry Volume K Unit Forecast, by Route of Administration 2020 & 2033
- Table 25: Global Pompe Disease Treatment Industry Revenue billion Forecast, by Treatment Type 2020 & 2033
- Table 26: Global Pompe Disease Treatment Industry Volume K Unit Forecast, by Treatment Type 2020 & 2033
- Table 27: Global Pompe Disease Treatment Industry Revenue billion Forecast, by End-User 2020 & 2033
- Table 28: Global Pompe Disease Treatment Industry Volume K Unit Forecast, by End-User 2020 & 2033
- Table 29: Global Pompe Disease Treatment Industry Revenue billion Forecast, by Country 2020 & 2033
- Table 30: Global Pompe Disease Treatment Industry Volume K Unit Forecast, by Country 2020 & 2033
- Table 31: Germany Pompe Disease Treatment Industry Revenue (billion) Forecast, by Application 2020 & 2033
- Table 32: Germany Pompe Disease Treatment Industry Volume (K Unit) Forecast, by Application 2020 & 2033
- Table 33: United Kingdom Pompe Disease Treatment Industry Revenue (billion) Forecast, by Application 2020 & 2033
- Table 34: United Kingdom Pompe Disease Treatment Industry Volume (K Unit) Forecast, by Application 2020 & 2033
- Table 35: France Pompe Disease Treatment Industry Revenue (billion) Forecast, by Application 2020 & 2033
- Table 36: France Pompe Disease Treatment Industry Volume (K Unit) Forecast, by Application 2020 & 2033
- Table 37: Italy Pompe Disease Treatment Industry Revenue (billion) Forecast, by Application 2020 & 2033
- Table 38: Italy Pompe Disease Treatment Industry Volume (K Unit) Forecast, by Application 2020 & 2033
- Table 39: Spain Pompe Disease Treatment Industry Revenue (billion) Forecast, by Application 2020 & 2033
- Table 40: Spain Pompe Disease Treatment Industry Volume (K Unit) Forecast, by Application 2020 & 2033
- Table 41: Rest of Europe Pompe Disease Treatment Industry Revenue (billion) Forecast, by Application 2020 & 2033
- Table 42: Rest of Europe Pompe Disease Treatment Industry Volume (K Unit) Forecast, by Application 2020 & 2033
- Table 43: Global Pompe Disease Treatment Industry Revenue billion Forecast, by Route of Administration 2020 & 2033
- Table 44: Global Pompe Disease Treatment Industry Volume K Unit Forecast, by Route of Administration 2020 & 2033
- Table 45: Global Pompe Disease Treatment Industry Revenue billion Forecast, by Treatment Type 2020 & 2033
- Table 46: Global Pompe Disease Treatment Industry Volume K Unit Forecast, by Treatment Type 2020 & 2033
- Table 47: Global Pompe Disease Treatment Industry Revenue billion Forecast, by End-User 2020 & 2033
- Table 48: Global Pompe Disease Treatment Industry Volume K Unit Forecast, by End-User 2020 & 2033
- Table 49: Global Pompe Disease Treatment Industry Revenue billion Forecast, by Country 2020 & 2033
- Table 50: Global Pompe Disease Treatment Industry Volume K Unit Forecast, by Country 2020 & 2033
- Table 51: China Pompe Disease Treatment Industry Revenue (billion) Forecast, by Application 2020 & 2033
- Table 52: China Pompe Disease Treatment Industry Volume (K Unit) Forecast, by Application 2020 & 2033
- Table 53: Japan Pompe Disease Treatment Industry Revenue (billion) Forecast, by Application 2020 & 2033
- Table 54: Japan Pompe Disease Treatment Industry Volume (K Unit) Forecast, by Application 2020 & 2033
- Table 55: India Pompe Disease Treatment Industry Revenue (billion) Forecast, by Application 2020 & 2033
- Table 56: India Pompe Disease Treatment Industry Volume (K Unit) Forecast, by Application 2020 & 2033
- Table 57: Australia Pompe Disease Treatment Industry Revenue (billion) Forecast, by Application 2020 & 2033
- Table 58: Australia Pompe Disease Treatment Industry Volume (K Unit) Forecast, by Application 2020 & 2033
- Table 59: South Korea Pompe Disease Treatment Industry Revenue (billion) Forecast, by Application 2020 & 2033
- Table 60: South Korea Pompe Disease Treatment Industry Volume (K Unit) Forecast, by Application 2020 & 2033
- Table 61: Rest of Asia Pacific Pompe Disease Treatment Industry Revenue (billion) Forecast, by Application 2020 & 2033
- Table 62: Rest of Asia Pacific Pompe Disease Treatment Industry Volume (K Unit) Forecast, by Application 2020 & 2033
- Table 63: Global Pompe Disease Treatment Industry Revenue billion Forecast, by Route of Administration 2020 & 2033
- Table 64: Global Pompe Disease Treatment Industry Volume K Unit Forecast, by Route of Administration 2020 & 2033
- Table 65: Global Pompe Disease Treatment Industry Revenue billion Forecast, by Treatment Type 2020 & 2033
- Table 66: Global Pompe Disease Treatment Industry Volume K Unit Forecast, by Treatment Type 2020 & 2033
- Table 67: Global Pompe Disease Treatment Industry Revenue billion Forecast, by End-User 2020 & 2033
- Table 68: Global Pompe Disease Treatment Industry Volume K Unit Forecast, by End-User 2020 & 2033
- Table 69: Global Pompe Disease Treatment Industry Revenue billion Forecast, by Country 2020 & 2033
- Table 70: Global Pompe Disease Treatment Industry Volume K Unit Forecast, by Country 2020 & 2033
- Table 71: GCC Pompe Disease Treatment Industry Revenue (billion) Forecast, by Application 2020 & 2033
- Table 72: GCC Pompe Disease Treatment Industry Volume (K Unit) Forecast, by Application 2020 & 2033
- Table 73: South Africa Pompe Disease Treatment Industry Revenue (billion) Forecast, by Application 2020 & 2033
- Table 74: South Africa Pompe Disease Treatment Industry Volume (K Unit) Forecast, by Application 2020 & 2033
- Table 75: Rest of Middle East and Africa Pompe Disease Treatment Industry Revenue (billion) Forecast, by Application 2020 & 2033
- Table 76: Rest of Middle East and Africa Pompe Disease Treatment Industry Volume (K Unit) Forecast, by Application 2020 & 2033
- Table 77: Global Pompe Disease Treatment Industry Revenue billion Forecast, by Route of Administration 2020 & 2033
- Table 78: Global Pompe Disease Treatment Industry Volume K Unit Forecast, by Route of Administration 2020 & 2033
- Table 79: Global Pompe Disease Treatment Industry Revenue billion Forecast, by Treatment Type 2020 & 2033
- Table 80: Global Pompe Disease Treatment Industry Volume K Unit Forecast, by Treatment Type 2020 & 2033
- Table 81: Global Pompe Disease Treatment Industry Revenue billion Forecast, by End-User 2020 & 2033
- Table 82: Global Pompe Disease Treatment Industry Volume K Unit Forecast, by End-User 2020 & 2033
- Table 83: Global Pompe Disease Treatment Industry Revenue billion Forecast, by Country 2020 & 2033
- Table 84: Global Pompe Disease Treatment Industry Volume K Unit Forecast, by Country 2020 & 2033
- Table 85: Brazil Pompe Disease Treatment Industry Revenue (billion) Forecast, by Application 2020 & 2033
- Table 86: Brazil Pompe Disease Treatment Industry Volume (K Unit) Forecast, by Application 2020 & 2033
- Table 87: Argentina Pompe Disease Treatment Industry Revenue (billion) Forecast, by Application 2020 & 2033
- Table 88: Argentina Pompe Disease Treatment Industry Volume (K Unit) Forecast, by Application 2020 & 2033
- Table 89: Rest of South America Pompe Disease Treatment Industry Revenue (billion) Forecast, by Application 2020 & 2033
- Table 90: Rest of South America Pompe Disease Treatment Industry Volume (K Unit) Forecast, by Application 2020 & 2033
Frequently Asked Questions
1. What is the projected Compound Annual Growth Rate (CAGR) of the Pompe Disease Treatment Industry?
The projected CAGR is approximately 4.4%.
2. Which companies are prominent players in the Pompe Disease Treatment Industry?
Key companies in the market include Astellas Pharma, Amicus Therapeutics, Sanofi, EpiVax Inc, AVROBIO Inc , Genethon, Oxyrane.
3. What are the main segments of the Pompe Disease Treatment Industry?
The market segments include Route of Administration, Treatment Type, End-User.
4. Can you provide details about the market size?
The market size is estimated to be USD 1.6 billion as of 2022.
5. What are some drivers contributing to market growth?
Launch of Novel Drugs; Continued Uptake of Long Term Therapies.
6. What are the notable trends driving market growth?
Enzyme Replacement Therapy (ERT) Segment is Estimated to Witness a Considerable Growth Over the Forecast Period.
7. Are there any restraints impacting market growth?
High Treatment Cost.
8. Can you provide examples of recent developments in the market?
June 2022: The European Commission granted marketing authorization for Nexvia Dyme (alglucosidase alfa), an enzyme replacement therapy (ERT) for the long-term treatment of both late-onset and infantile-onset Pompe disease, a rare, progressive, and debilitating muscle disorder.
9. What pricing options are available for accessing the report?
Pricing options include single-user, multi-user, and enterprise licenses priced at USD 4750, USD 5250, and USD 8750 respectively.
10. Is the market size provided in terms of value or volume?
The market size is provided in terms of value, measured in billion and volume, measured in K Unit.
11. Are there any specific market keywords associated with the report?
Yes, the market keyword associated with the report is "Pompe Disease Treatment Industry," which aids in identifying and referencing the specific market segment covered.
12. How do I determine which pricing option suits my needs best?
The pricing options vary based on user requirements and access needs. Individual users may opt for single-user licenses, while businesses requiring broader access may choose multi-user or enterprise licenses for cost-effective access to the report.
13. Are there any additional resources or data provided in the Pompe Disease Treatment Industry report?
While the report offers comprehensive insights, it's advisable to review the specific contents or supplementary materials provided to ascertain if additional resources or data are available.
14. How can I stay updated on further developments or reports in the Pompe Disease Treatment Industry?
To stay informed about further developments, trends, and reports in the Pompe Disease Treatment Industry, consider subscribing to industry newsletters, following relevant companies and organizations, or regularly checking reputable industry news sources and publications.
Methodology
Step 1 - Identification of Relevant Samples Size from Population Database


Step 2 - Approaches for Defining Global Market Size (Value, Volume* & Price*)

Note*: In applicable scenarios
Step 3 - Data Sources
Primary Research
- Web Analytics
- Survey Reports
- Research Institute
- Latest Research Reports
- Opinion Leaders
Secondary Research
- Annual Reports
- White Paper
- Latest Press Release
- Industry Association
- Paid Database
- Investor Presentations

Step 4 - Data Triangulation
Involves using different sources of information in order to increase the validity of a study
These sources are likely to be stakeholders in a program - participants, other researchers, program staff, other community members, and so on.
Then we put all data in single framework & apply various statistical tools to find out the dynamic on the market.
During the analysis stage, feedback from the stakeholder groups would be compared to determine areas of agreement as well as areas of divergence