

Key Insights
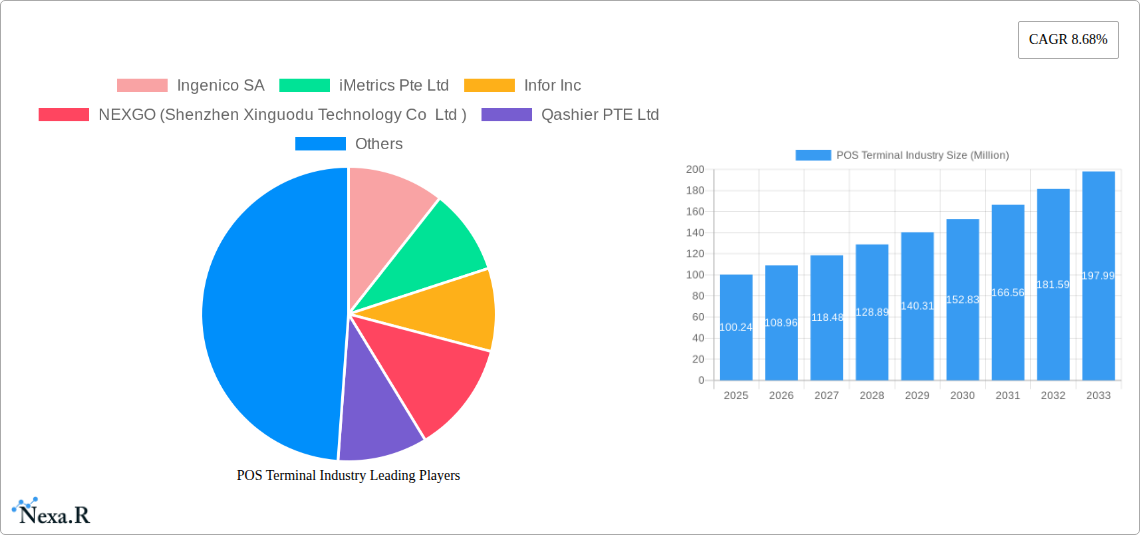
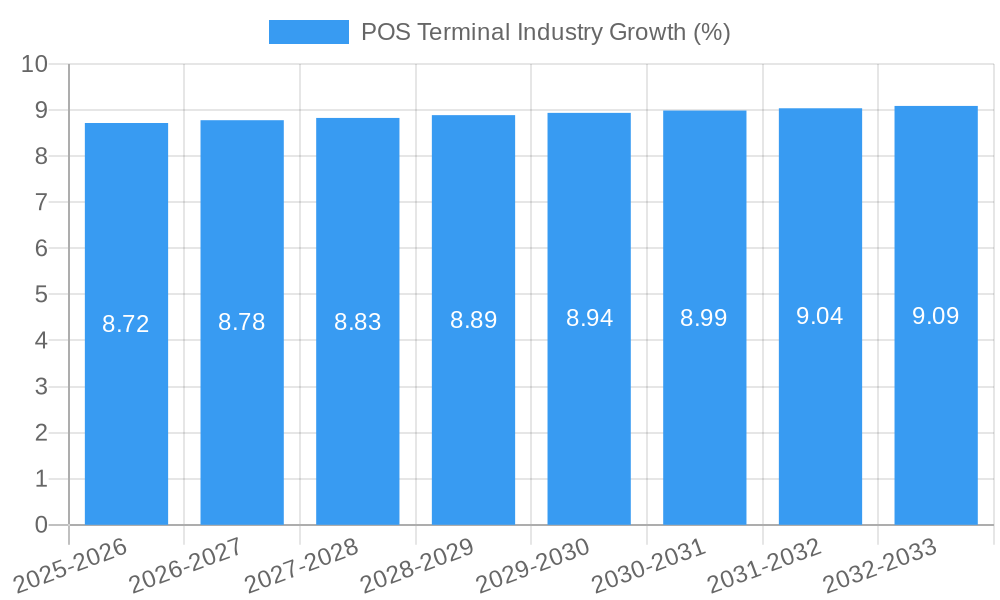
The global Point of Sale (POS) terminal market, valued at $100.24 million in 2025, is projected to experience robust growth, driven by the increasing adoption of digital payment methods across various industries. A Compound Annual Growth Rate (CAGR) of 8.68% from 2025 to 2033 indicates a significant market expansion, fueled by factors such as the rising demand for contactless payments, the proliferation of omnichannel retail strategies, and the increasing need for efficient inventory management and sales tracking. The market segmentation reveals strong growth potential across hardware, software, and services components, with mobile/portable POS terminals gaining traction due to their flexibility and portability, particularly beneficial for businesses operating in diverse settings. Key end-user industries such as retail, hospitality, and healthcare are significant contributors to market growth, each demonstrating unique adoption patterns and technological preferences. The competitive landscape is characterized by established players like Ingenico, NCR, and Verifone, alongside emerging technology providers, indicating a dynamic market ripe for innovation and expansion. Continued technological advancements, including the integration of Artificial Intelligence (AI) and Internet of Things (IoT) capabilities within POS systems, are expected to further drive market expansion.
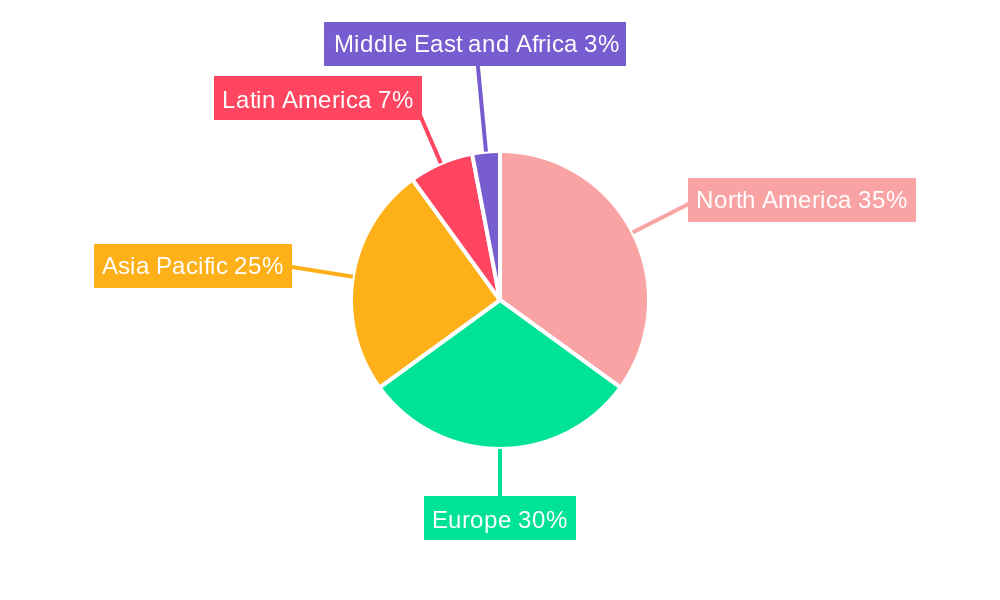
The sustained growth of e-commerce and the increasing preference for cashless transactions are key factors contributing to the market's expansion. Further growth will be driven by the growing adoption of cloud-based POS solutions offering enhanced scalability, data analytics, and cost-effectiveness. While challenges like the initial investment costs and cybersecurity concerns exist, the long-term benefits of improved operational efficiency, enhanced customer experience, and valuable data insights are anticipated to outweigh these concerns. The geographical distribution of market share will likely see continued dominance by North America and Europe, though the Asia-Pacific region is expected to show significant growth potential due to rapid economic expansion and increasing digitalization across emerging markets. This positive outlook suggests a promising future for the POS terminal industry, with ample opportunities for growth and innovation across all segments and regions.
POS Terminal Industry Market Report: 2019-2033
This comprehensive report provides an in-depth analysis of the POS terminal industry, encompassing market dynamics, growth trends, regional dominance, product landscape, key players, and future outlook. With a study period spanning 2019-2033, a base year of 2025, and a forecast period of 2025-2033, this report is an essential resource for industry professionals, investors, and strategic decision-makers. The report segments the market by component (hardware, software, services), type (fixed and mobile/portable POS terminals), and end-user industries (retail, hospitality, healthcare, entertainment, and others). The global market size is projected to reach xx million units by 2033.
POS Terminal Industry Market Dynamics & Structure
The POS terminal market is characterized by moderate concentration, with several major players holding significant market share, but a sizable number of smaller, specialized vendors also contributing. Technological innovation, driven by the need for enhanced security, faster processing speeds, and integrated functionalities, is a key market driver. Regulatory frameworks, particularly concerning data security and payment compliance (e.g., PCI DSS), significantly influence market dynamics. Competitive product substitutes, such as mobile payment systems, pose a challenge, while the increasing adoption of cloud-based POS systems presents new opportunities. End-user demographics, particularly the growth of e-commerce and omnichannel retail strategies, are shaping market demand. M&A activity in the industry has been moderate in recent years, with xx deals recorded between 2019 and 2024, primarily focused on expanding product portfolios and geographic reach.
- Market Concentration: Moderately concentrated, with top 5 players holding approximately xx% market share in 2024.
- Technological Innovation: Focus on contactless payments, cloud integration, and AI-powered analytics.
- Regulatory Landscape: Strict compliance standards driving investment in secure POS solutions.
- Competitive Substitutes: Mobile payment apps and online payment gateways.
- M&A Activity: xx deals between 2019 and 2024, primarily driven by expansion and technology acquisition.
- Innovation Barriers: High initial investment costs and integration complexities.
POS Terminal Industry Growth Trends & Insights
The POS terminal market experienced robust growth during the historical period (2019-2024), driven by increasing retail digitization and the expansion of e-commerce. The market size reached xx million units in 2024, exhibiting a CAGR of xx%. Adoption rates are highest in developed economies but are rapidly increasing in emerging markets fueled by growing smartphone penetration and rising internet usage. Technological disruptions, such as the introduction of contactless payments and cloud-based POS solutions, significantly influence growth. Consumer behavior shifts towards convenience and personalized shopping experiences further fuel demand. The forecast period (2025-2033) projects continued growth, with a projected CAGR of xx%, reaching xx million units by 2033. Market penetration is expected to increase significantly in underserved regions.
Dominant Regions, Countries, or Segments in POS Terminal Industry
The North American and European regions currently dominate the POS terminal market, accounting for approximately xx% of the global market share in 2024. Within these regions, retail and hospitality sectors are the major end-users. However, the Asia-Pacific region demonstrates the highest growth potential due to its rapidly expanding economies and rising consumer spending.
By Component:
- Hardware: Remains the largest segment, with xx million units shipped in 2024.
- Software: Shows significant growth, driven by the increasing adoption of cloud-based solutions.
- Services: Expanding rapidly as businesses prioritize integrated solutions and ongoing support.
By Type:
- Fixed POS Terminals: Maintain significant market share due to their reliability and stability.
- Mobile/Portable POS Terminals: Experience rapid growth, driven by the increasing demand for omnichannel solutions.
By End-user Industries:
- Retail: Largest end-user segment, accounting for xx% of the market in 2024.
- Hospitality: Strong growth driven by the increasing adoption of mobile payment options.
- Healthcare: Growing segment due to the increasing need for efficient billing and payment processing.
POS Terminal Industry Product Landscape
The POS terminal market offers a wide range of products, from basic, entry-level models to sophisticated, feature-rich systems. Recent innovations include integrated payment processing, enhanced security features (e.g., EMV compliance, tokenization), improved user interfaces, and mobile connectivity. Key features driving product differentiation include speed, reliability, ease of use, security, and integration with other business systems. The increasing adoption of cloud-based solutions is transforming the product landscape, offering improved scalability and data management capabilities.
Key Drivers, Barriers & Challenges in POS Terminal Industry
Key Drivers:
- Growing adoption of digital payments.
- Expansion of omnichannel retail strategies.
- Increasing demand for contactless payment options.
- Rising need for improved data security and compliance.
Key Challenges:
- High initial investment costs for businesses.
- Integration complexities with existing systems.
- Cybersecurity threats and data breaches.
- Competition from mobile payment solutions.
Emerging Opportunities in POS Terminal Industry
- Growing adoption of IoT-enabled POS terminals offering real-time data analytics and inventory management.
- Expanding demand for integrated POS solutions in emerging markets.
- Increased focus on developing customized solutions tailored to specific industry needs.
- Growing adoption of biometric authentication for enhanced security.
Growth Accelerators in the POS Terminal Industry Industry
The long-term growth of the POS terminal market will be fueled by several factors, including continued advancements in payment technologies, the expansion of cloud-based solutions, strategic partnerships between hardware and software providers, and the increasing adoption of omnichannel strategies by businesses across various industries. Government initiatives promoting digitalization and financial inclusion in developing economies will also play a significant role.
Key Players Shaping the POS Terminal Industry Market
- Ingenico Group
- iMetrics Pte Ltd
- Infor Inc
- NEXGO (Shenzhen Xinguodu Technology Co Ltd)
- Qashier PTE Ltd
- GK Software SE
- Agilysys Inc
- Newland Payment Technology
- Fujitsu Ltd
- PCMS Group Ltd
- Cegid Group
- HP Development Company LP
- Samsung Electronics Co Ltd
- NCR Corporation
- Cow Hills Retail BV
- Toshiba Global Commerce Solutions
- Bindo Labs Inc
- Aptos Inc
- Toshiba Tec Corporation
- NEC Corporation
- Ctac NV
- Oracle (Micros Retail Systems Inc)
- VeriFone Systems Inc
- Diebold Nixdorf
- Casio Computer Co Ltd
- PAX Technology
- Panasonic Corporation
Notable Milestones in POS Terminal Industry Sector
- September 2022: Newland Payment Technology showcased its SmartPOS and classic payment devices at Paris Retail Week 2022, highlighting its commitment to innovation.
- August 2022: GK Software partnered with the Schwarz Group to convert its point-of-sale software to the CLOUD4RETAIL platform.
In-Depth POS Terminal Industry Market Outlook
The POS terminal market is poised for continued strong growth over the forecast period, driven by technological advancements, increasing demand for secure and efficient payment solutions, and the expansion of e-commerce. Strategic opportunities exist for companies that can offer innovative, integrated solutions, tailored to the specific needs of various industries. Focus on cloud-based solutions, enhanced security features, and data analytics capabilities will be key to success in this dynamic market.
POS Terminal Industry Segmentation
-
1. Component
- 1.1. Hardware
- 1.2. Software
- 1.3. Services
-
2. Type
- 2.1. Fixed Point-of-Sale Terminals
- 2.2. Mobile/Portable Point-of-Sale Terminals
-
3. End-user Industries
- 3.1. Entertainment
- 3.2. Hospitality
- 3.3. Healthcare
- 3.4. Retail
- 3.5. Other End-user Industries
POS Terminal Industry Segmentation By Geography
- 1. North America
- 2. Europe
- 3. Asia
- 4. Australia and New Zealand
- 5. Latin America
- 6. Middle East and Africa
POS Terminal Industry REPORT HIGHLIGHTS
| Aspects | Details |
|---|---|
| Study Period | 2019-2033 |
| Base Year | 2024 |
| Estimated Year | 2025 |
| Forecast Period | 2025-2033 |
| Historical Period | 2019-2024 |
| Growth Rate | CAGR of 8.68% from 2019-2033 |
| Segmentation |
|
Table of Contents
- 1. Introduction
- 1.1. Research Scope
- 1.2. Market Segmentation
- 1.3. Research Methodology
- 1.4. Definitions and Assumptions
- 2. Executive Summary
- 2.1. Introduction
- 3. Market Dynamics
- 3.1. Introduction
- 3.2. Market Drivers
- 3.2.1. Growing Adoption of POS Terminals in the Retail Sector; Rising Adoption of Cloud-based Platforms
- 3.3. Market Restrains
- 3.3.1. Rising Complexities to Implement Transition from Manual to Software Testing Process
- 3.4. Market Trends
- 3.4.1. Hardware Segment to Account for the Largest Market Share
- 4. Market Factor Analysis
- 4.1. Porters Five Forces
- 4.2. Supply/Value Chain
- 4.3. PESTEL analysis
- 4.4. Market Entropy
- 4.5. Patent/Trademark Analysis
- 5. Global POS Terminal Industry Analysis, Insights and Forecast, 2019-2031
- 5.1. Market Analysis, Insights and Forecast - by Component
- 5.1.1. Hardware
- 5.1.2. Software
- 5.1.3. Services
- 5.2. Market Analysis, Insights and Forecast - by Type
- 5.2.1. Fixed Point-of-Sale Terminals
- 5.2.2. Mobile/Portable Point-of-Sale Terminals
- 5.3. Market Analysis, Insights and Forecast - by End-user Industries
- 5.3.1. Entertainment
- 5.3.2. Hospitality
- 5.3.3. Healthcare
- 5.3.4. Retail
- 5.3.5. Other End-user Industries
- 5.4. Market Analysis, Insights and Forecast - by Region
- 5.4.1. North America
- 5.4.2. Europe
- 5.4.3. Asia
- 5.4.4. Australia and New Zealand
- 5.4.5. Latin America
- 5.4.6. Middle East and Africa
- 5.1. Market Analysis, Insights and Forecast - by Component
- 6. North America POS Terminal Industry Analysis, Insights and Forecast, 2019-2031
- 6.1. Market Analysis, Insights and Forecast - by Component
- 6.1.1. Hardware
- 6.1.2. Software
- 6.1.3. Services
- 6.2. Market Analysis, Insights and Forecast - by Type
- 6.2.1. Fixed Point-of-Sale Terminals
- 6.2.2. Mobile/Portable Point-of-Sale Terminals
- 6.3. Market Analysis, Insights and Forecast - by End-user Industries
- 6.3.1. Entertainment
- 6.3.2. Hospitality
- 6.3.3. Healthcare
- 6.3.4. Retail
- 6.3.5. Other End-user Industries
- 6.1. Market Analysis, Insights and Forecast - by Component
- 7. Europe POS Terminal Industry Analysis, Insights and Forecast, 2019-2031
- 7.1. Market Analysis, Insights and Forecast - by Component
- 7.1.1. Hardware
- 7.1.2. Software
- 7.1.3. Services
- 7.2. Market Analysis, Insights and Forecast - by Type
- 7.2.1. Fixed Point-of-Sale Terminals
- 7.2.2. Mobile/Portable Point-of-Sale Terminals
- 7.3. Market Analysis, Insights and Forecast - by End-user Industries
- 7.3.1. Entertainment
- 7.3.2. Hospitality
- 7.3.3. Healthcare
- 7.3.4. Retail
- 7.3.5. Other End-user Industries
- 7.1. Market Analysis, Insights and Forecast - by Component
- 8. Asia POS Terminal Industry Analysis, Insights and Forecast, 2019-2031
- 8.1. Market Analysis, Insights and Forecast - by Component
- 8.1.1. Hardware
- 8.1.2. Software
- 8.1.3. Services
- 8.2. Market Analysis, Insights and Forecast - by Type
- 8.2.1. Fixed Point-of-Sale Terminals
- 8.2.2. Mobile/Portable Point-of-Sale Terminals
- 8.3. Market Analysis, Insights and Forecast - by End-user Industries
- 8.3.1. Entertainment
- 8.3.2. Hospitality
- 8.3.3. Healthcare
- 8.3.4. Retail
- 8.3.5. Other End-user Industries
- 8.1. Market Analysis, Insights and Forecast - by Component
- 9. Australia and New Zealand POS Terminal Industry Analysis, Insights and Forecast, 2019-2031
- 9.1. Market Analysis, Insights and Forecast - by Component
- 9.1.1. Hardware
- 9.1.2. Software
- 9.1.3. Services
- 9.2. Market Analysis, Insights and Forecast - by Type
- 9.2.1. Fixed Point-of-Sale Terminals
- 9.2.2. Mobile/Portable Point-of-Sale Terminals
- 9.3. Market Analysis, Insights and Forecast - by End-user Industries
- 9.3.1. Entertainment
- 9.3.2. Hospitality
- 9.3.3. Healthcare
- 9.3.4. Retail
- 9.3.5. Other End-user Industries
- 9.1. Market Analysis, Insights and Forecast - by Component
- 10. Latin America POS Terminal Industry Analysis, Insights and Forecast, 2019-2031
- 10.1. Market Analysis, Insights and Forecast - by Component
- 10.1.1. Hardware
- 10.1.2. Software
- 10.1.3. Services
- 10.2. Market Analysis, Insights and Forecast - by Type
- 10.2.1. Fixed Point-of-Sale Terminals
- 10.2.2. Mobile/Portable Point-of-Sale Terminals
- 10.3. Market Analysis, Insights and Forecast - by End-user Industries
- 10.3.1. Entertainment
- 10.3.2. Hospitality
- 10.3.3. Healthcare
- 10.3.4. Retail
- 10.3.5. Other End-user Industries
- 10.1. Market Analysis, Insights and Forecast - by Component
- 11. Middle East and Africa POS Terminal Industry Analysis, Insights and Forecast, 2019-2031
- 11.1. Market Analysis, Insights and Forecast - by Component
- 11.1.1. Hardware
- 11.1.2. Software
- 11.1.3. Services
- 11.2. Market Analysis, Insights and Forecast - by Type
- 11.2.1. Fixed Point-of-Sale Terminals
- 11.2.2. Mobile/Portable Point-of-Sale Terminals
- 11.3. Market Analysis, Insights and Forecast - by End-user Industries
- 11.3.1. Entertainment
- 11.3.2. Hospitality
- 11.3.3. Healthcare
- 11.3.4. Retail
- 11.3.5. Other End-user Industries
- 11.1. Market Analysis, Insights and Forecast - by Component
- 12. North America POS Terminal Industry Analysis, Insights and Forecast, 2019-2031
- 12.1. Market Analysis, Insights and Forecast - By Country/Sub-region
- 12.1.1.
- 13. Europe POS Terminal Industry Analysis, Insights and Forecast, 2019-2031
- 13.1. Market Analysis, Insights and Forecast - By Country/Sub-region
- 13.1.1.
- 14. Asia Pacific POS Terminal Industry Analysis, Insights and Forecast, 2019-2031
- 14.1. Market Analysis, Insights and Forecast - By Country/Sub-region
- 14.1.1.
- 15. Latin America POS Terminal Industry Analysis, Insights and Forecast, 2019-2031
- 15.1. Market Analysis, Insights and Forecast - By Country/Sub-region
- 15.1.1.
- 16. Middle East and Africa POS Terminal Industry Analysis, Insights and Forecast, 2019-2031
- 16.1. Market Analysis, Insights and Forecast - By Country/Sub-region
- 16.1.1.
- 17. Competitive Analysis
- 17.1. Global Market Share Analysis 2024
- 17.2. Company Profiles
- 17.2.1 Ingenico SA
- 17.2.1.1. Overview
- 17.2.1.2. Products
- 17.2.1.3. SWOT Analysis
- 17.2.1.4. Recent Developments
- 17.2.1.5. Financials (Based on Availability)
- 17.2.2 iMetrics Pte Ltd
- 17.2.2.1. Overview
- 17.2.2.2. Products
- 17.2.2.3. SWOT Analysis
- 17.2.2.4. Recent Developments
- 17.2.2.5. Financials (Based on Availability)
- 17.2.3 Infor Inc
- 17.2.3.1. Overview
- 17.2.3.2. Products
- 17.2.3.3. SWOT Analysis
- 17.2.3.4. Recent Developments
- 17.2.3.5. Financials (Based on Availability)
- 17.2.4 NEXGO (Shenzhen Xinguodu Technology Co Ltd )
- 17.2.4.1. Overview
- 17.2.4.2. Products
- 17.2.4.3. SWOT Analysis
- 17.2.4.4. Recent Developments
- 17.2.4.5. Financials (Based on Availability)
- 17.2.5 Qashier PTE Ltd
- 17.2.5.1. Overview
- 17.2.5.2. Products
- 17.2.5.3. SWOT Analysis
- 17.2.5.4. Recent Developments
- 17.2.5.5. Financials (Based on Availability)
- 17.2.6 GK Software SE
- 17.2.6.1. Overview
- 17.2.6.2. Products
- 17.2.6.3. SWOT Analysis
- 17.2.6.4. Recent Developments
- 17.2.6.5. Financials (Based on Availability)
- 17.2.7 Agilysys Inc
- 17.2.7.1. Overview
- 17.2.7.2. Products
- 17.2.7.3. SWOT Analysis
- 17.2.7.4. Recent Developments
- 17.2.7.5. Financials (Based on Availability)
- 17.2.8 Newland Payment Technology
- 17.2.8.1. Overview
- 17.2.8.2. Products
- 17.2.8.3. SWOT Analysis
- 17.2.8.4. Recent Developments
- 17.2.8.5. Financials (Based on Availability)
- 17.2.9 Fujitsu Ltd
- 17.2.9.1. Overview
- 17.2.9.2. Products
- 17.2.9.3. SWOT Analysis
- 17.2.9.4. Recent Developments
- 17.2.9.5. Financials (Based on Availability)
- 17.2.10 PCMS Group Ltd
- 17.2.10.1. Overview
- 17.2.10.2. Products
- 17.2.10.3. SWOT Analysis
- 17.2.10.4. Recent Developments
- 17.2.10.5. Financials (Based on Availability)
- 17.2.11 Cegid Group
- 17.2.11.1. Overview
- 17.2.11.2. Products
- 17.2.11.3. SWOT Analysis
- 17.2.11.4. Recent Developments
- 17.2.11.5. Financials (Based on Availability)
- 17.2.12 HP Development Company LP
- 17.2.12.1. Overview
- 17.2.12.2. Products
- 17.2.12.3. SWOT Analysis
- 17.2.12.4. Recent Developments
- 17.2.12.5. Financials (Based on Availability)
- 17.2.13 Samsung Electronics Co Ltd
- 17.2.13.1. Overview
- 17.2.13.2. Products
- 17.2.13.3. SWOT Analysis
- 17.2.13.4. Recent Developments
- 17.2.13.5. Financials (Based on Availability)
- 17.2.14 NCR Corporation
- 17.2.14.1. Overview
- 17.2.14.2. Products
- 17.2.14.3. SWOT Analysis
- 17.2.14.4. Recent Developments
- 17.2.14.5. Financials (Based on Availability)
- 17.2.15 Cow Hills Retail BV
- 17.2.15.1. Overview
- 17.2.15.2. Products
- 17.2.15.3. SWOT Analysis
- 17.2.15.4. Recent Developments
- 17.2.15.5. Financials (Based on Availability)
- 17.2.16 Toshiba Global Commerce Solutions
- 17.2.16.1. Overview
- 17.2.16.2. Products
- 17.2.16.3. SWOT Analysis
- 17.2.16.4. Recent Developments
- 17.2.16.5. Financials (Based on Availability)
- 17.2.17 Bindo Labs Inc
- 17.2.17.1. Overview
- 17.2.17.2. Products
- 17.2.17.3. SWOT Analysis
- 17.2.17.4. Recent Developments
- 17.2.17.5. Financials (Based on Availability)
- 17.2.18 Aptos Inc
- 17.2.18.1. Overview
- 17.2.18.2. Products
- 17.2.18.3. SWOT Analysis
- 17.2.18.4. Recent Developments
- 17.2.18.5. Financials (Based on Availability)
- 17.2.19 Toshiba Tec Corporation*List Not Exhaustive
- 17.2.19.1. Overview
- 17.2.19.2. Products
- 17.2.19.3. SWOT Analysis
- 17.2.19.4. Recent Developments
- 17.2.19.5. Financials (Based on Availability)
- 17.2.20 NEC Corporation
- 17.2.20.1. Overview
- 17.2.20.2. Products
- 17.2.20.3. SWOT Analysis
- 17.2.20.4. Recent Developments
- 17.2.20.5. Financials (Based on Availability)
- 17.2.21 Ctac NV
- 17.2.21.1. Overview
- 17.2.21.2. Products
- 17.2.21.3. SWOT Analysis
- 17.2.21.4. Recent Developments
- 17.2.21.5. Financials (Based on Availability)
- 17.2.22 Micros Retail Systems Inc (Oracle)
- 17.2.22.1. Overview
- 17.2.22.2. Products
- 17.2.22.3. SWOT Analysis
- 17.2.22.4. Recent Developments
- 17.2.22.5. Financials (Based on Availability)
- 17.2.23 VeriFone System Inc
- 17.2.23.1. Overview
- 17.2.23.2. Products
- 17.2.23.3. SWOT Analysis
- 17.2.23.4. Recent Developments
- 17.2.23.5. Financials (Based on Availability)
- 17.2.24 Diebold Nixdorf
- 17.2.24.1. Overview
- 17.2.24.2. Products
- 17.2.24.3. SWOT Analysis
- 17.2.24.4. Recent Developments
- 17.2.24.5. Financials (Based on Availability)
- 17.2.25 Casio Computer Co Ltd
- 17.2.25.1. Overview
- 17.2.25.2. Products
- 17.2.25.3. SWOT Analysis
- 17.2.25.4. Recent Developments
- 17.2.25.5. Financials (Based on Availability)
- 17.2.26 PAX Technology
- 17.2.26.1. Overview
- 17.2.26.2. Products
- 17.2.26.3. SWOT Analysis
- 17.2.26.4. Recent Developments
- 17.2.26.5. Financials (Based on Availability)
- 17.2.27 Panasonic Corporation
- 17.2.27.1. Overview
- 17.2.27.2. Products
- 17.2.27.3. SWOT Analysis
- 17.2.27.4. Recent Developments
- 17.2.27.5. Financials (Based on Availability)
- 17.2.1 Ingenico SA
List of Figures
- Figure 1: Global POS Terminal Industry Revenue Breakdown (Million, %) by Region 2024 & 2032
- Figure 2: North America POS Terminal Industry Revenue (Million), by Country 2024 & 2032
- Figure 3: North America POS Terminal Industry Revenue Share (%), by Country 2024 & 2032
- Figure 4: Europe POS Terminal Industry Revenue (Million), by Country 2024 & 2032
- Figure 5: Europe POS Terminal Industry Revenue Share (%), by Country 2024 & 2032
- Figure 6: Asia Pacific POS Terminal Industry Revenue (Million), by Country 2024 & 2032
- Figure 7: Asia Pacific POS Terminal Industry Revenue Share (%), by Country 2024 & 2032
- Figure 8: Latin America POS Terminal Industry Revenue (Million), by Country 2024 & 2032
- Figure 9: Latin America POS Terminal Industry Revenue Share (%), by Country 2024 & 2032
- Figure 10: Middle East and Africa POS Terminal Industry Revenue (Million), by Country 2024 & 2032
- Figure 11: Middle East and Africa POS Terminal Industry Revenue Share (%), by Country 2024 & 2032
- Figure 12: North America POS Terminal Industry Revenue (Million), by Component 2024 & 2032
- Figure 13: North America POS Terminal Industry Revenue Share (%), by Component 2024 & 2032
- Figure 14: North America POS Terminal Industry Revenue (Million), by Type 2024 & 2032
- Figure 15: North America POS Terminal Industry Revenue Share (%), by Type 2024 & 2032
- Figure 16: North America POS Terminal Industry Revenue (Million), by End-user Industries 2024 & 2032
- Figure 17: North America POS Terminal Industry Revenue Share (%), by End-user Industries 2024 & 2032
- Figure 18: North America POS Terminal Industry Revenue (Million), by Country 2024 & 2032
- Figure 19: North America POS Terminal Industry Revenue Share (%), by Country 2024 & 2032
- Figure 20: Europe POS Terminal Industry Revenue (Million), by Component 2024 & 2032
- Figure 21: Europe POS Terminal Industry Revenue Share (%), by Component 2024 & 2032
- Figure 22: Europe POS Terminal Industry Revenue (Million), by Type 2024 & 2032
- Figure 23: Europe POS Terminal Industry Revenue Share (%), by Type 2024 & 2032
- Figure 24: Europe POS Terminal Industry Revenue (Million), by End-user Industries 2024 & 2032
- Figure 25: Europe POS Terminal Industry Revenue Share (%), by End-user Industries 2024 & 2032
- Figure 26: Europe POS Terminal Industry Revenue (Million), by Country 2024 & 2032
- Figure 27: Europe POS Terminal Industry Revenue Share (%), by Country 2024 & 2032
- Figure 28: Asia POS Terminal Industry Revenue (Million), by Component 2024 & 2032
- Figure 29: Asia POS Terminal Industry Revenue Share (%), by Component 2024 & 2032
- Figure 30: Asia POS Terminal Industry Revenue (Million), by Type 2024 & 2032
- Figure 31: Asia POS Terminal Industry Revenue Share (%), by Type 2024 & 2032
- Figure 32: Asia POS Terminal Industry Revenue (Million), by End-user Industries 2024 & 2032
- Figure 33: Asia POS Terminal Industry Revenue Share (%), by End-user Industries 2024 & 2032
- Figure 34: Asia POS Terminal Industry Revenue (Million), by Country 2024 & 2032
- Figure 35: Asia POS Terminal Industry Revenue Share (%), by Country 2024 & 2032
- Figure 36: Australia and New Zealand POS Terminal Industry Revenue (Million), by Component 2024 & 2032
- Figure 37: Australia and New Zealand POS Terminal Industry Revenue Share (%), by Component 2024 & 2032
- Figure 38: Australia and New Zealand POS Terminal Industry Revenue (Million), by Type 2024 & 2032
- Figure 39: Australia and New Zealand POS Terminal Industry Revenue Share (%), by Type 2024 & 2032
- Figure 40: Australia and New Zealand POS Terminal Industry Revenue (Million), by End-user Industries 2024 & 2032
- Figure 41: Australia and New Zealand POS Terminal Industry Revenue Share (%), by End-user Industries 2024 & 2032
- Figure 42: Australia and New Zealand POS Terminal Industry Revenue (Million), by Country 2024 & 2032
- Figure 43: Australia and New Zealand POS Terminal Industry Revenue Share (%), by Country 2024 & 2032
- Figure 44: Latin America POS Terminal Industry Revenue (Million), by Component 2024 & 2032
- Figure 45: Latin America POS Terminal Industry Revenue Share (%), by Component 2024 & 2032
- Figure 46: Latin America POS Terminal Industry Revenue (Million), by Type 2024 & 2032
- Figure 47: Latin America POS Terminal Industry Revenue Share (%), by Type 2024 & 2032
- Figure 48: Latin America POS Terminal Industry Revenue (Million), by End-user Industries 2024 & 2032
- Figure 49: Latin America POS Terminal Industry Revenue Share (%), by End-user Industries 2024 & 2032
- Figure 50: Latin America POS Terminal Industry Revenue (Million), by Country 2024 & 2032
- Figure 51: Latin America POS Terminal Industry Revenue Share (%), by Country 2024 & 2032
- Figure 52: Middle East and Africa POS Terminal Industry Revenue (Million), by Component 2024 & 2032
- Figure 53: Middle East and Africa POS Terminal Industry Revenue Share (%), by Component 2024 & 2032
- Figure 54: Middle East and Africa POS Terminal Industry Revenue (Million), by Type 2024 & 2032
- Figure 55: Middle East and Africa POS Terminal Industry Revenue Share (%), by Type 2024 & 2032
- Figure 56: Middle East and Africa POS Terminal Industry Revenue (Million), by End-user Industries 2024 & 2032
- Figure 57: Middle East and Africa POS Terminal Industry Revenue Share (%), by End-user Industries 2024 & 2032
- Figure 58: Middle East and Africa POS Terminal Industry Revenue (Million), by Country 2024 & 2032
- Figure 59: Middle East and Africa POS Terminal Industry Revenue Share (%), by Country 2024 & 2032
List of Tables
- Table 1: Global POS Terminal Industry Revenue Million Forecast, by Region 2019 & 2032
- Table 2: Global POS Terminal Industry Revenue Million Forecast, by Component 2019 & 2032
- Table 3: Global POS Terminal Industry Revenue Million Forecast, by Type 2019 & 2032
- Table 4: Global POS Terminal Industry Revenue Million Forecast, by End-user Industries 2019 & 2032
- Table 5: Global POS Terminal Industry Revenue Million Forecast, by Region 2019 & 2032
- Table 6: Global POS Terminal Industry Revenue Million Forecast, by Country 2019 & 2032
- Table 7: POS Terminal Industry Revenue (Million) Forecast, by Application 2019 & 2032
- Table 8: Global POS Terminal Industry Revenue Million Forecast, by Country 2019 & 2032
- Table 9: POS Terminal Industry Revenue (Million) Forecast, by Application 2019 & 2032
- Table 10: Global POS Terminal Industry Revenue Million Forecast, by Country 2019 & 2032
- Table 11: POS Terminal Industry Revenue (Million) Forecast, by Application 2019 & 2032
- Table 12: Global POS Terminal Industry Revenue Million Forecast, by Country 2019 & 2032
- Table 13: POS Terminal Industry Revenue (Million) Forecast, by Application 2019 & 2032
- Table 14: Global POS Terminal Industry Revenue Million Forecast, by Country 2019 & 2032
- Table 15: POS Terminal Industry Revenue (Million) Forecast, by Application 2019 & 2032
- Table 16: Global POS Terminal Industry Revenue Million Forecast, by Component 2019 & 2032
- Table 17: Global POS Terminal Industry Revenue Million Forecast, by Type 2019 & 2032
- Table 18: Global POS Terminal Industry Revenue Million Forecast, by End-user Industries 2019 & 2032
- Table 19: Global POS Terminal Industry Revenue Million Forecast, by Country 2019 & 2032
- Table 20: Global POS Terminal Industry Revenue Million Forecast, by Component 2019 & 2032
- Table 21: Global POS Terminal Industry Revenue Million Forecast, by Type 2019 & 2032
- Table 22: Global POS Terminal Industry Revenue Million Forecast, by End-user Industries 2019 & 2032
- Table 23: Global POS Terminal Industry Revenue Million Forecast, by Country 2019 & 2032
- Table 24: Global POS Terminal Industry Revenue Million Forecast, by Component 2019 & 2032
- Table 25: Global POS Terminal Industry Revenue Million Forecast, by Type 2019 & 2032
- Table 26: Global POS Terminal Industry Revenue Million Forecast, by End-user Industries 2019 & 2032
- Table 27: Global POS Terminal Industry Revenue Million Forecast, by Country 2019 & 2032
- Table 28: Global POS Terminal Industry Revenue Million Forecast, by Component 2019 & 2032
- Table 29: Global POS Terminal Industry Revenue Million Forecast, by Type 2019 & 2032
- Table 30: Global POS Terminal Industry Revenue Million Forecast, by End-user Industries 2019 & 2032
- Table 31: Global POS Terminal Industry Revenue Million Forecast, by Country 2019 & 2032
- Table 32: Global POS Terminal Industry Revenue Million Forecast, by Component 2019 & 2032
- Table 33: Global POS Terminal Industry Revenue Million Forecast, by Type 2019 & 2032
- Table 34: Global POS Terminal Industry Revenue Million Forecast, by End-user Industries 2019 & 2032
- Table 35: Global POS Terminal Industry Revenue Million Forecast, by Country 2019 & 2032
- Table 36: Global POS Terminal Industry Revenue Million Forecast, by Component 2019 & 2032
- Table 37: Global POS Terminal Industry Revenue Million Forecast, by Type 2019 & 2032
- Table 38: Global POS Terminal Industry Revenue Million Forecast, by End-user Industries 2019 & 2032
- Table 39: Global POS Terminal Industry Revenue Million Forecast, by Country 2019 & 2032
Frequently Asked Questions
1. What is the projected Compound Annual Growth Rate (CAGR) of the POS Terminal Industry?
The projected CAGR is approximately 8.68%.
2. Which companies are prominent players in the POS Terminal Industry?
Key companies in the market include Ingenico SA, iMetrics Pte Ltd, Infor Inc, NEXGO (Shenzhen Xinguodu Technology Co Ltd ), Qashier PTE Ltd, GK Software SE, Agilysys Inc, Newland Payment Technology, Fujitsu Ltd, PCMS Group Ltd, Cegid Group, HP Development Company LP, Samsung Electronics Co Ltd, NCR Corporation, Cow Hills Retail BV, Toshiba Global Commerce Solutions, Bindo Labs Inc, Aptos Inc, Toshiba Tec Corporation*List Not Exhaustive, NEC Corporation, Ctac NV, Micros Retail Systems Inc (Oracle), VeriFone System Inc, Diebold Nixdorf, Casio Computer Co Ltd, PAX Technology, Panasonic Corporation.
3. What are the main segments of the POS Terminal Industry?
The market segments include Component, Type, End-user Industries.
4. Can you provide details about the market size?
The market size is estimated to be USD 100.24 Million as of 2022.
5. What are some drivers contributing to market growth?
Growing Adoption of POS Terminals in the Retail Sector; Rising Adoption of Cloud-based Platforms.
6. What are the notable trends driving market growth?
Hardware Segment to Account for the Largest Market Share.
7. Are there any restraints impacting market growth?
Rising Complexities to Implement Transition from Manual to Software Testing Process.
8. Can you provide examples of recent developments in the market?
September 2022: Newland Payment Technology, a leading provider of payment terminal solutions, showcased its portfolio of SmartPOS and classic payment devices at Paris Retail Week 2022. Through this, the company demonstrated its commitment to driving innovation at the point of interaction. Newland is bringing its high-performance Android SmartPOS series to the French market, ensuring that these terminals can be certified against all local payment requirements.
9. What pricing options are available for accessing the report?
Pricing options include single-user, multi-user, and enterprise licenses priced at USD 4750, USD 5250, and USD 8750 respectively.
10. Is the market size provided in terms of value or volume?
The market size is provided in terms of value, measured in Million.
11. Are there any specific market keywords associated with the report?
Yes, the market keyword associated with the report is "POS Terminal Industry," which aids in identifying and referencing the specific market segment covered.
12. How do I determine which pricing option suits my needs best?
The pricing options vary based on user requirements and access needs. Individual users may opt for single-user licenses, while businesses requiring broader access may choose multi-user or enterprise licenses for cost-effective access to the report.
13. Are there any additional resources or data provided in the POS Terminal Industry report?
While the report offers comprehensive insights, it's advisable to review the specific contents or supplementary materials provided to ascertain if additional resources or data are available.
14. How can I stay updated on further developments or reports in the POS Terminal Industry?
To stay informed about further developments, trends, and reports in the POS Terminal Industry, consider subscribing to industry newsletters, following relevant companies and organizations, or regularly checking reputable industry news sources and publications.
Methodology
Step 1 - Identification of Relevant Samples Size from Population Database


Step 2 - Approaches for Defining Global Market Size (Value, Volume* & Price*)

Note*: In applicable scenarios
Step 3 - Data Sources
Primary Research
- Web Analytics
- Survey Reports
- Research Institute
- Latest Research Reports
- Opinion Leaders
Secondary Research
- Annual Reports
- White Paper
- Latest Press Release
- Industry Association
- Paid Database
- Investor Presentations

Step 4 - Data Triangulation
Involves using different sources of information in order to increase the validity of a study
These sources are likely to be stakeholders in a program - participants, other researchers, program staff, other community members, and so on.
Then we put all data in single framework & apply various statistical tools to find out the dynamic on the market.
During the analysis stage, feedback from the stakeholder groups would be compared to determine areas of agreement as well as areas of divergence
