

Key Insights
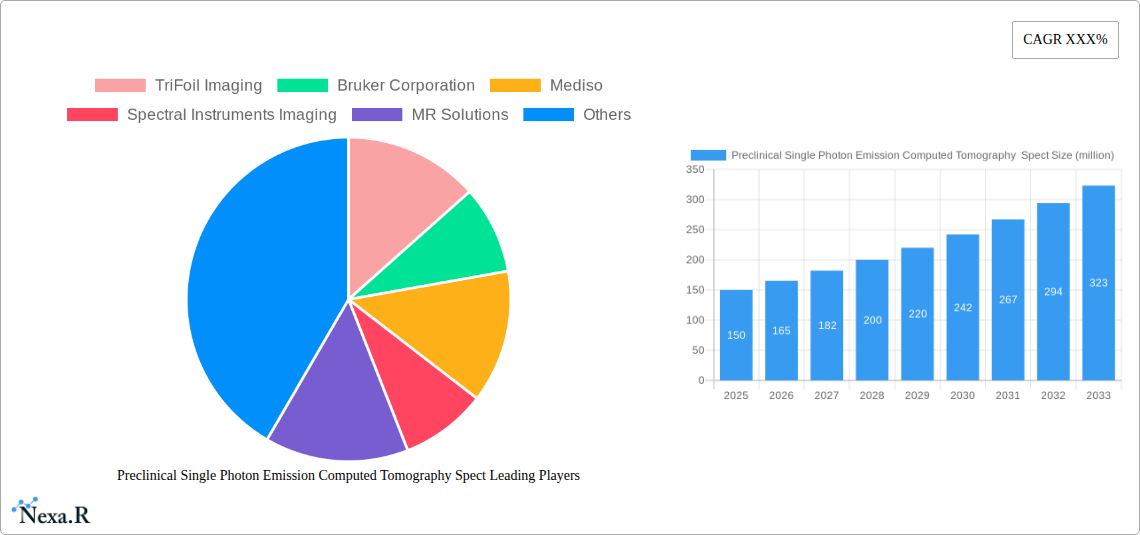
The preclinical single-photon emission computed tomography (SPECT) market is experiencing robust growth, driven by the increasing demand for non-invasive, high-resolution imaging in preclinical research. Advances in SPECT technology, such as improved detector sensitivity and resolution, are enabling researchers to obtain more detailed and accurate images of biological processes in small animal models. This, in turn, is accelerating drug discovery and development, particularly in oncology, cardiology, and neurology. The market is segmented by modality (planar and tomographic), application (oncology, cardiology, neurology, and others), and end-user (pharmaceutical companies, academic research institutions, and contract research organizations). Key players such as TriFoil Imaging, Bruker Corporation, Mediso, and others are investing heavily in R&D to enhance the capabilities of their SPECT systems and expand their market share. The rising adoption of SPECT in combination with other imaging modalities, like PET and MRI, for multi-modal imaging is also contributing to market growth. Competition is expected to remain high, with companies focusing on providing innovative solutions and superior customer support to maintain a competitive edge.
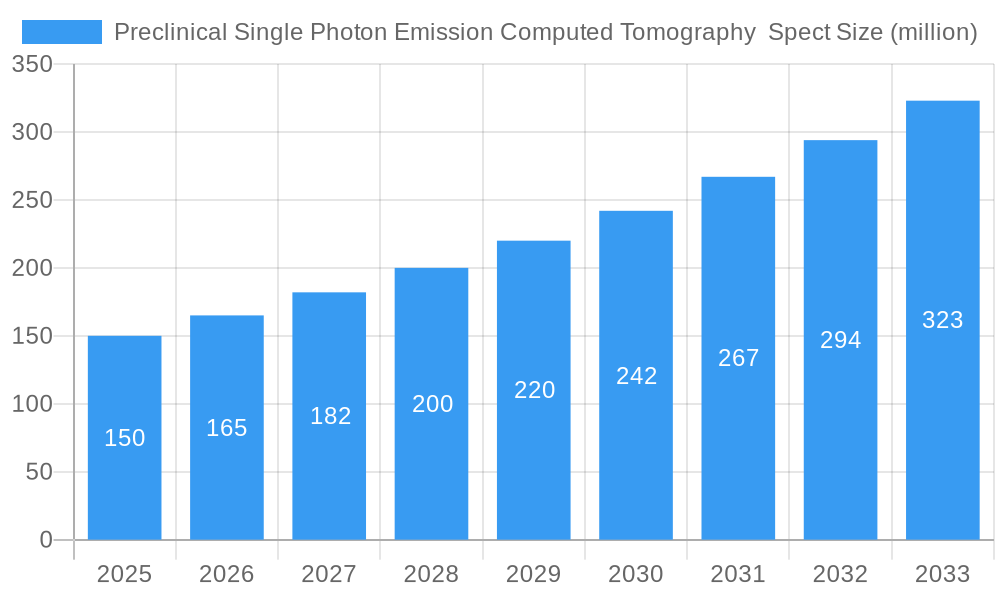
Preclinical Single Photon Emission Computed Tomography Spect Market Size (In Million)
The market's growth is further propelled by the increasing focus on personalized medicine, requiring detailed preclinical assessments for drug efficacy and toxicity. The high cost of SPECT systems, coupled with the need for specialized expertise in image acquisition and analysis, may pose a challenge. However, the increasing availability of advanced software and data analysis tools is mitigating this to some extent. We project the market to maintain a steady growth trajectory over the coming years, with continued technological innovation and adoption driving expansion across various regions. The market's value is expected to reach a significant size by 2033, driven by increasing R&D investment, growing regulatory approvals for novel SPECT tracers, and the emergence of new clinical applications.
Preclinical Single Photon Emission Computed Tomography Spect Company Market Share
Preclinical Single Photon Emission Computed Tomography (SPECT) Market Report: 2019-2033
This comprehensive report provides a detailed analysis of the preclinical Single Photon Emission Computed Tomography (SPECT) market, encompassing market dynamics, growth trends, regional insights, product landscape, challenges, opportunities, and key players. The study covers the period 2019-2033, with a base year of 2025 and a forecast period of 2025-2033. The market is segmented by technology, application, and end-user, offering a granular understanding of this rapidly evolving sector within the larger parent market of preclinical imaging and the child market of nuclear medicine imaging. The total market size in 2025 is estimated at $XX million and is projected to reach $XX million by 2033.
Preclinical Single Photon Emission Computed Tomography Spect Market Dynamics & Structure
The preclinical SPECT market is characterized by moderate concentration, with key players like Bruker Corporation and Mediso holding significant market share. Technological innovation, particularly in detector technology and image reconstruction algorithms, is a key driver. Stringent regulatory frameworks governing the use of radioisotopes influence market growth. Competitive substitutes, such as PET and MRI, present challenges. The end-user demographic primarily comprises research institutions, pharmaceutical companies, and contract research organizations (CROs). M&A activity in the sector has been relatively low in recent years, with xx deals recorded between 2019 and 2024, largely driven by strategic acquisitions aimed at expanding product portfolios and geographical reach.
- Market Concentration: Moderately concentrated, with top 5 players holding approximately XX% market share in 2025.
- Technological Innovation: Advancements in detector sensitivity, resolution, and speed are key drivers.
- Regulatory Landscape: Stringent regulations surrounding radioisotope handling and use impact market penetration.
- Competitive Substitutes: PET and MRI offer alternative imaging modalities, posing competitive pressure.
- End-User Demographics: Primarily research institutions, pharmaceutical companies, and CROs.
- M&A Activity: xx deals between 2019 and 2024; focused on expanding product portfolios and geographical presence.
Preclinical Single Photon Emission Computed Tomography Spect Growth Trends & Insights
The preclinical SPECT market experienced a CAGR of XX% during the historical period (2019-2024), driven by increasing research activities in drug discovery and development, growing adoption in preclinical studies, and advancements in SPECT technology. Market penetration remains relatively low compared to other preclinical imaging modalities, but is expected to grow steadily with the increasing demand for high-resolution and sensitive imaging techniques for small animal models. Technological disruptions, particularly the development of high-throughput systems and improved image analysis software, are expected to fuel market growth. Shifts in consumer behavior towards more sophisticated and user-friendly systems are also influencing market adoption. The market is projected to witness a CAGR of XX% during the forecast period (2025-2033).
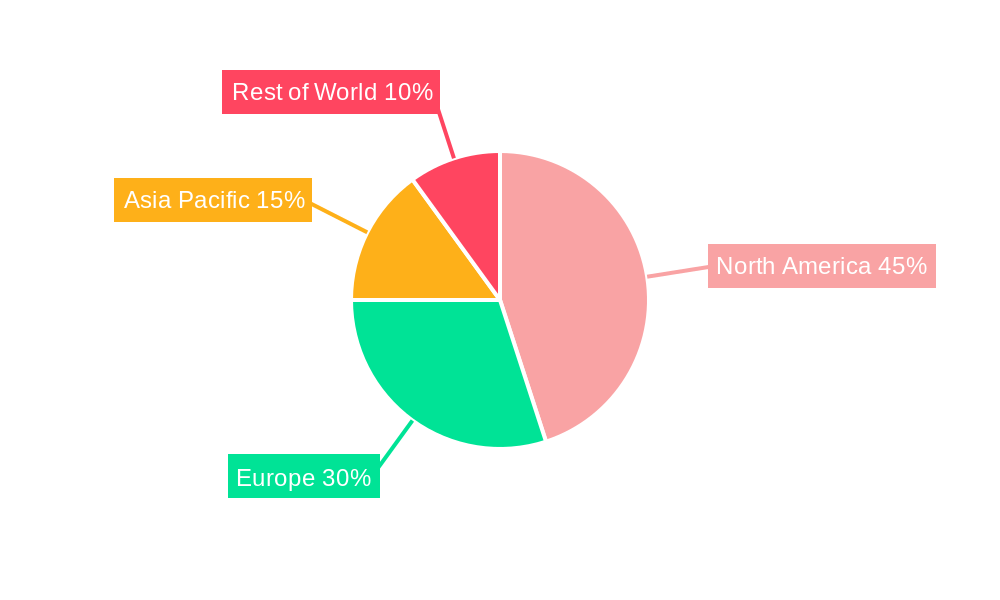
Dominant Regions, Countries, or Segments in Preclinical Single Photon Emission Computed Tomography Spect
North America currently holds the largest market share in the preclinical SPECT market, driven by high research funding, a strong presence of pharmaceutical and biotechnology companies, and well-established regulatory frameworks. Europe follows as a significant market, with strong academic research institutions and a growing focus on translational research. Asia-Pacific is experiencing rapid growth, driven by increasing investments in research infrastructure and expanding healthcare sector. The pharmaceutical and biotechnology segment accounts for the highest market share, reflecting the crucial role of preclinical SPECT in drug development and efficacy evaluation.
- North America: High research funding, strong presence of pharmaceutical companies.
- Europe: Strong academic research institutions, focus on translational research.
- Asia-Pacific: Rapid growth driven by increasing research investments and healthcare sector expansion.
- Segment Dominance: Pharmaceutical and biotechnology segment holds the largest market share due to its essential role in drug development.
Preclinical Single Photon Emission Computed Tomography Spect Product Landscape
Preclinical SPECT systems are characterized by varying levels of sensitivity, resolution, and throughput. Recent innovations include systems with improved detector designs for higher sensitivity and faster acquisition times. Advanced image reconstruction algorithms enhance image quality and allow for more precise quantitative analysis. Unique selling propositions often include ease of use, high throughput capabilities, and integrated software packages for image analysis. Technological advancements primarily focus on improving spatial resolution and increasing sensitivity to enable better visualization of small anatomical structures and lower tracer concentrations.
Key Drivers, Barriers & Challenges in Preclinical Single Photon Emission Computed Tomography Spect
Key Drivers:
- Increasing demand for high-resolution preclinical imaging in drug development.
- Technological advancements leading to improved system performance.
- Growing adoption in translational research bridging preclinical and clinical studies.
Challenges & Restraints:
- High initial investment costs associated with SPECT systems.
- Stringent regulatory requirements for radioisotope handling.
- Competition from other preclinical imaging modalities (PET, MRI). This competition accounts for a estimated loss of XX million dollars annually.
Emerging Opportunities in Preclinical Single Photon Emission Computed Tomography Spect
- Development of novel radiotracers for specific disease targets.
- Integration of SPECT with other imaging modalities (e.g., CT, MRI) for multimodal imaging.
- Expansion into new applications beyond traditional oncology research.
Growth Accelerators in the Preclinical Single Photon Emission Computed Tomography Spect Industry
Strategic collaborations between instrument manufacturers and radiopharmaceutical companies will accelerate market growth. Furthermore, the development of compact and cost-effective SPECT systems will drive wider adoption. Finally, innovative applications within areas such as neuroimaging and cardiovascular research will create new avenues for market expansion.
Key Players Shaping the Preclinical Single Photon Emission Computed Tomography Spect Market
- Bruker Corporation
- Mediso
- Spectral Instruments Imaging
- MR Solutions
- Aspect Imaging
- Spectrum Dynamics Medical
- TriFoil Imaging
Notable Milestones in Preclinical Single Photon Emission Computed Tomography Spect Sector
- 2020: Bruker Corporation launched a new high-resolution SPECT system.
- 2022: Mediso announced a strategic partnership for radiotracer development.
- 2023: Significant advancements in detector technology reported by several companies.
In-Depth Preclinical Single Photon Emission Computed Tomography Spect Market Outlook
The preclinical SPECT market is poised for continued growth, driven by technological innovation, increasing research activities, and expanding applications. Strategic partnerships and investments in research and development will play a crucial role in shaping the future market landscape. The market presents significant opportunities for companies focusing on developing advanced imaging systems and novel radiotracers, catering to the growing demand for sophisticated preclinical research tools.
Preclinical Single Photon Emission Computed Tomography Spect Segmentation
-
1. Application
- 1.1. Pharmaceutical Companies
- 1.2. Contract Research Organization (CRO’s)
- 1.3. Biotech Companies
- 1.4. Others
-
2. Type
- 2.1. Structural Imaging
- 2.2. Functional Imaging
Preclinical Single Photon Emission Computed Tomography Spect Segmentation By Geography
-
1. North America
- 1.1. United States
- 1.2. Canada
- 1.3. Mexico
-
2. South America
- 2.1. Brazil
- 2.2. Argentina
- 2.3. Rest of South America
-
3. Europe
- 3.1. United Kingdom
- 3.2. Germany
- 3.3. France
- 3.4. Italy
- 3.5. Spain
- 3.6. Russia
- 3.7. Benelux
- 3.8. Nordics
- 3.9. Rest of Europe
-
4. Middle East & Africa
- 4.1. Turkey
- 4.2. Israel
- 4.3. GCC
- 4.4. North Africa
- 4.5. South Africa
- 4.6. Rest of Middle East & Africa
-
5. Asia Pacific
- 5.1. China
- 5.2. India
- 5.3. Japan
- 5.4. South Korea
- 5.5. ASEAN
- 5.6. Oceania
- 5.7. Rest of Asia Pacific
Preclinical Single Photon Emission Computed Tomography Spect Regional Market Share
Geographic Coverage of Preclinical Single Photon Emission Computed Tomography Spect
Preclinical Single Photon Emission Computed Tomography Spect REPORT HIGHLIGHTS
| Aspects | Details |
|---|---|
| Study Period | 2020-2034 |
| Base Year | 2025 |
| Estimated Year | 2026 |
| Forecast Period | 2026-2034 |
| Historical Period | 2020-2025 |
| Growth Rate | CAGR of XXX% from 2020-2034 |
| Segmentation |
|
Table of Contents
- 1. Introduction
- 1.1. Research Scope
- 1.2. Market Segmentation
- 1.3. Research Methodology
- 1.4. Definitions and Assumptions
- 2. Executive Summary
- 2.1. Introduction
- 3. Market Dynamics
- 3.1. Introduction
- 3.2. Market Drivers
- 3.3. Market Restrains
- 3.4. Market Trends
- 4. Market Factor Analysis
- 4.1. Porters Five Forces
- 4.2. Supply/Value Chain
- 4.3. PESTEL analysis
- 4.4. Market Entropy
- 4.5. Patent/Trademark Analysis
- 5. Global Preclinical Single Photon Emission Computed Tomography Spect Analysis, Insights and Forecast, 2020-2032
- 5.1. Market Analysis, Insights and Forecast - by Application
- 5.1.1. Pharmaceutical Companies
- 5.1.2. Contract Research Organization (CRO’s)
- 5.1.3. Biotech Companies
- 5.1.4. Others
- 5.2. Market Analysis, Insights and Forecast - by Type
- 5.2.1. Structural Imaging
- 5.2.2. Functional Imaging
- 5.3. Market Analysis, Insights and Forecast - by Region
- 5.3.1. North America
- 5.3.2. South America
- 5.3.3. Europe
- 5.3.4. Middle East & Africa
- 5.3.5. Asia Pacific
- 5.1. Market Analysis, Insights and Forecast - by Application
- 6. North America Preclinical Single Photon Emission Computed Tomography Spect Analysis, Insights and Forecast, 2020-2032
- 6.1. Market Analysis, Insights and Forecast - by Application
- 6.1.1. Pharmaceutical Companies
- 6.1.2. Contract Research Organization (CRO’s)
- 6.1.3. Biotech Companies
- 6.1.4. Others
- 6.2. Market Analysis, Insights and Forecast - by Type
- 6.2.1. Structural Imaging
- 6.2.2. Functional Imaging
- 6.1. Market Analysis, Insights and Forecast - by Application
- 7. South America Preclinical Single Photon Emission Computed Tomography Spect Analysis, Insights and Forecast, 2020-2032
- 7.1. Market Analysis, Insights and Forecast - by Application
- 7.1.1. Pharmaceutical Companies
- 7.1.2. Contract Research Organization (CRO’s)
- 7.1.3. Biotech Companies
- 7.1.4. Others
- 7.2. Market Analysis, Insights and Forecast - by Type
- 7.2.1. Structural Imaging
- 7.2.2. Functional Imaging
- 7.1. Market Analysis, Insights and Forecast - by Application
- 8. Europe Preclinical Single Photon Emission Computed Tomography Spect Analysis, Insights and Forecast, 2020-2032
- 8.1. Market Analysis, Insights and Forecast - by Application
- 8.1.1. Pharmaceutical Companies
- 8.1.2. Contract Research Organization (CRO’s)
- 8.1.3. Biotech Companies
- 8.1.4. Others
- 8.2. Market Analysis, Insights and Forecast - by Type
- 8.2.1. Structural Imaging
- 8.2.2. Functional Imaging
- 8.1. Market Analysis, Insights and Forecast - by Application
- 9. Middle East & Africa Preclinical Single Photon Emission Computed Tomography Spect Analysis, Insights and Forecast, 2020-2032
- 9.1. Market Analysis, Insights and Forecast - by Application
- 9.1.1. Pharmaceutical Companies
- 9.1.2. Contract Research Organization (CRO’s)
- 9.1.3. Biotech Companies
- 9.1.4. Others
- 9.2. Market Analysis, Insights and Forecast - by Type
- 9.2.1. Structural Imaging
- 9.2.2. Functional Imaging
- 9.1. Market Analysis, Insights and Forecast - by Application
- 10. Asia Pacific Preclinical Single Photon Emission Computed Tomography Spect Analysis, Insights and Forecast, 2020-2032
- 10.1. Market Analysis, Insights and Forecast - by Application
- 10.1.1. Pharmaceutical Companies
- 10.1.2. Contract Research Organization (CRO’s)
- 10.1.3. Biotech Companies
- 10.1.4. Others
- 10.2. Market Analysis, Insights and Forecast - by Type
- 10.2.1. Structural Imaging
- 10.2.2. Functional Imaging
- 10.1. Market Analysis, Insights and Forecast - by Application
- 11. Competitive Analysis
- 11.1. Global Market Share Analysis 2025
- 11.2. Company Profiles
- 11.2.1 TriFoil Imaging
- 11.2.1.1. Overview
- 11.2.1.2. Products
- 11.2.1.3. SWOT Analysis
- 11.2.1.4. Recent Developments
- 11.2.1.5. Financials (Based on Availability)
- 11.2.2 Bruker Corporation
- 11.2.2.1. Overview
- 11.2.2.2. Products
- 11.2.2.3. SWOT Analysis
- 11.2.2.4. Recent Developments
- 11.2.2.5. Financials (Based on Availability)
- 11.2.3 Mediso
- 11.2.3.1. Overview
- 11.2.3.2. Products
- 11.2.3.3. SWOT Analysis
- 11.2.3.4. Recent Developments
- 11.2.3.5. Financials (Based on Availability)
- 11.2.4 Spectral Instruments Imaging
- 11.2.4.1. Overview
- 11.2.4.2. Products
- 11.2.4.3. SWOT Analysis
- 11.2.4.4. Recent Developments
- 11.2.4.5. Financials (Based on Availability)
- 11.2.5 MR Solutions
- 11.2.5.1. Overview
- 11.2.5.2. Products
- 11.2.5.3. SWOT Analysis
- 11.2.5.4. Recent Developments
- 11.2.5.5. Financials (Based on Availability)
- 11.2.6 Aspect Imaging
- 11.2.6.1. Overview
- 11.2.6.2. Products
- 11.2.6.3. SWOT Analysis
- 11.2.6.4. Recent Developments
- 11.2.6.5. Financials (Based on Availability)
- 11.2.7 Spectrum Dynamics Medical
- 11.2.7.1. Overview
- 11.2.7.2. Products
- 11.2.7.3. SWOT Analysis
- 11.2.7.4. Recent Developments
- 11.2.7.5. Financials (Based on Availability)
- 11.2.1 TriFoil Imaging
List of Figures
- Figure 1: Global Preclinical Single Photon Emission Computed Tomography Spect Revenue Breakdown (million, %) by Region 2025 & 2033
- Figure 2: North America Preclinical Single Photon Emission Computed Tomography Spect Revenue (million), by Application 2025 & 2033
- Figure 3: North America Preclinical Single Photon Emission Computed Tomography Spect Revenue Share (%), by Application 2025 & 2033
- Figure 4: North America Preclinical Single Photon Emission Computed Tomography Spect Revenue (million), by Type 2025 & 2033
- Figure 5: North America Preclinical Single Photon Emission Computed Tomography Spect Revenue Share (%), by Type 2025 & 2033
- Figure 6: North America Preclinical Single Photon Emission Computed Tomography Spect Revenue (million), by Country 2025 & 2033
- Figure 7: North America Preclinical Single Photon Emission Computed Tomography Spect Revenue Share (%), by Country 2025 & 2033
- Figure 8: South America Preclinical Single Photon Emission Computed Tomography Spect Revenue (million), by Application 2025 & 2033
- Figure 9: South America Preclinical Single Photon Emission Computed Tomography Spect Revenue Share (%), by Application 2025 & 2033
- Figure 10: South America Preclinical Single Photon Emission Computed Tomography Spect Revenue (million), by Type 2025 & 2033
- Figure 11: South America Preclinical Single Photon Emission Computed Tomography Spect Revenue Share (%), by Type 2025 & 2033
- Figure 12: South America Preclinical Single Photon Emission Computed Tomography Spect Revenue (million), by Country 2025 & 2033
- Figure 13: South America Preclinical Single Photon Emission Computed Tomography Spect Revenue Share (%), by Country 2025 & 2033
- Figure 14: Europe Preclinical Single Photon Emission Computed Tomography Spect Revenue (million), by Application 2025 & 2033
- Figure 15: Europe Preclinical Single Photon Emission Computed Tomography Spect Revenue Share (%), by Application 2025 & 2033
- Figure 16: Europe Preclinical Single Photon Emission Computed Tomography Spect Revenue (million), by Type 2025 & 2033
- Figure 17: Europe Preclinical Single Photon Emission Computed Tomography Spect Revenue Share (%), by Type 2025 & 2033
- Figure 18: Europe Preclinical Single Photon Emission Computed Tomography Spect Revenue (million), by Country 2025 & 2033
- Figure 19: Europe Preclinical Single Photon Emission Computed Tomography Spect Revenue Share (%), by Country 2025 & 2033
- Figure 20: Middle East & Africa Preclinical Single Photon Emission Computed Tomography Spect Revenue (million), by Application 2025 & 2033
- Figure 21: Middle East & Africa Preclinical Single Photon Emission Computed Tomography Spect Revenue Share (%), by Application 2025 & 2033
- Figure 22: Middle East & Africa Preclinical Single Photon Emission Computed Tomography Spect Revenue (million), by Type 2025 & 2033
- Figure 23: Middle East & Africa Preclinical Single Photon Emission Computed Tomography Spect Revenue Share (%), by Type 2025 & 2033
- Figure 24: Middle East & Africa Preclinical Single Photon Emission Computed Tomography Spect Revenue (million), by Country 2025 & 2033
- Figure 25: Middle East & Africa Preclinical Single Photon Emission Computed Tomography Spect Revenue Share (%), by Country 2025 & 2033
- Figure 26: Asia Pacific Preclinical Single Photon Emission Computed Tomography Spect Revenue (million), by Application 2025 & 2033
- Figure 27: Asia Pacific Preclinical Single Photon Emission Computed Tomography Spect Revenue Share (%), by Application 2025 & 2033
- Figure 28: Asia Pacific Preclinical Single Photon Emission Computed Tomography Spect Revenue (million), by Type 2025 & 2033
- Figure 29: Asia Pacific Preclinical Single Photon Emission Computed Tomography Spect Revenue Share (%), by Type 2025 & 2033
- Figure 30: Asia Pacific Preclinical Single Photon Emission Computed Tomography Spect Revenue (million), by Country 2025 & 2033
- Figure 31: Asia Pacific Preclinical Single Photon Emission Computed Tomography Spect Revenue Share (%), by Country 2025 & 2033
List of Tables
- Table 1: Global Preclinical Single Photon Emission Computed Tomography Spect Revenue million Forecast, by Application 2020 & 2033
- Table 2: Global Preclinical Single Photon Emission Computed Tomography Spect Revenue million Forecast, by Type 2020 & 2033
- Table 3: Global Preclinical Single Photon Emission Computed Tomography Spect Revenue million Forecast, by Region 2020 & 2033
- Table 4: Global Preclinical Single Photon Emission Computed Tomography Spect Revenue million Forecast, by Application 2020 & 2033
- Table 5: Global Preclinical Single Photon Emission Computed Tomography Spect Revenue million Forecast, by Type 2020 & 2033
- Table 6: Global Preclinical Single Photon Emission Computed Tomography Spect Revenue million Forecast, by Country 2020 & 2033
- Table 7: United States Preclinical Single Photon Emission Computed Tomography Spect Revenue (million) Forecast, by Application 2020 & 2033
- Table 8: Canada Preclinical Single Photon Emission Computed Tomography Spect Revenue (million) Forecast, by Application 2020 & 2033
- Table 9: Mexico Preclinical Single Photon Emission Computed Tomography Spect Revenue (million) Forecast, by Application 2020 & 2033
- Table 10: Global Preclinical Single Photon Emission Computed Tomography Spect Revenue million Forecast, by Application 2020 & 2033
- Table 11: Global Preclinical Single Photon Emission Computed Tomography Spect Revenue million Forecast, by Type 2020 & 2033
- Table 12: Global Preclinical Single Photon Emission Computed Tomography Spect Revenue million Forecast, by Country 2020 & 2033
- Table 13: Brazil Preclinical Single Photon Emission Computed Tomography Spect Revenue (million) Forecast, by Application 2020 & 2033
- Table 14: Argentina Preclinical Single Photon Emission Computed Tomography Spect Revenue (million) Forecast, by Application 2020 & 2033
- Table 15: Rest of South America Preclinical Single Photon Emission Computed Tomography Spect Revenue (million) Forecast, by Application 2020 & 2033
- Table 16: Global Preclinical Single Photon Emission Computed Tomography Spect Revenue million Forecast, by Application 2020 & 2033
- Table 17: Global Preclinical Single Photon Emission Computed Tomography Spect Revenue million Forecast, by Type 2020 & 2033
- Table 18: Global Preclinical Single Photon Emission Computed Tomography Spect Revenue million Forecast, by Country 2020 & 2033
- Table 19: United Kingdom Preclinical Single Photon Emission Computed Tomography Spect Revenue (million) Forecast, by Application 2020 & 2033
- Table 20: Germany Preclinical Single Photon Emission Computed Tomography Spect Revenue (million) Forecast, by Application 2020 & 2033
- Table 21: France Preclinical Single Photon Emission Computed Tomography Spect Revenue (million) Forecast, by Application 2020 & 2033
- Table 22: Italy Preclinical Single Photon Emission Computed Tomography Spect Revenue (million) Forecast, by Application 2020 & 2033
- Table 23: Spain Preclinical Single Photon Emission Computed Tomography Spect Revenue (million) Forecast, by Application 2020 & 2033
- Table 24: Russia Preclinical Single Photon Emission Computed Tomography Spect Revenue (million) Forecast, by Application 2020 & 2033
- Table 25: Benelux Preclinical Single Photon Emission Computed Tomography Spect Revenue (million) Forecast, by Application 2020 & 2033
- Table 26: Nordics Preclinical Single Photon Emission Computed Tomography Spect Revenue (million) Forecast, by Application 2020 & 2033
- Table 27: Rest of Europe Preclinical Single Photon Emission Computed Tomography Spect Revenue (million) Forecast, by Application 2020 & 2033
- Table 28: Global Preclinical Single Photon Emission Computed Tomography Spect Revenue million Forecast, by Application 2020 & 2033
- Table 29: Global Preclinical Single Photon Emission Computed Tomography Spect Revenue million Forecast, by Type 2020 & 2033
- Table 30: Global Preclinical Single Photon Emission Computed Tomography Spect Revenue million Forecast, by Country 2020 & 2033
- Table 31: Turkey Preclinical Single Photon Emission Computed Tomography Spect Revenue (million) Forecast, by Application 2020 & 2033
- Table 32: Israel Preclinical Single Photon Emission Computed Tomography Spect Revenue (million) Forecast, by Application 2020 & 2033
- Table 33: GCC Preclinical Single Photon Emission Computed Tomography Spect Revenue (million) Forecast, by Application 2020 & 2033
- Table 34: North Africa Preclinical Single Photon Emission Computed Tomography Spect Revenue (million) Forecast, by Application 2020 & 2033
- Table 35: South Africa Preclinical Single Photon Emission Computed Tomography Spect Revenue (million) Forecast, by Application 2020 & 2033
- Table 36: Rest of Middle East & Africa Preclinical Single Photon Emission Computed Tomography Spect Revenue (million) Forecast, by Application 2020 & 2033
- Table 37: Global Preclinical Single Photon Emission Computed Tomography Spect Revenue million Forecast, by Application 2020 & 2033
- Table 38: Global Preclinical Single Photon Emission Computed Tomography Spect Revenue million Forecast, by Type 2020 & 2033
- Table 39: Global Preclinical Single Photon Emission Computed Tomography Spect Revenue million Forecast, by Country 2020 & 2033
- Table 40: China Preclinical Single Photon Emission Computed Tomography Spect Revenue (million) Forecast, by Application 2020 & 2033
- Table 41: India Preclinical Single Photon Emission Computed Tomography Spect Revenue (million) Forecast, by Application 2020 & 2033
- Table 42: Japan Preclinical Single Photon Emission Computed Tomography Spect Revenue (million) Forecast, by Application 2020 & 2033
- Table 43: South Korea Preclinical Single Photon Emission Computed Tomography Spect Revenue (million) Forecast, by Application 2020 & 2033
- Table 44: ASEAN Preclinical Single Photon Emission Computed Tomography Spect Revenue (million) Forecast, by Application 2020 & 2033
- Table 45: Oceania Preclinical Single Photon Emission Computed Tomography Spect Revenue (million) Forecast, by Application 2020 & 2033
- Table 46: Rest of Asia Pacific Preclinical Single Photon Emission Computed Tomography Spect Revenue (million) Forecast, by Application 2020 & 2033
Frequently Asked Questions
1. What is the projected Compound Annual Growth Rate (CAGR) of the Preclinical Single Photon Emission Computed Tomography Spect?
The projected CAGR is approximately XXX%.
2. Which companies are prominent players in the Preclinical Single Photon Emission Computed Tomography Spect?
Key companies in the market include TriFoil Imaging, Bruker Corporation, Mediso, Spectral Instruments Imaging, MR Solutions, Aspect Imaging, Spectrum Dynamics Medical.
3. What are the main segments of the Preclinical Single Photon Emission Computed Tomography Spect?
The market segments include Application, Type.
4. Can you provide details about the market size?
The market size is estimated to be USD XXX million as of 2022.
5. What are some drivers contributing to market growth?
N/A
6. What are the notable trends driving market growth?
N/A
7. Are there any restraints impacting market growth?
N/A
8. Can you provide examples of recent developments in the market?
N/A
9. What pricing options are available for accessing the report?
Pricing options include single-user, multi-user, and enterprise licenses priced at USD 2900.00, USD 4350.00, and USD 5800.00 respectively.
10. Is the market size provided in terms of value or volume?
The market size is provided in terms of value, measured in million.
11. Are there any specific market keywords associated with the report?
Yes, the market keyword associated with the report is "Preclinical Single Photon Emission Computed Tomography Spect," which aids in identifying and referencing the specific market segment covered.
12. How do I determine which pricing option suits my needs best?
The pricing options vary based on user requirements and access needs. Individual users may opt for single-user licenses, while businesses requiring broader access may choose multi-user or enterprise licenses for cost-effective access to the report.
13. Are there any additional resources or data provided in the Preclinical Single Photon Emission Computed Tomography Spect report?
While the report offers comprehensive insights, it's advisable to review the specific contents or supplementary materials provided to ascertain if additional resources or data are available.
14. How can I stay updated on further developments or reports in the Preclinical Single Photon Emission Computed Tomography Spect?
To stay informed about further developments, trends, and reports in the Preclinical Single Photon Emission Computed Tomography Spect, consider subscribing to industry newsletters, following relevant companies and organizations, or regularly checking reputable industry news sources and publications.
Methodology
Step 1 - Identification of Relevant Samples Size from Population Database


Step 2 - Approaches for Defining Global Market Size (Value, Volume* & Price*)

Note*: In applicable scenarios
Step 3 - Data Sources
Primary Research
- Web Analytics
- Survey Reports
- Research Institute
- Latest Research Reports
- Opinion Leaders
Secondary Research
- Annual Reports
- White Paper
- Latest Press Release
- Industry Association
- Paid Database
- Investor Presentations

Step 4 - Data Triangulation
Involves using different sources of information in order to increase the validity of a study
These sources are likely to be stakeholders in a program - participants, other researchers, program staff, other community members, and so on.
Then we put all data in single framework & apply various statistical tools to find out the dynamic on the market.
During the analysis stage, feedback from the stakeholder groups would be compared to determine areas of agreement as well as areas of divergence