

Key Insights
The global prescription arthritis medication market represents a significant and expanding segment of the pharmaceutical industry, driven by increasing disease prevalence and advancements in treatment. The market is projected to reach $4.1 billion by 2025, with a Compound Annual Growth Rate (CAGR) of 9.87%. This growth trajectory is underpinned by an aging global demographic, contributing to a higher incidence of arthritis, alongside the development of novel biologics and targeted therapies offering enhanced efficacy and improved patient outcomes. Increased awareness and diagnosis rates for various arthritic conditions, coupled with expanding healthcare coverage and better access to specialized care in emerging economies, further fuel market expansion.
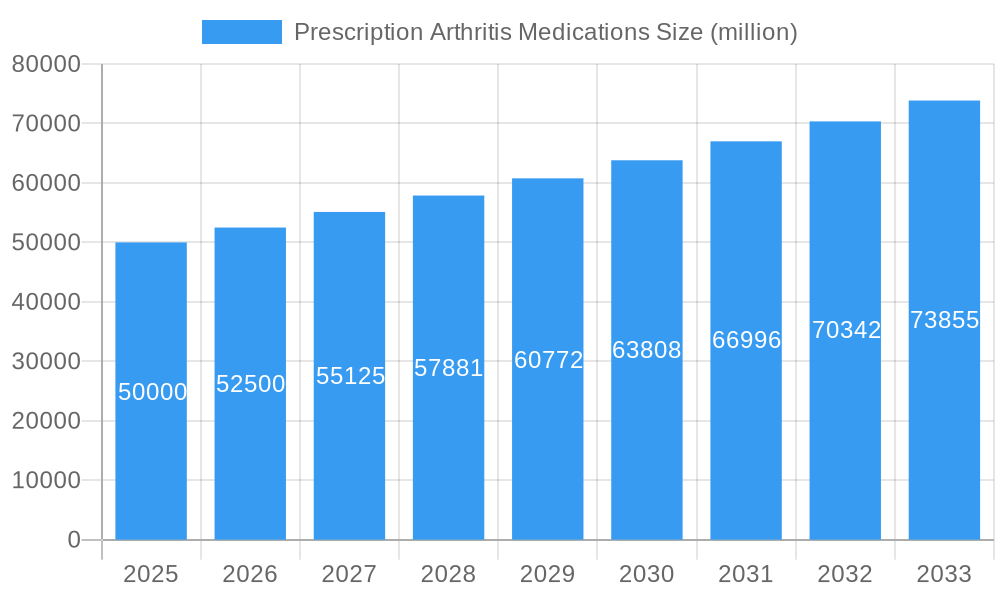
Prescription Arthritis Medications Market Size (In Billion)
Despite robust growth, market expansion faces challenges including high drug costs for biologic therapies, which can limit patient access, and the growing impact of biosimilar competition on originator drug revenue. Stringent regulatory pathways and the potential for adverse drug reactions also present hurdles for pharmaceutical manufacturers. Market segmentation highlights distinct treatment modalities and drug adoption rates across different arthritis types, such as rheumatoid arthritis and osteoarthritis. Consequently, strategic research and development investments, particularly in personalized medicine approaches tailored to specific arthritis subtypes, are vital for sustained success in this competitive environment. Regional variations in healthcare infrastructure, reimbursement policies, and disease prevalence also significantly influence market dynamics, necessitating nuanced penetration strategies.
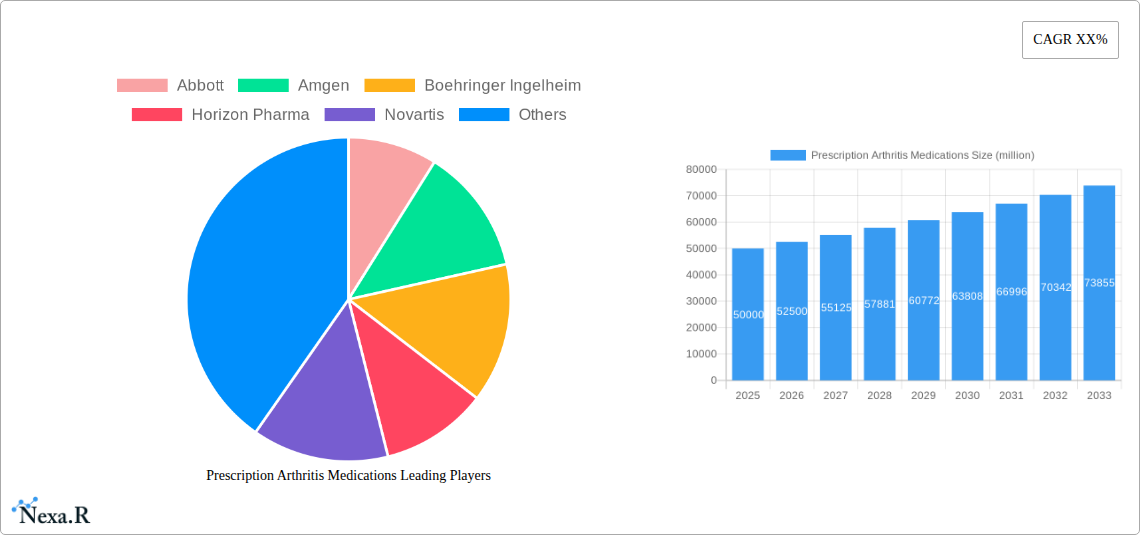
Prescription Arthritis Medications Company Market Share
Prescription Arthritis Medications Market Report: 2019-2033
This comprehensive report provides a detailed analysis of the prescription arthritis medications market, offering invaluable insights for pharmaceutical companies, investors, and healthcare professionals. The study covers the period 2019-2033, with a base year of 2025 and a forecast period of 2025-2033. The market is segmented by drug type and geography, offering a granular view of this multi-billion-dollar industry. Key players like Abbott, Amgen, Boehringer Ingelheim, Horizon Pharma, Novartis, Pfizer, and Regeneron are thoroughly examined.
Keywords: Prescription Arthritis Medications, Arthritis Drugs Market, Rheumatoid Arthritis Treatment, Osteoarthritis Treatment, Pharmaceutical Market, Biologics, NSAIDs, Market Size, Market Share, Market Growth, CAGR, Competitive Landscape, Abbott, Amgen, Boehringer Ingelheim, Horizon Pharma, Novartis, Pfizer, Regeneron, Market Analysis, Market Forecast, Industry Trends.
Prescription Arthritis Medications Market Dynamics & Structure
The prescription arthritis medications market is characterized by a moderately concentrated landscape, with a few major players holding significant market share. Technological innovation, primarily in biologics and targeted therapies, is a major driver, while regulatory hurdles and the emergence of biosimilars influence market dynamics. The market is segmented by various arthritis types (Rheumatoid Arthritis, Osteoarthritis, Psoriatic Arthritis etc.), drug classes (DMARDs, NSAIDs, biologics, etc.) and geography. Mergers and acquisitions (M&A) activity is prevalent, reflecting the ongoing consolidation and competition within the sector. The aging global population and the increasing prevalence of arthritis contribute significantly to market growth.
- Market Concentration: Top 5 players hold approximately xx% of the market share in 2025 (estimated).
- Technological Innovation: Focus on targeted therapies and biosimilars is driving innovation, but high R&D costs and regulatory approval processes pose significant challenges.
- Regulatory Frameworks: Stringent regulatory approvals, patent expirations, and pricing pressures impact market dynamics.
- Competitive Product Substitutes: The availability of over-the-counter pain relievers and alternative therapies creates competition.
- End-User Demographics: The aging population and increasing prevalence of arthritis across developed and developing nations are key drivers.
- M&A Trends: xx major M&A deals were recorded between 2019-2024, valued at approximately $xx million.
Prescription Arthritis Medications Growth Trends & Insights
The prescription arthritis medications market witnessed a CAGR of xx% during the historical period (2019-2024), and is projected to grow at a CAGR of xx% during the forecast period (2025-2033). This growth is fueled by several factors, including the rising prevalence of arthritis globally, advancements in treatment modalities, increased healthcare expenditure, and improved access to healthcare services. Technological disruptions, such as the emergence of biosimilars, are reshaping the competitive landscape. Consumer behavior is also evolving, with a growing preference for convenient and effective treatment options.
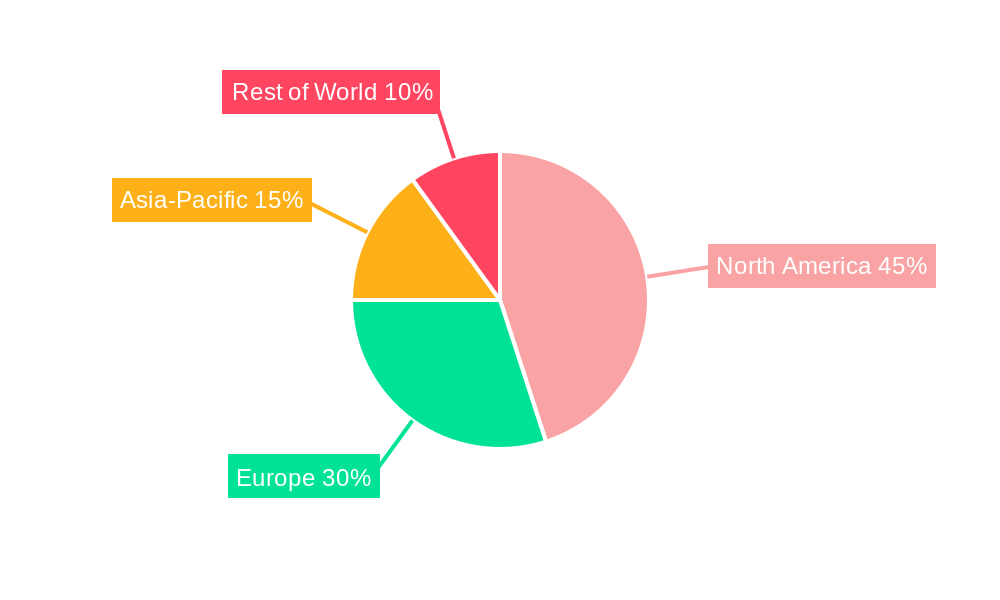
Dominant Regions, Countries, or Segments in Prescription Arthritis Medications
North America and Europe currently dominate the prescription arthritis medications market, driven by high prevalence rates, robust healthcare infrastructure, and strong regulatory frameworks. However, emerging markets in Asia-Pacific, particularly in countries like China and India, are exhibiting significant growth potential due to rising disposable income, increased awareness of arthritis, and expanding healthcare access.
- North America: High market share, driven by high healthcare expenditure and advanced treatment options.
- Europe: Significant market size, influenced by aging population and established healthcare systems.
- Asia-Pacific: Fastest-growing region, propelled by rising prevalence, increasing healthcare spending, and expanding healthcare infrastructure. Significant growth expected in China and India.
- Key Drivers: Aging population, increasing prevalence of arthritis, higher healthcare expenditure, improved access to healthcare.
Prescription Arthritis Medications Product Landscape
The market encompasses a diverse range of products, including NSAIDs, DMARDs, biologics, and other targeted therapies. Recent innovations focus on improving efficacy, reducing side effects, and developing more convenient administration methods. Biosimilars are increasingly gaining traction, offering cost-effective alternatives to branded biologics. Unique selling propositions often center around improved tolerability, efficacy, and targeted action on specific inflammatory pathways.
Key Drivers, Barriers & Challenges in Prescription Arthritis Medications
Key Drivers:
- Rising prevalence of arthritis globally.
- Technological advancements leading to improved treatment options.
- Increased healthcare spending and insurance coverage.
Challenges & Restraints:
- High cost of biologics and advanced therapies, impacting affordability.
- Emergence of biosimilars resulting in price competition.
- Stringent regulatory requirements for new drug approvals, delaying market entry.
- Potential side effects and safety concerns associated with certain treatments.
Emerging Opportunities in Prescription Arthritis Medications
- Untapped markets in developing economies present significant growth opportunities.
- Development of novel therapies targeting specific disease mechanisms holds immense potential.
- Personalized medicine and targeted therapies offer scope for improved treatment outcomes and patient stratification.
Growth Accelerators in the Prescription Arthritis Medications Industry
Technological breakthroughs, particularly in the field of biologics and targeted therapies, are driving market growth. Strategic partnerships and collaborations between pharmaceutical companies and research institutions are accelerating innovation. Market expansion strategies, particularly in emerging markets, are creating new revenue streams.
Key Players Shaping the Prescription Arthritis Medications Market
Notable Milestones in Prescription Arthritis Medications Sector
- 2021: FDA approval of X drug for rheumatoid arthritis.
- 2022: Launch of Y biosimilar by Company Z, impacting market share dynamics.
- 2023: Acquisition of Company A by Company B, leading to portfolio expansion.
- 2024: Publication of clinical trial data demonstrating efficacy of new targeted therapy.
In-Depth Prescription Arthritis Medications Market Outlook
The prescription arthritis medications market is poised for significant growth over the next decade. Continued innovation, expanding access to healthcare, and the aging global population will fuel market expansion. Strategic partnerships, focused R&D efforts, and successful market penetration in emerging economies will be crucial for achieving long-term success in this dynamic industry. Opportunities exist for companies to leverage technology and develop novel treatment options, particularly targeted therapies and personalized medicine approaches, thereby positioning themselves as market leaders.
Prescription Arthritis Medications Segmentation
-
1. Application
- 1.1. Hospital Pharmacies
- 1.2. Online Pharmacies
- 1.3. Retail Pharmacies
-
2. Types
- 2.1. Oral
- 2.2. Topical
Prescription Arthritis Medications Segmentation By Geography
-
1. North America
- 1.1. United States
- 1.2. Canada
- 1.3. Mexico
-
2. South America
- 2.1. Brazil
- 2.2. Argentina
- 2.3. Rest of South America
-
3. Europe
- 3.1. United Kingdom
- 3.2. Germany
- 3.3. France
- 3.4. Italy
- 3.5. Spain
- 3.6. Russia
- 3.7. Benelux
- 3.8. Nordics
- 3.9. Rest of Europe
-
4. Middle East & Africa
- 4.1. Turkey
- 4.2. Israel
- 4.3. GCC
- 4.4. North Africa
- 4.5. South Africa
- 4.6. Rest of Middle East & Africa
-
5. Asia Pacific
- 5.1. China
- 5.2. India
- 5.3. Japan
- 5.4. South Korea
- 5.5. ASEAN
- 5.6. Oceania
- 5.7. Rest of Asia Pacific
Prescription Arthritis Medications Regional Market Share
Geographic Coverage of Prescription Arthritis Medications
Prescription Arthritis Medications REPORT HIGHLIGHTS
| Aspects | Details |
|---|---|
| Study Period | 2020-2034 |
| Base Year | 2025 |
| Estimated Year | 2026 |
| Forecast Period | 2026-2034 |
| Historical Period | 2020-2025 |
| Growth Rate | CAGR of 9.87% from 2020-2034 |
| Segmentation |
|
Table of Contents
- 1. Introduction
- 1.1. Research Scope
- 1.2. Market Segmentation
- 1.3. Research Methodology
- 1.4. Definitions and Assumptions
- 2. Executive Summary
- 2.1. Introduction
- 3. Market Dynamics
- 3.1. Introduction
- 3.2. Market Drivers
- 3.3. Market Restrains
- 3.4. Market Trends
- 4. Market Factor Analysis
- 4.1. Porters Five Forces
- 4.2. Supply/Value Chain
- 4.3. PESTEL analysis
- 4.4. Market Entropy
- 4.5. Patent/Trademark Analysis
- 5. Global Prescription Arthritis Medications Analysis, Insights and Forecast, 2020-2032
- 5.1. Market Analysis, Insights and Forecast - by Application
- 5.1.1. Hospital Pharmacies
- 5.1.2. Online Pharmacies
- 5.1.3. Retail Pharmacies
- 5.2. Market Analysis, Insights and Forecast - by Types
- 5.2.1. Oral
- 5.2.2. Topical
- 5.3. Market Analysis, Insights and Forecast - by Region
- 5.3.1. North America
- 5.3.2. South America
- 5.3.3. Europe
- 5.3.4. Middle East & Africa
- 5.3.5. Asia Pacific
- 5.1. Market Analysis, Insights and Forecast - by Application
- 6. North America Prescription Arthritis Medications Analysis, Insights and Forecast, 2020-2032
- 6.1. Market Analysis, Insights and Forecast - by Application
- 6.1.1. Hospital Pharmacies
- 6.1.2. Online Pharmacies
- 6.1.3. Retail Pharmacies
- 6.2. Market Analysis, Insights and Forecast - by Types
- 6.2.1. Oral
- 6.2.2. Topical
- 6.1. Market Analysis, Insights and Forecast - by Application
- 7. South America Prescription Arthritis Medications Analysis, Insights and Forecast, 2020-2032
- 7.1. Market Analysis, Insights and Forecast - by Application
- 7.1.1. Hospital Pharmacies
- 7.1.2. Online Pharmacies
- 7.1.3. Retail Pharmacies
- 7.2. Market Analysis, Insights and Forecast - by Types
- 7.2.1. Oral
- 7.2.2. Topical
- 7.1. Market Analysis, Insights and Forecast - by Application
- 8. Europe Prescription Arthritis Medications Analysis, Insights and Forecast, 2020-2032
- 8.1. Market Analysis, Insights and Forecast - by Application
- 8.1.1. Hospital Pharmacies
- 8.1.2. Online Pharmacies
- 8.1.3. Retail Pharmacies
- 8.2. Market Analysis, Insights and Forecast - by Types
- 8.2.1. Oral
- 8.2.2. Topical
- 8.1. Market Analysis, Insights and Forecast - by Application
- 9. Middle East & Africa Prescription Arthritis Medications Analysis, Insights and Forecast, 2020-2032
- 9.1. Market Analysis, Insights and Forecast - by Application
- 9.1.1. Hospital Pharmacies
- 9.1.2. Online Pharmacies
- 9.1.3. Retail Pharmacies
- 9.2. Market Analysis, Insights and Forecast - by Types
- 9.2.1. Oral
- 9.2.2. Topical
- 9.1. Market Analysis, Insights and Forecast - by Application
- 10. Asia Pacific Prescription Arthritis Medications Analysis, Insights and Forecast, 2020-2032
- 10.1. Market Analysis, Insights and Forecast - by Application
- 10.1.1. Hospital Pharmacies
- 10.1.2. Online Pharmacies
- 10.1.3. Retail Pharmacies
- 10.2. Market Analysis, Insights and Forecast - by Types
- 10.2.1. Oral
- 10.2.2. Topical
- 10.1. Market Analysis, Insights and Forecast - by Application
- 11. Competitive Analysis
- 11.1. Global Market Share Analysis 2025
- 11.2. Company Profiles
- 11.2.1 Abbott
- 11.2.1.1. Overview
- 11.2.1.2. Products
- 11.2.1.3. SWOT Analysis
- 11.2.1.4. Recent Developments
- 11.2.1.5. Financials (Based on Availability)
- 11.2.2 Amgen
- 11.2.2.1. Overview
- 11.2.2.2. Products
- 11.2.2.3. SWOT Analysis
- 11.2.2.4. Recent Developments
- 11.2.2.5. Financials (Based on Availability)
- 11.2.3 Boehringer Ingelheim
- 11.2.3.1. Overview
- 11.2.3.2. Products
- 11.2.3.3. SWOT Analysis
- 11.2.3.4. Recent Developments
- 11.2.3.5. Financials (Based on Availability)
- 11.2.4 Horizon Pharma
- 11.2.4.1. Overview
- 11.2.4.2. Products
- 11.2.4.3. SWOT Analysis
- 11.2.4.4. Recent Developments
- 11.2.4.5. Financials (Based on Availability)
- 11.2.5 Novartis
- 11.2.5.1. Overview
- 11.2.5.2. Products
- 11.2.5.3. SWOT Analysis
- 11.2.5.4. Recent Developments
- 11.2.5.5. Financials (Based on Availability)
- 11.2.6 Pfizer
- 11.2.6.1. Overview
- 11.2.6.2. Products
- 11.2.6.3. SWOT Analysis
- 11.2.6.4. Recent Developments
- 11.2.6.5. Financials (Based on Availability)
- 11.2.7 Regeneron
- 11.2.7.1. Overview
- 11.2.7.2. Products
- 11.2.7.3. SWOT Analysis
- 11.2.7.4. Recent Developments
- 11.2.7.5. Financials (Based on Availability)
- 11.2.1 Abbott
List of Figures
- Figure 1: Global Prescription Arthritis Medications Revenue Breakdown (billion, %) by Region 2025 & 2033
- Figure 2: North America Prescription Arthritis Medications Revenue (billion), by Application 2025 & 2033
- Figure 3: North America Prescription Arthritis Medications Revenue Share (%), by Application 2025 & 2033
- Figure 4: North America Prescription Arthritis Medications Revenue (billion), by Types 2025 & 2033
- Figure 5: North America Prescription Arthritis Medications Revenue Share (%), by Types 2025 & 2033
- Figure 6: North America Prescription Arthritis Medications Revenue (billion), by Country 2025 & 2033
- Figure 7: North America Prescription Arthritis Medications Revenue Share (%), by Country 2025 & 2033
- Figure 8: South America Prescription Arthritis Medications Revenue (billion), by Application 2025 & 2033
- Figure 9: South America Prescription Arthritis Medications Revenue Share (%), by Application 2025 & 2033
- Figure 10: South America Prescription Arthritis Medications Revenue (billion), by Types 2025 & 2033
- Figure 11: South America Prescription Arthritis Medications Revenue Share (%), by Types 2025 & 2033
- Figure 12: South America Prescription Arthritis Medications Revenue (billion), by Country 2025 & 2033
- Figure 13: South America Prescription Arthritis Medications Revenue Share (%), by Country 2025 & 2033
- Figure 14: Europe Prescription Arthritis Medications Revenue (billion), by Application 2025 & 2033
- Figure 15: Europe Prescription Arthritis Medications Revenue Share (%), by Application 2025 & 2033
- Figure 16: Europe Prescription Arthritis Medications Revenue (billion), by Types 2025 & 2033
- Figure 17: Europe Prescription Arthritis Medications Revenue Share (%), by Types 2025 & 2033
- Figure 18: Europe Prescription Arthritis Medications Revenue (billion), by Country 2025 & 2033
- Figure 19: Europe Prescription Arthritis Medications Revenue Share (%), by Country 2025 & 2033
- Figure 20: Middle East & Africa Prescription Arthritis Medications Revenue (billion), by Application 2025 & 2033
- Figure 21: Middle East & Africa Prescription Arthritis Medications Revenue Share (%), by Application 2025 & 2033
- Figure 22: Middle East & Africa Prescription Arthritis Medications Revenue (billion), by Types 2025 & 2033
- Figure 23: Middle East & Africa Prescription Arthritis Medications Revenue Share (%), by Types 2025 & 2033
- Figure 24: Middle East & Africa Prescription Arthritis Medications Revenue (billion), by Country 2025 & 2033
- Figure 25: Middle East & Africa Prescription Arthritis Medications Revenue Share (%), by Country 2025 & 2033
- Figure 26: Asia Pacific Prescription Arthritis Medications Revenue (billion), by Application 2025 & 2033
- Figure 27: Asia Pacific Prescription Arthritis Medications Revenue Share (%), by Application 2025 & 2033
- Figure 28: Asia Pacific Prescription Arthritis Medications Revenue (billion), by Types 2025 & 2033
- Figure 29: Asia Pacific Prescription Arthritis Medications Revenue Share (%), by Types 2025 & 2033
- Figure 30: Asia Pacific Prescription Arthritis Medications Revenue (billion), by Country 2025 & 2033
- Figure 31: Asia Pacific Prescription Arthritis Medications Revenue Share (%), by Country 2025 & 2033
List of Tables
- Table 1: Global Prescription Arthritis Medications Revenue billion Forecast, by Application 2020 & 2033
- Table 2: Global Prescription Arthritis Medications Revenue billion Forecast, by Types 2020 & 2033
- Table 3: Global Prescription Arthritis Medications Revenue billion Forecast, by Region 2020 & 2033
- Table 4: Global Prescription Arthritis Medications Revenue billion Forecast, by Application 2020 & 2033
- Table 5: Global Prescription Arthritis Medications Revenue billion Forecast, by Types 2020 & 2033
- Table 6: Global Prescription Arthritis Medications Revenue billion Forecast, by Country 2020 & 2033
- Table 7: United States Prescription Arthritis Medications Revenue (billion) Forecast, by Application 2020 & 2033
- Table 8: Canada Prescription Arthritis Medications Revenue (billion) Forecast, by Application 2020 & 2033
- Table 9: Mexico Prescription Arthritis Medications Revenue (billion) Forecast, by Application 2020 & 2033
- Table 10: Global Prescription Arthritis Medications Revenue billion Forecast, by Application 2020 & 2033
- Table 11: Global Prescription Arthritis Medications Revenue billion Forecast, by Types 2020 & 2033
- Table 12: Global Prescription Arthritis Medications Revenue billion Forecast, by Country 2020 & 2033
- Table 13: Brazil Prescription Arthritis Medications Revenue (billion) Forecast, by Application 2020 & 2033
- Table 14: Argentina Prescription Arthritis Medications Revenue (billion) Forecast, by Application 2020 & 2033
- Table 15: Rest of South America Prescription Arthritis Medications Revenue (billion) Forecast, by Application 2020 & 2033
- Table 16: Global Prescription Arthritis Medications Revenue billion Forecast, by Application 2020 & 2033
- Table 17: Global Prescription Arthritis Medications Revenue billion Forecast, by Types 2020 & 2033
- Table 18: Global Prescription Arthritis Medications Revenue billion Forecast, by Country 2020 & 2033
- Table 19: United Kingdom Prescription Arthritis Medications Revenue (billion) Forecast, by Application 2020 & 2033
- Table 20: Germany Prescription Arthritis Medications Revenue (billion) Forecast, by Application 2020 & 2033
- Table 21: France Prescription Arthritis Medications Revenue (billion) Forecast, by Application 2020 & 2033
- Table 22: Italy Prescription Arthritis Medications Revenue (billion) Forecast, by Application 2020 & 2033
- Table 23: Spain Prescription Arthritis Medications Revenue (billion) Forecast, by Application 2020 & 2033
- Table 24: Russia Prescription Arthritis Medications Revenue (billion) Forecast, by Application 2020 & 2033
- Table 25: Benelux Prescription Arthritis Medications Revenue (billion) Forecast, by Application 2020 & 2033
- Table 26: Nordics Prescription Arthritis Medications Revenue (billion) Forecast, by Application 2020 & 2033
- Table 27: Rest of Europe Prescription Arthritis Medications Revenue (billion) Forecast, by Application 2020 & 2033
- Table 28: Global Prescription Arthritis Medications Revenue billion Forecast, by Application 2020 & 2033
- Table 29: Global Prescription Arthritis Medications Revenue billion Forecast, by Types 2020 & 2033
- Table 30: Global Prescription Arthritis Medications Revenue billion Forecast, by Country 2020 & 2033
- Table 31: Turkey Prescription Arthritis Medications Revenue (billion) Forecast, by Application 2020 & 2033
- Table 32: Israel Prescription Arthritis Medications Revenue (billion) Forecast, by Application 2020 & 2033
- Table 33: GCC Prescription Arthritis Medications Revenue (billion) Forecast, by Application 2020 & 2033
- Table 34: North Africa Prescription Arthritis Medications Revenue (billion) Forecast, by Application 2020 & 2033
- Table 35: South Africa Prescription Arthritis Medications Revenue (billion) Forecast, by Application 2020 & 2033
- Table 36: Rest of Middle East & Africa Prescription Arthritis Medications Revenue (billion) Forecast, by Application 2020 & 2033
- Table 37: Global Prescription Arthritis Medications Revenue billion Forecast, by Application 2020 & 2033
- Table 38: Global Prescription Arthritis Medications Revenue billion Forecast, by Types 2020 & 2033
- Table 39: Global Prescription Arthritis Medications Revenue billion Forecast, by Country 2020 & 2033
- Table 40: China Prescription Arthritis Medications Revenue (billion) Forecast, by Application 2020 & 2033
- Table 41: India Prescription Arthritis Medications Revenue (billion) Forecast, by Application 2020 & 2033
- Table 42: Japan Prescription Arthritis Medications Revenue (billion) Forecast, by Application 2020 & 2033
- Table 43: South Korea Prescription Arthritis Medications Revenue (billion) Forecast, by Application 2020 & 2033
- Table 44: ASEAN Prescription Arthritis Medications Revenue (billion) Forecast, by Application 2020 & 2033
- Table 45: Oceania Prescription Arthritis Medications Revenue (billion) Forecast, by Application 2020 & 2033
- Table 46: Rest of Asia Pacific Prescription Arthritis Medications Revenue (billion) Forecast, by Application 2020 & 2033
Frequently Asked Questions
1. What is the projected Compound Annual Growth Rate (CAGR) of the Prescription Arthritis Medications?
The projected CAGR is approximately 9.87%.
2. Which companies are prominent players in the Prescription Arthritis Medications?
Key companies in the market include Abbott, Amgen, Boehringer Ingelheim, Horizon Pharma, Novartis, Pfizer, Regeneron.
3. What are the main segments of the Prescription Arthritis Medications?
The market segments include Application, Types.
4. Can you provide details about the market size?
The market size is estimated to be USD 4.1 billion as of 2022.
5. What are some drivers contributing to market growth?
N/A
6. What are the notable trends driving market growth?
N/A
7. Are there any restraints impacting market growth?
N/A
8. Can you provide examples of recent developments in the market?
N/A
9. What pricing options are available for accessing the report?
Pricing options include single-user, multi-user, and enterprise licenses priced at USD 5600.00, USD 8400.00, and USD 11200.00 respectively.
10. Is the market size provided in terms of value or volume?
The market size is provided in terms of value, measured in billion.
11. Are there any specific market keywords associated with the report?
Yes, the market keyword associated with the report is "Prescription Arthritis Medications," which aids in identifying and referencing the specific market segment covered.
12. How do I determine which pricing option suits my needs best?
The pricing options vary based on user requirements and access needs. Individual users may opt for single-user licenses, while businesses requiring broader access may choose multi-user or enterprise licenses for cost-effective access to the report.
13. Are there any additional resources or data provided in the Prescription Arthritis Medications report?
While the report offers comprehensive insights, it's advisable to review the specific contents or supplementary materials provided to ascertain if additional resources or data are available.
14. How can I stay updated on further developments or reports in the Prescription Arthritis Medications?
To stay informed about further developments, trends, and reports in the Prescription Arthritis Medications, consider subscribing to industry newsletters, following relevant companies and organizations, or regularly checking reputable industry news sources and publications.
Methodology
Step 1 - Identification of Relevant Samples Size from Population Database


Step 2 - Approaches for Defining Global Market Size (Value, Volume* & Price*)

Note*: In applicable scenarios
Step 3 - Data Sources
Primary Research
- Web Analytics
- Survey Reports
- Research Institute
- Latest Research Reports
- Opinion Leaders
Secondary Research
- Annual Reports
- White Paper
- Latest Press Release
- Industry Association
- Paid Database
- Investor Presentations

Step 4 - Data Triangulation
Involves using different sources of information in order to increase the validity of a study
These sources are likely to be stakeholders in a program - participants, other researchers, program staff, other community members, and so on.
Then we put all data in single framework & apply various statistical tools to find out the dynamic on the market.
During the analysis stage, feedback from the stakeholder groups would be compared to determine areas of agreement as well as areas of divergence