

Key Insights
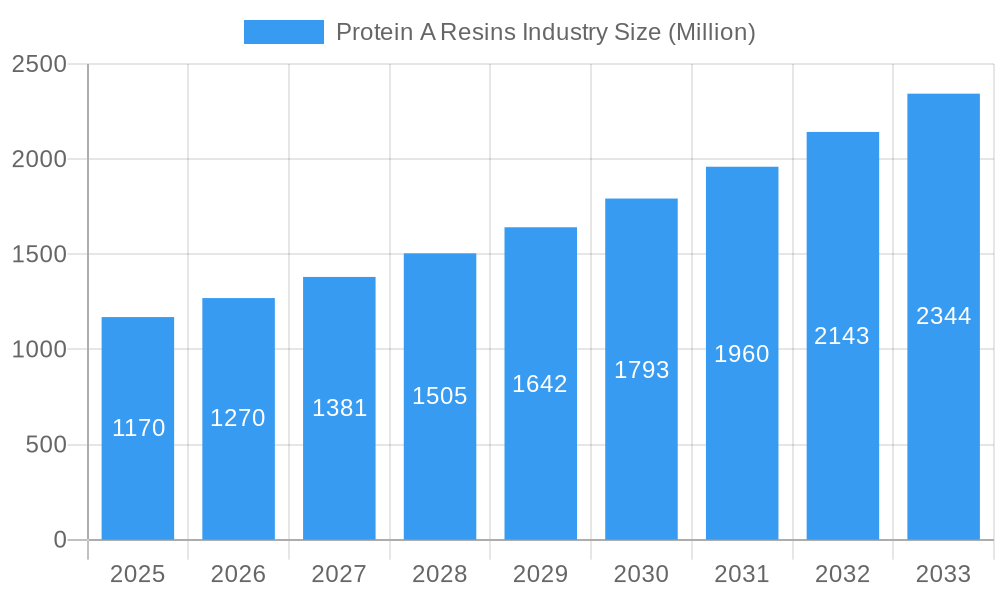
The Protein A Resins market, valued at $1.17 billion in 2025, is poised for robust growth, exhibiting a Compound Annual Growth Rate (CAGR) of 8.69% from 2025 to 2033. This expansion is driven primarily by the burgeoning biopharmaceutical industry's increasing demand for high-purity monoclonal antibodies (mAbs) used in various therapeutic applications. Advancements in downstream processing technologies, particularly the adoption of efficient and scalable Protein A resin-based purification methods, are further fueling market growth. The increasing prevalence of chronic diseases globally is also contributing to the higher demand for biologics, thereby boosting the market for Protein A resins. Furthermore, the rising adoption of single-use technologies in biomanufacturing is reducing capital expenditure and operational costs, making Protein A resin-based purification more accessible and cost-effective. The market is segmented by product type (agarose-based, glass or silica-based, organic polymer-based) and application (antibody purification, immunoprecipitation), reflecting the diverse needs of pharmaceutical and biopharmaceutical companies, research laboratories, and other end-users. Competition is intense, with key players such as Abcam, Repligen, Bio-Rad, Merck, and others continuously innovating to improve resin performance and expand their product portfolios.
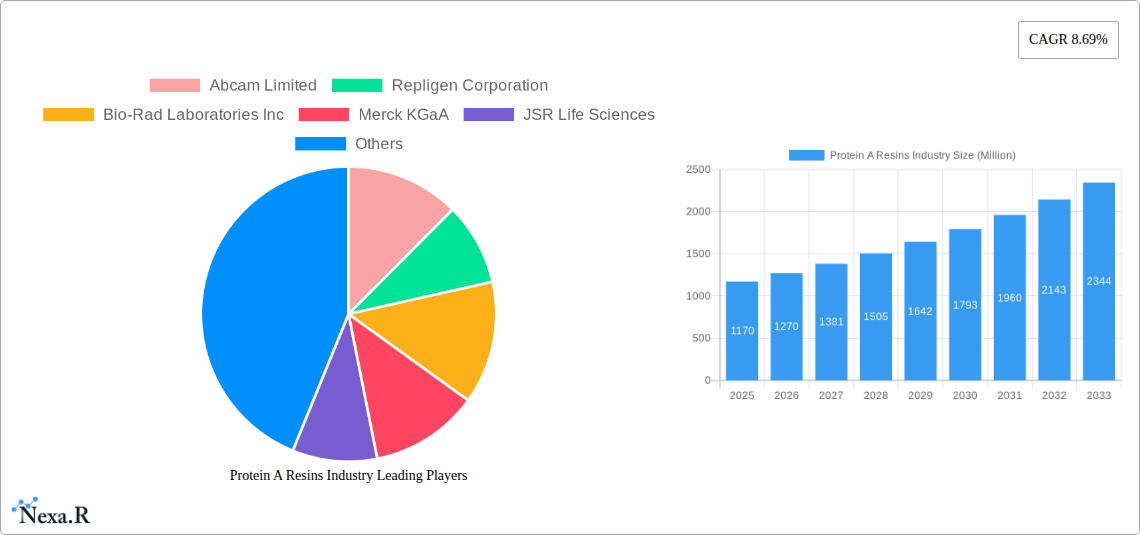
Protein A Resins Industry Market Size (In Billion)
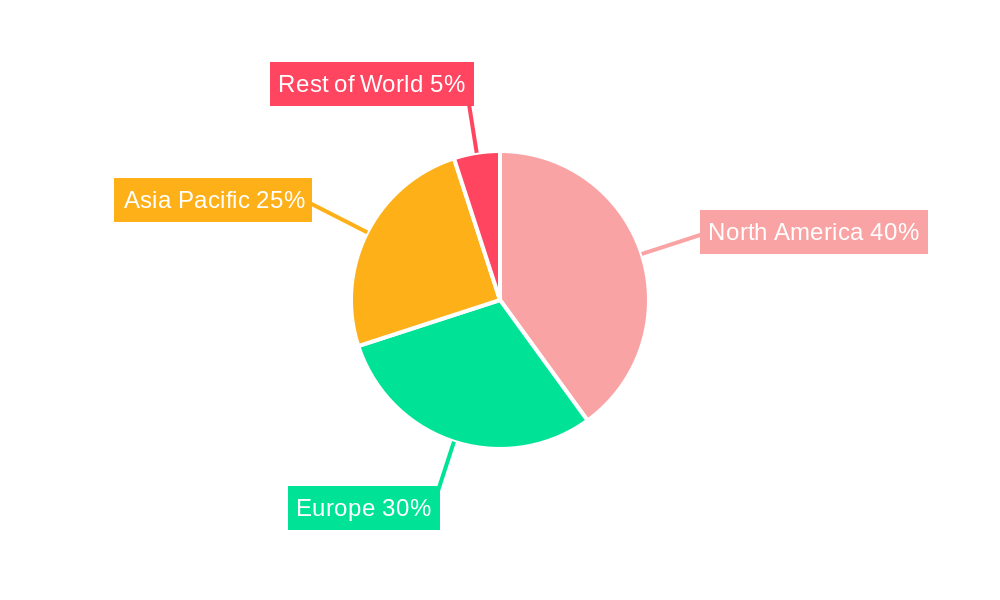
The geographical distribution of the Protein A resins market shows significant presence across North America, Europe, and Asia-Pacific. North America currently holds a substantial market share, driven by a strong biopharmaceutical industry and advanced research infrastructure. However, Asia-Pacific is experiencing rapid growth, fueled by increasing investments in biopharmaceutical manufacturing facilities and a growing demand for biosimilars. Europe also maintains a significant share, driven by robust research activities and regulatory support for the development and commercialization of biopharmaceuticals. Ongoing research and development efforts focused on enhancing resin selectivity, capacity, and durability are expected to further shape the market landscape in the coming years. The market will likely see increasing consolidation as larger players acquire smaller companies to expand their product offerings and market reach. The focus will continue to be on developing more efficient and cost-effective purification solutions to address the ever-increasing demand for high-quality biologics.
Protein A Resins Industry Company Market Share
Protein A Resins Industry: A Comprehensive Market Analysis (2019-2033)
This comprehensive report provides an in-depth analysis of the Protein A Resins industry, encompassing market dynamics, growth trends, competitive landscape, and future outlook. With a focus on key segments – including Agarose-based, Glass/Silica-based, and Organic Polymer-based resins – and applications like antibody purification and immunoprecipitation, this report is an invaluable resource for industry professionals, investors, and researchers. The study period covers 2019-2033, with 2025 as the base year and a forecast period of 2025-2033. The market size is presented in Million units.
Protein A Resins Industry Market Dynamics & Structure
The Protein A Resins market is characterized by a moderately concentrated landscape, with several key players holding significant market share. Technological innovation, driven by the need for higher purity, efficiency, and scalability in biopharmaceutical production, is a primary growth driver. Stringent regulatory frameworks, particularly within the pharmaceutical and biopharmaceutical sectors, significantly impact market dynamics. The market faces competition from alternative purification methods, but Protein A resins maintain dominance due to their high specificity and efficacy. End-user demographics are heavily skewed towards pharmaceutical and biopharmaceutical companies, with a growing contribution from research laboratories. M&A activity has been moderate, with strategic acquisitions aimed at expanding product portfolios and strengthening market positions.
- Market Concentration: Moderately concentrated, with top 5 players holding approximately xx% market share in 2024.
- Technological Innovation: Focus on enhanced binding capacity, improved scalability, and reduced process times.
- Regulatory Landscape: Stringent regulations related to biopharmaceutical manufacturing and quality control.
- Competitive Substitutes: Alternative purification technologies, but Protein A resins maintain a strong competitive edge.
- M&A Activity: xx deals recorded between 2019 and 2024, primarily focused on expanding product offerings and geographical reach.
- Innovation Barriers: High R&D costs, lengthy regulatory approval processes.
Protein A Resins Industry Growth Trends & Insights
The Protein A Resins market experienced robust growth during the historical period (2019-2024), driven by rising demand for biologics and increasing adoption of advanced purification techniques. This trend is expected to continue throughout the forecast period (2025-2033), with a projected CAGR of xx%. Market penetration remains high in developed regions but is expected to increase significantly in emerging economies as healthcare infrastructure improves and biopharmaceutical manufacturing expands. Technological disruptions, such as the development of novel resin materials and automation, are further boosting market growth. Changes in consumer behavior are minimal, given the B2B nature of the industry, but focus on higher quality and efficiency from resins is a constant.
Dominant Regions, Countries, or Segments in Protein A Resins Industry
North America and Europe currently dominate the Protein A Resins market, driven by strong biopharmaceutical industries, robust research and development activities, and advanced healthcare infrastructure. However, the Asia-Pacific region is experiencing rapid growth, fueled by increasing investments in biotechnology and pharmaceutical manufacturing.
Dominant Segments:
- Product: Agarose-based resins currently hold the largest market share due to their established use and cost-effectiveness. However, organic polymer-based resins are witnessing significant growth due to their enhanced performance characteristics.
- Application: Antibody purification dominates the market, owing to the high demand for monoclonal antibodies in therapeutic applications.
- End User: Pharmaceutical and biopharmaceutical companies are the primary end-users, driven by the substantial need for high-purity proteins in drug development and manufacturing.
Key Drivers:
- North America: Strong biopharmaceutical industry, high R&D investment, and advanced manufacturing capabilities.
- Europe: Well-established regulatory frameworks, robust research infrastructure, and a significant presence of key market players.
- Asia-Pacific: Rapid growth of the biopharmaceutical industry, increasing investments in healthcare infrastructure, and a large pool of skilled labor.
Protein A Resins Industry Product Landscape
Protein A resins are predominantly categorized into agarose-based, glass or silica-based, and organic polymer-based types. Continuous innovation focuses on improving binding capacity, selectivity, and durability. Advancements include the development of novel resin chemistries and optimized particle sizes to enhance purification efficiency and reduce processing times. Unique selling propositions often center on superior binding capacity, faster purification speeds, and cost-effectiveness. Recent launches such as Praesto CH1 highlight the move towards resins capable of purifying more complex antibody formats.
Key Drivers, Barriers & Challenges in Protein A Resins Industry
Key Drivers:
- Increasing demand for biologics and monoclonal antibodies.
- Technological advancements leading to improved resin performance.
- Growing investments in biotechnology and pharmaceutical research.
Key Challenges:
- High production costs associated with resin development and manufacturing.
- Stringent regulatory requirements for biopharmaceutical production.
- Competition from alternative protein purification methods. Estimated impact on market growth: xx%.
Emerging Opportunities in Protein A Resins Industry
- Growing demand for specialized resins for purifying novel antibody formats (e.g., bispecific antibodies).
- Expansion into emerging markets with developing biopharmaceutical industries.
- Development of sustainable and environmentally friendly resin production processes.
Growth Accelerators in the Protein A Resins Industry
Technological breakthroughs in resin design and manufacturing are key growth accelerators. Strategic partnerships between resin manufacturers and biopharmaceutical companies are also driving market expansion. Furthermore, the continuous development of new and innovative applications for protein A resins is fostering long-term market growth.
Key Players Shaping the Protein A Resins Industry Market
Notable Milestones in Protein A Resins Industry Sector
- February 2024: Purolite, an Ecolab company, and Repligen Corporation launched Praesto CH1, a new 70 μm agarose-based affinity resin for purifying specialized mAbs. This significantly expands the capabilities of protein A resins.
- January 2024: The merger of Dutch Oxitope and Norwegian Arxx to form Calluna Pharma Inc., raising USD 80.4 million in Series A financing for monoclonal antibody therapies. This demonstrates investor confidence and the growth potential of the target market for Protein A resins.
In-Depth Protein A Resins Industry Market Outlook
The Protein A Resins market is poised for continued growth, driven by technological advancements, increased demand for biologics, and expansion into emerging markets. Strategic partnerships, focused R&D, and the development of next-generation resins will be crucial in capturing the significant market opportunities available in the coming years. The long-term outlook is positive, with strong potential for market expansion across various segments and geographical regions.
Protein A Resins Industry Segmentation
-
1. Product
- 1.1. Agarose -based Protein
- 1.2. Glass or Silica-based Protein
- 1.3. Organic Polymer-based Protein
-
2. Application
- 2.1. Antibody Purification
- 2.2. Immunoprecipitation
-
3. End User
- 3.1. Pharmaceutical and Biopharmaceutical Companies
- 3.2. Research Laboratories
- 3.3. Other End Users
Protein A Resins Industry Segmentation By Geography
-
1. North America
- 1.1. United States
- 1.2. Canada
- 1.3. Mexico
-
2. Europe
- 2.1. Germany
- 2.2. United Kingdom
- 2.3. France
- 2.4. Italy
- 2.5. Spain
- 2.6. Rest of Europe
-
3. Asia Pacific
- 3.1. China
- 3.2. Japan
- 3.3. India
- 3.4. Australia
- 3.5. South Korea
- 3.6. Rest of Asia Pacific
-
4. Middle East and Africa
- 4.1. GCC
- 4.2. South Africa
- 4.3. Rest of Middle East and Africa
-
5. South America
- 5.1. Brazil
- 5.2. Argentina
- 5.3. Rest of South America
Protein A Resins Industry Regional Market Share
Geographic Coverage of Protein A Resins Industry
Protein A Resins Industry REPORT HIGHLIGHTS
| Aspects | Details |
|---|---|
| Study Period | 2020-2034 |
| Base Year | 2025 |
| Estimated Year | 2026 |
| Forecast Period | 2026-2034 |
| Historical Period | 2020-2025 |
| Growth Rate | CAGR of 8.69% from 2020-2034 |
| Segmentation |
|
Table of Contents
- 1. Introduction
- 1.1. Research Scope
- 1.2. Market Segmentation
- 1.3. Research Objective
- 1.4. Definitions and Assumptions
- 2. Executive Summary
- 2.1. Market Snapshot
- 3. Market Dynamics
- 3.1. Market Drivers
- 3.2. Market Restrains
- 3.3. Market Trends
- 3.4. Market Opportunities
- 4. Market Factor Analysis
- 4.1. Porters Five Forces
- 4.1.1. Bargaining Power of Suppliers
- 4.1.2. Bargaining Power of Buyers
- 4.1.3. Threat of New Entrants
- 4.1.4. Threat of Substitutes
- 4.1.5. Competitive Rivalry
- 4.2. PESTEL analysis
- 4.3. BCG Analysis
- 4.3.1. Stars (High Growth, High Market Share)
- 4.3.2. Cash Cows (Low Growth, High Market Share)
- 4.3.3. Question Mark (High Growth, Low Market Share)
- 4.3.4. Dogs (Low Growth, Low Market Share)
- 4.4. Ansoff Matrix Analysis
- 4.5. Supply Chain Analysis
- 4.6. Regulatory Landscape
- 4.7. Current Market Potential and Opportunity Assessment (TAM–SAM–SOM Framework)
- 4.8. NRP Analyst Note
- 4.1. Porters Five Forces
- 5. Market Analysis, Insights and Forecast 2021-2033
- 5.1. Market Analysis, Insights and Forecast - by Product
- 5.1.1. Agarose -based Protein
- 5.1.2. Glass or Silica-based Protein
- 5.1.3. Organic Polymer-based Protein
- 5.2. Market Analysis, Insights and Forecast - by Application
- 5.2.1. Antibody Purification
- 5.2.2. Immunoprecipitation
- 5.3. Market Analysis, Insights and Forecast - by End User
- 5.3.1. Pharmaceutical and Biopharmaceutical Companies
- 5.3.2. Research Laboratories
- 5.3.3. Other End Users
- 5.4. Market Analysis, Insights and Forecast - by Region
- 5.4.1. North America
- 5.4.2. Europe
- 5.4.3. Asia Pacific
- 5.4.4. Middle East and Africa
- 5.4.5. South America
- 5.1. Market Analysis, Insights and Forecast - by Product
- 6. Global Protein A Resins Industry Analysis, Insights and Forecast, 2021-2033
- 6.1. Market Analysis, Insights and Forecast - by Product
- 6.1.1. Agarose -based Protein
- 6.1.2. Glass or Silica-based Protein
- 6.1.3. Organic Polymer-based Protein
- 6.2. Market Analysis, Insights and Forecast - by Application
- 6.2.1. Antibody Purification
- 6.2.2. Immunoprecipitation
- 6.3. Market Analysis, Insights and Forecast - by End User
- 6.3.1. Pharmaceutical and Biopharmaceutical Companies
- 6.3.2. Research Laboratories
- 6.3.3. Other End Users
- 6.1. Market Analysis, Insights and Forecast - by Product
- 7. North America Protein A Resins Industry Analysis, Insights and Forecast, 2020-2032
- 7.1. Market Analysis, Insights and Forecast - by Product
- 7.1.1. Agarose -based Protein
- 7.1.2. Glass or Silica-based Protein
- 7.1.3. Organic Polymer-based Protein
- 7.2. Market Analysis, Insights and Forecast - by Application
- 7.2.1. Antibody Purification
- 7.2.2. Immunoprecipitation
- 7.3. Market Analysis, Insights and Forecast - by End User
- 7.3.1. Pharmaceutical and Biopharmaceutical Companies
- 7.3.2. Research Laboratories
- 7.3.3. Other End Users
- 7.1. Market Analysis, Insights and Forecast - by Product
- 8. Europe Protein A Resins Industry Analysis, Insights and Forecast, 2020-2032
- 8.1. Market Analysis, Insights and Forecast - by Product
- 8.1.1. Agarose -based Protein
- 8.1.2. Glass or Silica-based Protein
- 8.1.3. Organic Polymer-based Protein
- 8.2. Market Analysis, Insights and Forecast - by Application
- 8.2.1. Antibody Purification
- 8.2.2. Immunoprecipitation
- 8.3. Market Analysis, Insights and Forecast - by End User
- 8.3.1. Pharmaceutical and Biopharmaceutical Companies
- 8.3.2. Research Laboratories
- 8.3.3. Other End Users
- 8.1. Market Analysis, Insights and Forecast - by Product
- 9. Asia Pacific Protein A Resins Industry Analysis, Insights and Forecast, 2020-2032
- 9.1. Market Analysis, Insights and Forecast - by Product
- 9.1.1. Agarose -based Protein
- 9.1.2. Glass or Silica-based Protein
- 9.1.3. Organic Polymer-based Protein
- 9.2. Market Analysis, Insights and Forecast - by Application
- 9.2.1. Antibody Purification
- 9.2.2. Immunoprecipitation
- 9.3. Market Analysis, Insights and Forecast - by End User
- 9.3.1. Pharmaceutical and Biopharmaceutical Companies
- 9.3.2. Research Laboratories
- 9.3.3. Other End Users
- 9.1. Market Analysis, Insights and Forecast - by Product
- 10. Middle East and Africa Protein A Resins Industry Analysis, Insights and Forecast, 2020-2032
- 10.1. Market Analysis, Insights and Forecast - by Product
- 10.1.1. Agarose -based Protein
- 10.1.2. Glass or Silica-based Protein
- 10.1.3. Organic Polymer-based Protein
- 10.2. Market Analysis, Insights and Forecast - by Application
- 10.2.1. Antibody Purification
- 10.2.2. Immunoprecipitation
- 10.3. Market Analysis, Insights and Forecast - by End User
- 10.3.1. Pharmaceutical and Biopharmaceutical Companies
- 10.3.2. Research Laboratories
- 10.3.3. Other End Users
- 10.1. Market Analysis, Insights and Forecast - by Product
- 11. South America Protein A Resins Industry Analysis, Insights and Forecast, 2020-2032
- 11.1. Market Analysis, Insights and Forecast - by Product
- 11.1.1. Agarose -based Protein
- 11.1.2. Glass or Silica-based Protein
- 11.1.3. Organic Polymer-based Protein
- 11.2. Market Analysis, Insights and Forecast - by Application
- 11.2.1. Antibody Purification
- 11.2.2. Immunoprecipitation
- 11.3. Market Analysis, Insights and Forecast - by End User
- 11.3.1. Pharmaceutical and Biopharmaceutical Companies
- 11.3.2. Research Laboratories
- 11.3.3. Other End Users
- 11.1. Market Analysis, Insights and Forecast - by Product
- 12. Competitive Analysis
- 12.1. Company Profiles
- 12.1.1 Abcam Limited
- 12.1.1.1. Company Overview
- 12.1.1.2. Products
- 12.1.1.3. Company Financials
- 12.1.1.4. SWOT Analysis
- 12.1.2 Repligen Corporation
- 12.1.2.1. Company Overview
- 12.1.2.2. Products
- 12.1.2.3. Company Financials
- 12.1.2.4. SWOT Analysis
- 12.1.3 Bio-Rad Laboratories Inc
- 12.1.3.1. Company Overview
- 12.1.3.2. Products
- 12.1.3.3. Company Financials
- 12.1.3.4. SWOT Analysis
- 12.1.4 Merck KGaA
- 12.1.4.1. Company Overview
- 12.1.4.2. Products
- 12.1.4.3. Company Financials
- 12.1.4.4. SWOT Analysis
- 12.1.5 JSR Life Sciences
- 12.1.5.1. Company Overview
- 12.1.5.2. Products
- 12.1.5.3. Company Financials
- 12.1.5.4. SWOT Analysis
- 12.1.6 Kaneka Corporation
- 12.1.6.1. Company Overview
- 12.1.6.2. Products
- 12.1.6.3. Company Financials
- 12.1.6.4. SWOT Analysis
- 12.1.7 Genscript Corporation
- 12.1.7.1. Company Overview
- 12.1.7.2. Products
- 12.1.7.3. Company Financials
- 12.1.7.4. SWOT Analysis
- 12.1.8 Tosoh Bioscience LLC
- 12.1.8.1. Company Overview
- 12.1.8.2. Products
- 12.1.8.3. Company Financials
- 12.1.8.4. SWOT Analysis
- 12.1.9 Danaher Corporation (Cytiva)
- 12.1.9.1. Company Overview
- 12.1.9.2. Products
- 12.1.9.3. Company Financials
- 12.1.9.4. SWOT Analysis
- 12.1.10 Axplora
- 12.1.10.1. Company Overview
- 12.1.10.2. Products
- 12.1.10.3. Company Financials
- 12.1.10.4. SWOT Analysis
- 12.1.11 Thermofisher Scientific Inc
- 12.1.11.1. Company Overview
- 12.1.11.2. Products
- 12.1.11.3. Company Financials
- 12.1.11.4. SWOT Analysis
- 12.1.12 Agarose Beads Technologies
- 12.1.12.1. Company Overview
- 12.1.12.2. Products
- 12.1.12.3. Company Financials
- 12.1.12.4. SWOT Analysis
- 12.1.13 Ecolab Inc (Purolite Lifesciences)
- 12.1.13.1. Company Overview
- 12.1.13.2. Products
- 12.1.13.3. Company Financials
- 12.1.13.4. SWOT Analysis
- 12.1.1 Abcam Limited
- 12.2. Market Entropy
- 12.2.1 Company's Key Areas Served
- 12.2.2 Recent Developments
- 12.3. Company Market Share Analysis 2025
- 12.3.1 Top 5 Companies Market Share Analysis
- 12.3.2 Top 3 Companies Market Share Analysis
- 12.4. List of Potential Customers
- 13. Research Methodology
List of Figures
- Figure 1: Global Protein A Resins Industry Revenue Breakdown (Million, %) by Region 2025 & 2033
- Figure 2: Global Protein A Resins Industry Volume Breakdown (K Unit, %) by Region 2025 & 2033
- Figure 3: North America Protein A Resins Industry Revenue (Million), by Product 2025 & 2033
- Figure 4: North America Protein A Resins Industry Volume (K Unit), by Product 2025 & 2033
- Figure 5: North America Protein A Resins Industry Revenue Share (%), by Product 2025 & 2033
- Figure 6: North America Protein A Resins Industry Volume Share (%), by Product 2025 & 2033
- Figure 7: North America Protein A Resins Industry Revenue (Million), by Application 2025 & 2033
- Figure 8: North America Protein A Resins Industry Volume (K Unit), by Application 2025 & 2033
- Figure 9: North America Protein A Resins Industry Revenue Share (%), by Application 2025 & 2033
- Figure 10: North America Protein A Resins Industry Volume Share (%), by Application 2025 & 2033
- Figure 11: North America Protein A Resins Industry Revenue (Million), by End User 2025 & 2033
- Figure 12: North America Protein A Resins Industry Volume (K Unit), by End User 2025 & 2033
- Figure 13: North America Protein A Resins Industry Revenue Share (%), by End User 2025 & 2033
- Figure 14: North America Protein A Resins Industry Volume Share (%), by End User 2025 & 2033
- Figure 15: North America Protein A Resins Industry Revenue (Million), by Country 2025 & 2033
- Figure 16: North America Protein A Resins Industry Volume (K Unit), by Country 2025 & 2033
- Figure 17: North America Protein A Resins Industry Revenue Share (%), by Country 2025 & 2033
- Figure 18: North America Protein A Resins Industry Volume Share (%), by Country 2025 & 2033
- Figure 19: Europe Protein A Resins Industry Revenue (Million), by Product 2025 & 2033
- Figure 20: Europe Protein A Resins Industry Volume (K Unit), by Product 2025 & 2033
- Figure 21: Europe Protein A Resins Industry Revenue Share (%), by Product 2025 & 2033
- Figure 22: Europe Protein A Resins Industry Volume Share (%), by Product 2025 & 2033
- Figure 23: Europe Protein A Resins Industry Revenue (Million), by Application 2025 & 2033
- Figure 24: Europe Protein A Resins Industry Volume (K Unit), by Application 2025 & 2033
- Figure 25: Europe Protein A Resins Industry Revenue Share (%), by Application 2025 & 2033
- Figure 26: Europe Protein A Resins Industry Volume Share (%), by Application 2025 & 2033
- Figure 27: Europe Protein A Resins Industry Revenue (Million), by End User 2025 & 2033
- Figure 28: Europe Protein A Resins Industry Volume (K Unit), by End User 2025 & 2033
- Figure 29: Europe Protein A Resins Industry Revenue Share (%), by End User 2025 & 2033
- Figure 30: Europe Protein A Resins Industry Volume Share (%), by End User 2025 & 2033
- Figure 31: Europe Protein A Resins Industry Revenue (Million), by Country 2025 & 2033
- Figure 32: Europe Protein A Resins Industry Volume (K Unit), by Country 2025 & 2033
- Figure 33: Europe Protein A Resins Industry Revenue Share (%), by Country 2025 & 2033
- Figure 34: Europe Protein A Resins Industry Volume Share (%), by Country 2025 & 2033
- Figure 35: Asia Pacific Protein A Resins Industry Revenue (Million), by Product 2025 & 2033
- Figure 36: Asia Pacific Protein A Resins Industry Volume (K Unit), by Product 2025 & 2033
- Figure 37: Asia Pacific Protein A Resins Industry Revenue Share (%), by Product 2025 & 2033
- Figure 38: Asia Pacific Protein A Resins Industry Volume Share (%), by Product 2025 & 2033
- Figure 39: Asia Pacific Protein A Resins Industry Revenue (Million), by Application 2025 & 2033
- Figure 40: Asia Pacific Protein A Resins Industry Volume (K Unit), by Application 2025 & 2033
- Figure 41: Asia Pacific Protein A Resins Industry Revenue Share (%), by Application 2025 & 2033
- Figure 42: Asia Pacific Protein A Resins Industry Volume Share (%), by Application 2025 & 2033
- Figure 43: Asia Pacific Protein A Resins Industry Revenue (Million), by End User 2025 & 2033
- Figure 44: Asia Pacific Protein A Resins Industry Volume (K Unit), by End User 2025 & 2033
- Figure 45: Asia Pacific Protein A Resins Industry Revenue Share (%), by End User 2025 & 2033
- Figure 46: Asia Pacific Protein A Resins Industry Volume Share (%), by End User 2025 & 2033
- Figure 47: Asia Pacific Protein A Resins Industry Revenue (Million), by Country 2025 & 2033
- Figure 48: Asia Pacific Protein A Resins Industry Volume (K Unit), by Country 2025 & 2033
- Figure 49: Asia Pacific Protein A Resins Industry Revenue Share (%), by Country 2025 & 2033
- Figure 50: Asia Pacific Protein A Resins Industry Volume Share (%), by Country 2025 & 2033
- Figure 51: Middle East and Africa Protein A Resins Industry Revenue (Million), by Product 2025 & 2033
- Figure 52: Middle East and Africa Protein A Resins Industry Volume (K Unit), by Product 2025 & 2033
- Figure 53: Middle East and Africa Protein A Resins Industry Revenue Share (%), by Product 2025 & 2033
- Figure 54: Middle East and Africa Protein A Resins Industry Volume Share (%), by Product 2025 & 2033
- Figure 55: Middle East and Africa Protein A Resins Industry Revenue (Million), by Application 2025 & 2033
- Figure 56: Middle East and Africa Protein A Resins Industry Volume (K Unit), by Application 2025 & 2033
- Figure 57: Middle East and Africa Protein A Resins Industry Revenue Share (%), by Application 2025 & 2033
- Figure 58: Middle East and Africa Protein A Resins Industry Volume Share (%), by Application 2025 & 2033
- Figure 59: Middle East and Africa Protein A Resins Industry Revenue (Million), by End User 2025 & 2033
- Figure 60: Middle East and Africa Protein A Resins Industry Volume (K Unit), by End User 2025 & 2033
- Figure 61: Middle East and Africa Protein A Resins Industry Revenue Share (%), by End User 2025 & 2033
- Figure 62: Middle East and Africa Protein A Resins Industry Volume Share (%), by End User 2025 & 2033
- Figure 63: Middle East and Africa Protein A Resins Industry Revenue (Million), by Country 2025 & 2033
- Figure 64: Middle East and Africa Protein A Resins Industry Volume (K Unit), by Country 2025 & 2033
- Figure 65: Middle East and Africa Protein A Resins Industry Revenue Share (%), by Country 2025 & 2033
- Figure 66: Middle East and Africa Protein A Resins Industry Volume Share (%), by Country 2025 & 2033
- Figure 67: South America Protein A Resins Industry Revenue (Million), by Product 2025 & 2033
- Figure 68: South America Protein A Resins Industry Volume (K Unit), by Product 2025 & 2033
- Figure 69: South America Protein A Resins Industry Revenue Share (%), by Product 2025 & 2033
- Figure 70: South America Protein A Resins Industry Volume Share (%), by Product 2025 & 2033
- Figure 71: South America Protein A Resins Industry Revenue (Million), by Application 2025 & 2033
- Figure 72: South America Protein A Resins Industry Volume (K Unit), by Application 2025 & 2033
- Figure 73: South America Protein A Resins Industry Revenue Share (%), by Application 2025 & 2033
- Figure 74: South America Protein A Resins Industry Volume Share (%), by Application 2025 & 2033
- Figure 75: South America Protein A Resins Industry Revenue (Million), by End User 2025 & 2033
- Figure 76: South America Protein A Resins Industry Volume (K Unit), by End User 2025 & 2033
- Figure 77: South America Protein A Resins Industry Revenue Share (%), by End User 2025 & 2033
- Figure 78: South America Protein A Resins Industry Volume Share (%), by End User 2025 & 2033
- Figure 79: South America Protein A Resins Industry Revenue (Million), by Country 2025 & 2033
- Figure 80: South America Protein A Resins Industry Volume (K Unit), by Country 2025 & 2033
- Figure 81: South America Protein A Resins Industry Revenue Share (%), by Country 2025 & 2033
- Figure 82: South America Protein A Resins Industry Volume Share (%), by Country 2025 & 2033
List of Tables
- Table 1: Global Protein A Resins Industry Revenue Million Forecast, by Product 2020 & 2033
- Table 2: Global Protein A Resins Industry Volume K Unit Forecast, by Product 2020 & 2033
- Table 3: Global Protein A Resins Industry Revenue Million Forecast, by Application 2020 & 2033
- Table 4: Global Protein A Resins Industry Volume K Unit Forecast, by Application 2020 & 2033
- Table 5: Global Protein A Resins Industry Revenue Million Forecast, by End User 2020 & 2033
- Table 6: Global Protein A Resins Industry Volume K Unit Forecast, by End User 2020 & 2033
- Table 7: Global Protein A Resins Industry Revenue Million Forecast, by Region 2020 & 2033
- Table 8: Global Protein A Resins Industry Volume K Unit Forecast, by Region 2020 & 2033
- Table 9: Global Protein A Resins Industry Revenue Million Forecast, by Product 2020 & 2033
- Table 10: Global Protein A Resins Industry Volume K Unit Forecast, by Product 2020 & 2033
- Table 11: Global Protein A Resins Industry Revenue Million Forecast, by Application 2020 & 2033
- Table 12: Global Protein A Resins Industry Volume K Unit Forecast, by Application 2020 & 2033
- Table 13: Global Protein A Resins Industry Revenue Million Forecast, by End User 2020 & 2033
- Table 14: Global Protein A Resins Industry Volume K Unit Forecast, by End User 2020 & 2033
- Table 15: Global Protein A Resins Industry Revenue Million Forecast, by Country 2020 & 2033
- Table 16: Global Protein A Resins Industry Volume K Unit Forecast, by Country 2020 & 2033
- Table 17: United States Protein A Resins Industry Revenue (Million) Forecast, by Application 2020 & 2033
- Table 18: United States Protein A Resins Industry Volume (K Unit) Forecast, by Application 2020 & 2033
- Table 19: Canada Protein A Resins Industry Revenue (Million) Forecast, by Application 2020 & 2033
- Table 20: Canada Protein A Resins Industry Volume (K Unit) Forecast, by Application 2020 & 2033
- Table 21: Mexico Protein A Resins Industry Revenue (Million) Forecast, by Application 2020 & 2033
- Table 22: Mexico Protein A Resins Industry Volume (K Unit) Forecast, by Application 2020 & 2033
- Table 23: Global Protein A Resins Industry Revenue Million Forecast, by Product 2020 & 2033
- Table 24: Global Protein A Resins Industry Volume K Unit Forecast, by Product 2020 & 2033
- Table 25: Global Protein A Resins Industry Revenue Million Forecast, by Application 2020 & 2033
- Table 26: Global Protein A Resins Industry Volume K Unit Forecast, by Application 2020 & 2033
- Table 27: Global Protein A Resins Industry Revenue Million Forecast, by End User 2020 & 2033
- Table 28: Global Protein A Resins Industry Volume K Unit Forecast, by End User 2020 & 2033
- Table 29: Global Protein A Resins Industry Revenue Million Forecast, by Country 2020 & 2033
- Table 30: Global Protein A Resins Industry Volume K Unit Forecast, by Country 2020 & 2033
- Table 31: Germany Protein A Resins Industry Revenue (Million) Forecast, by Application 2020 & 2033
- Table 32: Germany Protein A Resins Industry Volume (K Unit) Forecast, by Application 2020 & 2033
- Table 33: United Kingdom Protein A Resins Industry Revenue (Million) Forecast, by Application 2020 & 2033
- Table 34: United Kingdom Protein A Resins Industry Volume (K Unit) Forecast, by Application 2020 & 2033
- Table 35: France Protein A Resins Industry Revenue (Million) Forecast, by Application 2020 & 2033
- Table 36: France Protein A Resins Industry Volume (K Unit) Forecast, by Application 2020 & 2033
- Table 37: Italy Protein A Resins Industry Revenue (Million) Forecast, by Application 2020 & 2033
- Table 38: Italy Protein A Resins Industry Volume (K Unit) Forecast, by Application 2020 & 2033
- Table 39: Spain Protein A Resins Industry Revenue (Million) Forecast, by Application 2020 & 2033
- Table 40: Spain Protein A Resins Industry Volume (K Unit) Forecast, by Application 2020 & 2033
- Table 41: Rest of Europe Protein A Resins Industry Revenue (Million) Forecast, by Application 2020 & 2033
- Table 42: Rest of Europe Protein A Resins Industry Volume (K Unit) Forecast, by Application 2020 & 2033
- Table 43: Global Protein A Resins Industry Revenue Million Forecast, by Product 2020 & 2033
- Table 44: Global Protein A Resins Industry Volume K Unit Forecast, by Product 2020 & 2033
- Table 45: Global Protein A Resins Industry Revenue Million Forecast, by Application 2020 & 2033
- Table 46: Global Protein A Resins Industry Volume K Unit Forecast, by Application 2020 & 2033
- Table 47: Global Protein A Resins Industry Revenue Million Forecast, by End User 2020 & 2033
- Table 48: Global Protein A Resins Industry Volume K Unit Forecast, by End User 2020 & 2033
- Table 49: Global Protein A Resins Industry Revenue Million Forecast, by Country 2020 & 2033
- Table 50: Global Protein A Resins Industry Volume K Unit Forecast, by Country 2020 & 2033
- Table 51: China Protein A Resins Industry Revenue (Million) Forecast, by Application 2020 & 2033
- Table 52: China Protein A Resins Industry Volume (K Unit) Forecast, by Application 2020 & 2033
- Table 53: Japan Protein A Resins Industry Revenue (Million) Forecast, by Application 2020 & 2033
- Table 54: Japan Protein A Resins Industry Volume (K Unit) Forecast, by Application 2020 & 2033
- Table 55: India Protein A Resins Industry Revenue (Million) Forecast, by Application 2020 & 2033
- Table 56: India Protein A Resins Industry Volume (K Unit) Forecast, by Application 2020 & 2033
- Table 57: Australia Protein A Resins Industry Revenue (Million) Forecast, by Application 2020 & 2033
- Table 58: Australia Protein A Resins Industry Volume (K Unit) Forecast, by Application 2020 & 2033
- Table 59: South Korea Protein A Resins Industry Revenue (Million) Forecast, by Application 2020 & 2033
- Table 60: South Korea Protein A Resins Industry Volume (K Unit) Forecast, by Application 2020 & 2033
- Table 61: Rest of Asia Pacific Protein A Resins Industry Revenue (Million) Forecast, by Application 2020 & 2033
- Table 62: Rest of Asia Pacific Protein A Resins Industry Volume (K Unit) Forecast, by Application 2020 & 2033
- Table 63: Global Protein A Resins Industry Revenue Million Forecast, by Product 2020 & 2033
- Table 64: Global Protein A Resins Industry Volume K Unit Forecast, by Product 2020 & 2033
- Table 65: Global Protein A Resins Industry Revenue Million Forecast, by Application 2020 & 2033
- Table 66: Global Protein A Resins Industry Volume K Unit Forecast, by Application 2020 & 2033
- Table 67: Global Protein A Resins Industry Revenue Million Forecast, by End User 2020 & 2033
- Table 68: Global Protein A Resins Industry Volume K Unit Forecast, by End User 2020 & 2033
- Table 69: Global Protein A Resins Industry Revenue Million Forecast, by Country 2020 & 2033
- Table 70: Global Protein A Resins Industry Volume K Unit Forecast, by Country 2020 & 2033
- Table 71: GCC Protein A Resins Industry Revenue (Million) Forecast, by Application 2020 & 2033
- Table 72: GCC Protein A Resins Industry Volume (K Unit) Forecast, by Application 2020 & 2033
- Table 73: South Africa Protein A Resins Industry Revenue (Million) Forecast, by Application 2020 & 2033
- Table 74: South Africa Protein A Resins Industry Volume (K Unit) Forecast, by Application 2020 & 2033
- Table 75: Rest of Middle East and Africa Protein A Resins Industry Revenue (Million) Forecast, by Application 2020 & 2033
- Table 76: Rest of Middle East and Africa Protein A Resins Industry Volume (K Unit) Forecast, by Application 2020 & 2033
- Table 77: Global Protein A Resins Industry Revenue Million Forecast, by Product 2020 & 2033
- Table 78: Global Protein A Resins Industry Volume K Unit Forecast, by Product 2020 & 2033
- Table 79: Global Protein A Resins Industry Revenue Million Forecast, by Application 2020 & 2033
- Table 80: Global Protein A Resins Industry Volume K Unit Forecast, by Application 2020 & 2033
- Table 81: Global Protein A Resins Industry Revenue Million Forecast, by End User 2020 & 2033
- Table 82: Global Protein A Resins Industry Volume K Unit Forecast, by End User 2020 & 2033
- Table 83: Global Protein A Resins Industry Revenue Million Forecast, by Country 2020 & 2033
- Table 84: Global Protein A Resins Industry Volume K Unit Forecast, by Country 2020 & 2033
- Table 85: Brazil Protein A Resins Industry Revenue (Million) Forecast, by Application 2020 & 2033
- Table 86: Brazil Protein A Resins Industry Volume (K Unit) Forecast, by Application 2020 & 2033
- Table 87: Argentina Protein A Resins Industry Revenue (Million) Forecast, by Application 2020 & 2033
- Table 88: Argentina Protein A Resins Industry Volume (K Unit) Forecast, by Application 2020 & 2033
- Table 89: Rest of South America Protein A Resins Industry Revenue (Million) Forecast, by Application 2020 & 2033
- Table 90: Rest of South America Protein A Resins Industry Volume (K Unit) Forecast, by Application 2020 & 2033
Frequently Asked Questions
1. What is the projected Compound Annual Growth Rate (CAGR) of the Protein A Resins Industry?
The projected CAGR is approximately 8.69%.
2. Which companies are prominent players in the Protein A Resins Industry?
Key companies in the market include Abcam Limited, Repligen Corporation, Bio-Rad Laboratories Inc, Merck KGaA, JSR Life Sciences, Kaneka Corporation, Genscript Corporation, Tosoh Bioscience LLC, Danaher Corporation (Cytiva), Axplora, Thermofisher Scientific Inc, Agarose Beads Technologies, Ecolab Inc (Purolite Lifesciences).
3. What are the main segments of the Protein A Resins Industry?
The market segments include Product, Application, End User.
4. Can you provide details about the market size?
The market size is estimated to be USD 1.17 Million as of 2022.
5. What are some drivers contributing to market growth?
Increasing Demand for Antibodies; Increasing Number of Drug Discoveries and R&D Activities.
6. What are the notable trends driving market growth?
Pharmaceutical and Biopharmaceutical Companies are Expected to Dominate the End User Segment.
7. Are there any restraints impacting market growth?
High Cost Associated With Protein A Resin.
8. Can you provide examples of recent developments in the market?
February 2024: Purolite, an Ecolab company, and Repligen Corporation reported the commercial launch of Praesto CH1, a new 70 μm (micron) agarose-based affinity resin designed to purify specialized mAbs such as bispecifics and recombinant antibody fragments.
9. What pricing options are available for accessing the report?
Pricing options include single-user, multi-user, and enterprise licenses priced at USD 4750, USD 5250, and USD 8750 respectively.
10. Is the market size provided in terms of value or volume?
The market size is provided in terms of value, measured in Million and volume, measured in K Unit.
11. Are there any specific market keywords associated with the report?
Yes, the market keyword associated with the report is "Protein A Resins Industry," which aids in identifying and referencing the specific market segment covered.
12. How do I determine which pricing option suits my needs best?
The pricing options vary based on user requirements and access needs. Individual users may opt for single-user licenses, while businesses requiring broader access may choose multi-user or enterprise licenses for cost-effective access to the report.
13. Are there any additional resources or data provided in the Protein A Resins Industry report?
While the report offers comprehensive insights, it's advisable to review the specific contents or supplementary materials provided to ascertain if additional resources or data are available.
14. How can I stay updated on further developments or reports in the Protein A Resins Industry?
To stay informed about further developments, trends, and reports in the Protein A Resins Industry, consider subscribing to industry newsletters, following relevant companies and organizations, or regularly checking reputable industry news sources and publications.
Methodology
Step 1 - Identification of Relevant Samples Size from Population Database


Step 2 - Approaches for Defining Global Market Size (Value, Volume* & Price*)

Note*: In applicable scenarios
Step 3 - Data Sources
Primary Research
- Web Analytics
- Survey Reports
- Research Institute
- Latest Research Reports
- Opinion Leaders
Secondary Research
- Annual Reports
- White Paper
- Latest Press Release
- Industry Association
- Paid Database
- Investor Presentations

Step 4 - Data Triangulation
Involves using different sources of information in order to increase the validity of a study
These sources are likely to be stakeholders in a program - participants, other researchers, program staff, other community members, and so on.
Then we put all data in single framework & apply various statistical tools to find out the dynamic on the market.
During the analysis stage, feedback from the stakeholder groups would be compared to determine areas of agreement as well as areas of divergence