

Key Insights
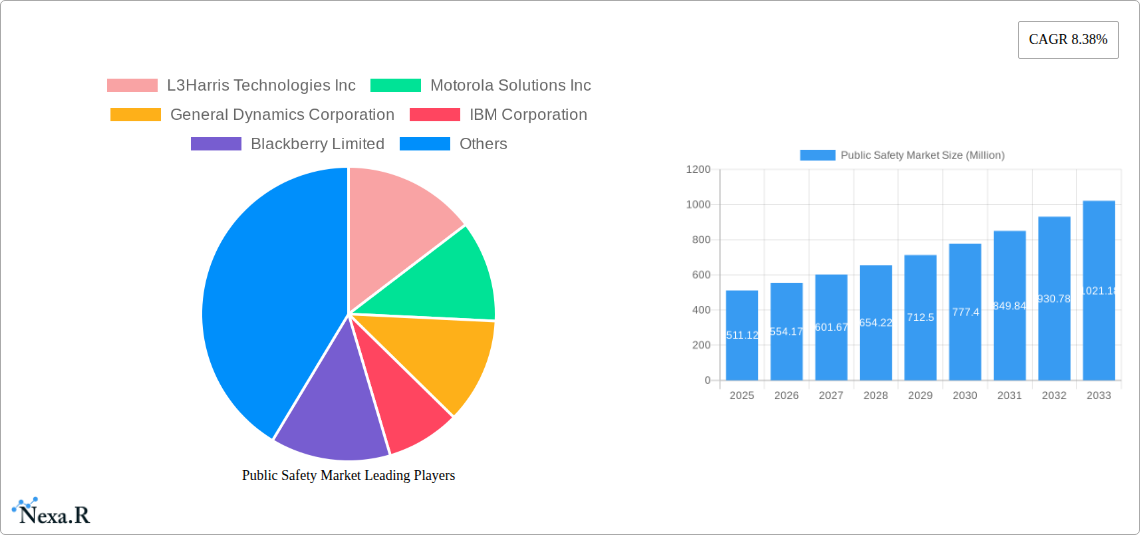
The global Public Safety market is experiencing robust growth, projected to reach $511.12 million in 2025 and exhibiting a Compound Annual Growth Rate (CAGR) of 8.38% from 2025 to 2033. This expansion is fueled by several key drivers. Increased government investments in advanced technologies for improved emergency response and crime prevention are a significant factor. The rising adoption of cloud-based solutions enhances data accessibility and interoperability between agencies, streamlining operations and improving situational awareness. Furthermore, the growing need for real-time data analytics to predict and prevent incidents, coupled with the increasing sophistication of cyber threats, is driving demand for sophisticated public safety solutions. The market segmentation reveals strong growth across various components (solutions and services), deployment types (cloud and on-premise), and end-user verticals. Cloud deployments are expected to dominate due to their scalability and cost-effectiveness. Among end-users, law enforcement, medical, and firefighting sectors are major contributors, with transportation and disaster management witnessing significant growth potential.
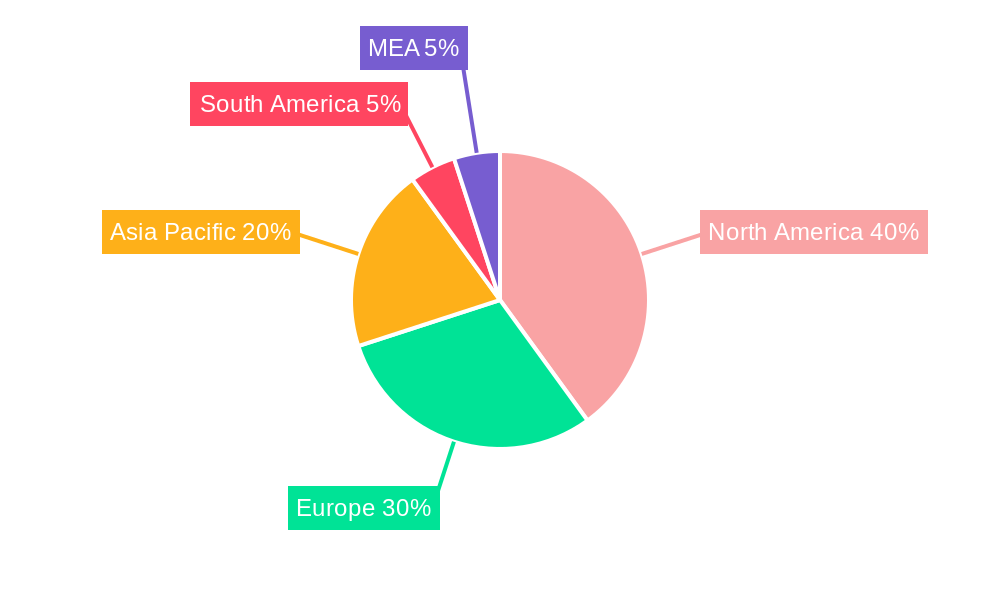
The competitive landscape is marked by a mix of established players and emerging technology providers. Companies like L3Harris Technologies, Motorola Solutions, General Dynamics, IBM, and Blackberry are major players, leveraging their expertise in communication technologies, data analytics, and security solutions. However, the market is also witnessing innovation from smaller companies specializing in niche technologies, fostering competition and driving further advancements. Geographical distribution shows North America currently holds a substantial market share, driven by high technology adoption and robust government funding. However, Asia-Pacific and Europe are poised for significant growth in the coming years, propelled by increasing urbanization, rising crime rates, and growing investments in public safety infrastructure. The continued evolution of technologies like AI, IoT, and big data analytics will further shape the market landscape, creating opportunities for specialized solutions and services catering to specific public safety needs.
Public Safety Market: A Comprehensive Market Report (2019-2033)
This in-depth report provides a comprehensive analysis of the Public Safety Market, encompassing market dynamics, growth trends, regional dominance, product landscape, key players, and future outlook. The study period covers 2019-2033, with 2025 as the base year and a forecast period of 2025-2033. The report segments the market by component (Solutions, Services), deployment type (On-premise, Cloud), and end-user vertical (Law Enforcement, Medical, Firefighting, Transportation, Disaster Management, Other). The total market size is predicted to reach xx Million by 2033.
Public Safety Market Dynamics & Structure
The Public Safety market is characterized by a moderately concentrated landscape with key players such as L3Harris Technologies Inc, Motorola Solutions Inc, and General Dynamics Corporation holding significant market share. Technological innovation, particularly in AI, cloud computing, and data analytics, is a primary growth driver. Stringent regulatory frameworks governing data privacy and security significantly impact market operations. The market witnesses continuous product substitution with newer, more efficient technologies replacing legacy systems. The end-user demographic is diverse, encompassing government agencies, healthcare providers, and private security firms. M&A activity remains a significant aspect of market consolidation, with xx deals recorded between 2019 and 2024.
- Market Concentration: Moderately concentrated, with top 5 players holding approximately xx% market share in 2024.
- Technological Innovation: AI, IoT, cloud computing are key drivers, impacting solutions and services.
- Regulatory Landscape: Strict data privacy and security regulations influence product development and deployment.
- Competitive Substitutes: Constant evolution of technologies leads to frequent product substitution.
- M&A Activity: Significant consolidation through mergers and acquisitions; xx deals recorded from 2019-2024.
- Innovation Barriers: High initial investment costs and integration complexities hinder innovation.
Public Safety Market Growth Trends & Insights
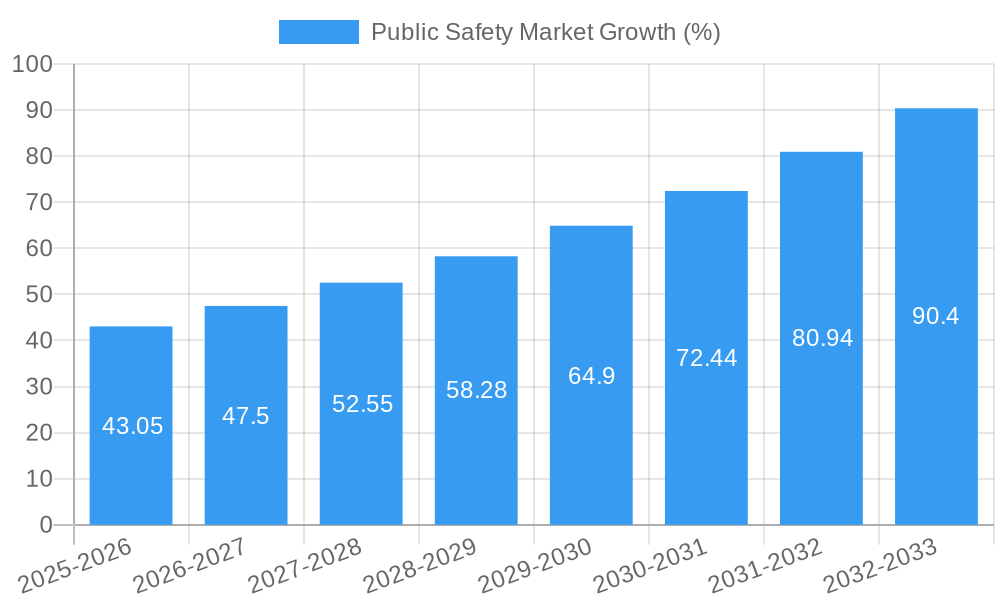
The Public Safety market experienced robust growth during the historical period (2019-2024), with a CAGR of xx%. This growth is fueled by increasing government investments in public safety infrastructure, rising adoption of advanced technologies like AI and cloud solutions, and a growing awareness of the need for enhanced public safety measures. The market is expected to maintain this growth trajectory during the forecast period (2025-2033), with a projected CAGR of xx%, driven by factors such as increasing urbanization, evolving crime patterns, and a greater focus on predictive policing and disaster preparedness. Market penetration of cloud-based solutions is expected to significantly increase, reaching xx% by 2033. Consumer behavior shifts towards greater reliance on digital technologies and enhanced demand for integrated solutions are further shaping market growth.
Dominant Regions, Countries, or Segments in Public Safety Market
North America currently holds the largest market share in the Public Safety market, driven by high government spending on security and advanced technological adoption. Within the segments, the Law Enforcement vertical is dominant, followed by Firefighting and Transportation. Cloud-based deployment is rapidly gaining traction, showcasing a shift towards cost-effective and scalable solutions.
- North America: Dominant region due to high government spending and technological advancements.
- Law Enforcement: Largest end-user vertical, driven by the need for improved crime prevention and investigation tools.
- Cloud Deployment: Fastest-growing deployment type due to its scalability, cost-effectiveness, and flexibility.
- Key Drivers: Increased government funding, technological advancements, evolving crime patterns, urbanization.
Public Safety Market Product Landscape
The Public Safety market showcases a diverse range of products including video management systems, command and control centers, body-worn cameras, and analytical tools. These products are characterized by features like enhanced data analytics, seamless integration capabilities, and improved user interfaces. Technological advancements focus on AI-powered solutions, improved situational awareness, and predictive analytics to enhance public safety response times and effectiveness. Unique selling propositions often revolve around the integration of various solutions, ease of use, and data security capabilities.
Key Drivers, Barriers & Challenges in Public Safety Market
Key Drivers: Increasing government spending on public safety infrastructure, advancements in technologies like AI and cloud computing, and the rising need for enhanced security and crime prevention measures are primary growth drivers. Government initiatives promoting the adoption of advanced technologies are also playing a significant role.
Key Challenges: High initial investment costs for advanced technologies, integration complexities across various systems, and data security concerns represent major barriers. Supply chain disruptions can impact product availability and costs. Regulatory compliance related to data privacy and cybersecurity also poses challenges.
Emerging Opportunities in Public Safety Market
The market presents significant opportunities in areas like predictive policing, drone technology integration, and the development of advanced analytics capabilities. Untapped markets in developing countries offer significant growth potential. Increased focus on cybersecurity solutions and improved data interoperability present further opportunities.
Growth Accelerators in the Public Safety Market Industry
Strategic partnerships between technology providers and public safety agencies, expansion of cloud-based solutions, and investments in research and development for innovative technologies are key growth accelerators. Government initiatives to modernize public safety infrastructure and the adoption of AI-powered solutions will further propel market growth.
Key Players Shaping the Public Safety Market Market
- L3Harris Technologies Inc
- Motorola Solutions Inc
- General Dynamics Corporation
- IBM Corporation
- Blackberry Limited
- CentralSquare Technologies
- Thales Group
- Cisco Systems Inc
- NICE Ltd
- Verint Systems Inc
- Atos SE
- Semtech Corporation
Notable Milestones in Public Safety Market Sector
- April 2024: CentralSquare Technologies announced leveraging AWS for enhanced cloud migration services.
- March 2024: GDIT (General Dynamics) awarded a USD 922 million contract to upgrade CENTCOM IT infrastructure.
- February 2024: Cisco partnered with AI stakeholders to promote secure AI deployment through the AISIC.
In-Depth Public Safety Market Market Outlook
The Public Safety market exhibits strong growth potential, driven by ongoing technological advancements and increased government investment. Strategic partnerships, expansion into untapped markets, and continuous innovation will shape future market dynamics. Opportunities exist in developing AI-powered predictive policing tools, integrating drone technology, and strengthening cybersecurity solutions. The market's long-term outlook remains positive, promising significant growth over the forecast period.
Public Safety Market Segmentation
-
1. Component
- 1.1. Solution
- 1.2. Services
-
2. Deployment Type
- 2.1. On-premise
- 2.2. Cloud
-
3. End-user Vertical
- 3.1. Law Enforcement
- 3.2. Medical
- 3.3. Firefighting
- 3.4. Transportation
- 3.5. Disaster Management
- 3.6. Other End-user Verticals
Public Safety Market Segmentation By Geography
- 1. North America
- 2. Europe
- 3. Asia
- 4. Australia and New Zealand
- 5. Middle East and Africa
- 6. Latin America
Public Safety Market REPORT HIGHLIGHTS
| Aspects | Details |
|---|---|
| Study Period | 2019-2033 |
| Base Year | 2024 |
| Estimated Year | 2025 |
| Forecast Period | 2025-2033 |
| Historical Period | 2019-2024 |
| Growth Rate | CAGR of 8.38% from 2019-2033 |
| Segmentation |
|
Table of Contents
- 1. Introduction
- 1.1. Research Scope
- 1.2. Market Segmentation
- 1.3. Research Methodology
- 1.4. Definitions and Assumptions
- 2. Executive Summary
- 2.1. Introduction
- 3. Market Dynamics
- 3.1. Introduction
- 3.2. Market Drivers
- 3.2.1 Growing Number of Global Catastrophic Accidents
- 3.2.2 Crime Rates
- 3.2.3 and Terrorist Activities; Rising Adoption of Advanced Technologies and Growth in Smart Cities
- 3.3. Market Restrains
- 3.3.1. Lack of Cybersecurity Professionals; High Reliance on Traditional Authentication Methods and Low Preparedness
- 3.4. Market Trends
- 3.4.1. Law Enforcement to be the Largest End-user Vertical
- 4. Market Factor Analysis
- 4.1. Porters Five Forces
- 4.2. Supply/Value Chain
- 4.3. PESTEL analysis
- 4.4. Market Entropy
- 4.5. Patent/Trademark Analysis
- 5. Global Public Safety Market Analysis, Insights and Forecast, 2019-2031
- 5.1. Market Analysis, Insights and Forecast - by Component
- 5.1.1. Solution
- 5.1.2. Services
- 5.2. Market Analysis, Insights and Forecast - by Deployment Type
- 5.2.1. On-premise
- 5.2.2. Cloud
- 5.3. Market Analysis, Insights and Forecast - by End-user Vertical
- 5.3.1. Law Enforcement
- 5.3.2. Medical
- 5.3.3. Firefighting
- 5.3.4. Transportation
- 5.3.5. Disaster Management
- 5.3.6. Other End-user Verticals
- 5.4. Market Analysis, Insights and Forecast - by Region
- 5.4.1. North America
- 5.4.2. Europe
- 5.4.3. Asia
- 5.4.4. Australia and New Zealand
- 5.4.5. Middle East and Africa
- 5.4.6. Latin America
- 5.1. Market Analysis, Insights and Forecast - by Component
- 6. North America Public Safety Market Analysis, Insights and Forecast, 2019-2031
- 6.1. Market Analysis, Insights and Forecast - by Component
- 6.1.1. Solution
- 6.1.2. Services
- 6.2. Market Analysis, Insights and Forecast - by Deployment Type
- 6.2.1. On-premise
- 6.2.2. Cloud
- 6.3. Market Analysis, Insights and Forecast - by End-user Vertical
- 6.3.1. Law Enforcement
- 6.3.2. Medical
- 6.3.3. Firefighting
- 6.3.4. Transportation
- 6.3.5. Disaster Management
- 6.3.6. Other End-user Verticals
- 6.1. Market Analysis, Insights and Forecast - by Component
- 7. Europe Public Safety Market Analysis, Insights and Forecast, 2019-2031
- 7.1. Market Analysis, Insights and Forecast - by Component
- 7.1.1. Solution
- 7.1.2. Services
- 7.2. Market Analysis, Insights and Forecast - by Deployment Type
- 7.2.1. On-premise
- 7.2.2. Cloud
- 7.3. Market Analysis, Insights and Forecast - by End-user Vertical
- 7.3.1. Law Enforcement
- 7.3.2. Medical
- 7.3.3. Firefighting
- 7.3.4. Transportation
- 7.3.5. Disaster Management
- 7.3.6. Other End-user Verticals
- 7.1. Market Analysis, Insights and Forecast - by Component
- 8. Asia Public Safety Market Analysis, Insights and Forecast, 2019-2031
- 8.1. Market Analysis, Insights and Forecast - by Component
- 8.1.1. Solution
- 8.1.2. Services
- 8.2. Market Analysis, Insights and Forecast - by Deployment Type
- 8.2.1. On-premise
- 8.2.2. Cloud
- 8.3. Market Analysis, Insights and Forecast - by End-user Vertical
- 8.3.1. Law Enforcement
- 8.3.2. Medical
- 8.3.3. Firefighting
- 8.3.4. Transportation
- 8.3.5. Disaster Management
- 8.3.6. Other End-user Verticals
- 8.1. Market Analysis, Insights and Forecast - by Component
- 9. Australia and New Zealand Public Safety Market Analysis, Insights and Forecast, 2019-2031
- 9.1. Market Analysis, Insights and Forecast - by Component
- 9.1.1. Solution
- 9.1.2. Services
- 9.2. Market Analysis, Insights and Forecast - by Deployment Type
- 9.2.1. On-premise
- 9.2.2. Cloud
- 9.3. Market Analysis, Insights and Forecast - by End-user Vertical
- 9.3.1. Law Enforcement
- 9.3.2. Medical
- 9.3.3. Firefighting
- 9.3.4. Transportation
- 9.3.5. Disaster Management
- 9.3.6. Other End-user Verticals
- 9.1. Market Analysis, Insights and Forecast - by Component
- 10. Middle East and Africa Public Safety Market Analysis, Insights and Forecast, 2019-2031
- 10.1. Market Analysis, Insights and Forecast - by Component
- 10.1.1. Solution
- 10.1.2. Services
- 10.2. Market Analysis, Insights and Forecast - by Deployment Type
- 10.2.1. On-premise
- 10.2.2. Cloud
- 10.3. Market Analysis, Insights and Forecast - by End-user Vertical
- 10.3.1. Law Enforcement
- 10.3.2. Medical
- 10.3.3. Firefighting
- 10.3.4. Transportation
- 10.3.5. Disaster Management
- 10.3.6. Other End-user Verticals
- 10.1. Market Analysis, Insights and Forecast - by Component
- 11. Latin America Public Safety Market Analysis, Insights and Forecast, 2019-2031
- 11.1. Market Analysis, Insights and Forecast - by Component
- 11.1.1. Solution
- 11.1.2. Services
- 11.2. Market Analysis, Insights and Forecast - by Deployment Type
- 11.2.1. On-premise
- 11.2.2. Cloud
- 11.3. Market Analysis, Insights and Forecast - by End-user Vertical
- 11.3.1. Law Enforcement
- 11.3.2. Medical
- 11.3.3. Firefighting
- 11.3.4. Transportation
- 11.3.5. Disaster Management
- 11.3.6. Other End-user Verticals
- 11.1. Market Analysis, Insights and Forecast - by Component
- 12. North America Public Safety Market Analysis, Insights and Forecast, 2019-2031
- 12.1. Market Analysis, Insights and Forecast - By Country/Sub-region
- 12.1.1 United States
- 12.1.2 Canada
- 12.1.3 Mexico
- 13. Europe Public Safety Market Analysis, Insights and Forecast, 2019-2031
- 13.1. Market Analysis, Insights and Forecast - By Country/Sub-region
- 13.1.1 Germany
- 13.1.2 United Kingdom
- 13.1.3 France
- 13.1.4 Spain
- 13.1.5 Italy
- 13.1.6 Spain
- 13.1.7 Belgium
- 13.1.8 Netherland
- 13.1.9 Nordics
- 13.1.10 Rest of Europe
- 14. Asia Pacific Public Safety Market Analysis, Insights and Forecast, 2019-2031
- 14.1. Market Analysis, Insights and Forecast - By Country/Sub-region
- 14.1.1 China
- 14.1.2 Japan
- 14.1.3 India
- 14.1.4 South Korea
- 14.1.5 Southeast Asia
- 14.1.6 Australia
- 14.1.7 Indonesia
- 14.1.8 Phillipes
- 14.1.9 Singapore
- 14.1.10 Thailandc
- 14.1.11 Rest of Asia Pacific
- 15. South America Public Safety Market Analysis, Insights and Forecast, 2019-2031
- 15.1. Market Analysis, Insights and Forecast - By Country/Sub-region
- 15.1.1 Brazil
- 15.1.2 Argentina
- 15.1.3 Peru
- 15.1.4 Chile
- 15.1.5 Colombia
- 15.1.6 Ecuador
- 15.1.7 Venezuela
- 15.1.8 Rest of South America
- 16. North America Public Safety Market Analysis, Insights and Forecast, 2019-2031
- 16.1. Market Analysis, Insights and Forecast - By Country/Sub-region
- 16.1.1 United States
- 16.1.2 Canada
- 16.1.3 Mexico
- 17. MEA Public Safety Market Analysis, Insights and Forecast, 2019-2031
- 17.1. Market Analysis, Insights and Forecast - By Country/Sub-region
- 17.1.1 United Arab Emirates
- 17.1.2 Saudi Arabia
- 17.1.3 South Africa
- 17.1.4 Rest of Middle East and Africa
- 18. Competitive Analysis
- 18.1. Global Market Share Analysis 2024
- 18.2. Company Profiles
- 18.2.1 L3Harris Technologies Inc
- 18.2.1.1. Overview
- 18.2.1.2. Products
- 18.2.1.3. SWOT Analysis
- 18.2.1.4. Recent Developments
- 18.2.1.5. Financials (Based on Availability)
- 18.2.2 Motorola Solutions Inc
- 18.2.2.1. Overview
- 18.2.2.2. Products
- 18.2.2.3. SWOT Analysis
- 18.2.2.4. Recent Developments
- 18.2.2.5. Financials (Based on Availability)
- 18.2.3 General Dynamics Corporation
- 18.2.3.1. Overview
- 18.2.3.2. Products
- 18.2.3.3. SWOT Analysis
- 18.2.3.4. Recent Developments
- 18.2.3.5. Financials (Based on Availability)
- 18.2.4 IBM Corporation
- 18.2.4.1. Overview
- 18.2.4.2. Products
- 18.2.4.3. SWOT Analysis
- 18.2.4.4. Recent Developments
- 18.2.4.5. Financials (Based on Availability)
- 18.2.5 Blackberry Limited
- 18.2.5.1. Overview
- 18.2.5.2. Products
- 18.2.5.3. SWOT Analysis
- 18.2.5.4. Recent Developments
- 18.2.5.5. Financials (Based on Availability)
- 18.2.6 CentralSquare Technologies
- 18.2.6.1. Overview
- 18.2.6.2. Products
- 18.2.6.3. SWOT Analysis
- 18.2.6.4. Recent Developments
- 18.2.6.5. Financials (Based on Availability)
- 18.2.7 Thales Group
- 18.2.7.1. Overview
- 18.2.7.2. Products
- 18.2.7.3. SWOT Analysis
- 18.2.7.4. Recent Developments
- 18.2.7.5. Financials (Based on Availability)
- 18.2.8 Cisco Systems Inc
- 18.2.8.1. Overview
- 18.2.8.2. Products
- 18.2.8.3. SWOT Analysis
- 18.2.8.4. Recent Developments
- 18.2.8.5. Financials (Based on Availability)
- 18.2.9 NICE Ltd
- 18.2.9.1. Overview
- 18.2.9.2. Products
- 18.2.9.3. SWOT Analysis
- 18.2.9.4. Recent Developments
- 18.2.9.5. Financials (Based on Availability)
- 18.2.10 Verint Systems Inc
- 18.2.10.1. Overview
- 18.2.10.2. Products
- 18.2.10.3. SWOT Analysis
- 18.2.10.4. Recent Developments
- 18.2.10.5. Financials (Based on Availability)
- 18.2.11 Atos SE
- 18.2.11.1. Overview
- 18.2.11.2. Products
- 18.2.11.3. SWOT Analysis
- 18.2.11.4. Recent Developments
- 18.2.11.5. Financials (Based on Availability)
- 18.2.12 Semtech Corporatio
- 18.2.12.1. Overview
- 18.2.12.2. Products
- 18.2.12.3. SWOT Analysis
- 18.2.12.4. Recent Developments
- 18.2.12.5. Financials (Based on Availability)
- 18.2.1 L3Harris Technologies Inc
List of Figures
- Figure 1: Global Public Safety Market Revenue Breakdown (Million, %) by Region 2024 & 2032
- Figure 2: North America Public Safety Market Revenue (Million), by Country 2024 & 2032
- Figure 3: North America Public Safety Market Revenue Share (%), by Country 2024 & 2032
- Figure 4: Europe Public Safety Market Revenue (Million), by Country 2024 & 2032
- Figure 5: Europe Public Safety Market Revenue Share (%), by Country 2024 & 2032
- Figure 6: Asia Pacific Public Safety Market Revenue (Million), by Country 2024 & 2032
- Figure 7: Asia Pacific Public Safety Market Revenue Share (%), by Country 2024 & 2032
- Figure 8: South America Public Safety Market Revenue (Million), by Country 2024 & 2032
- Figure 9: South America Public Safety Market Revenue Share (%), by Country 2024 & 2032
- Figure 10: North America Public Safety Market Revenue (Million), by Country 2024 & 2032
- Figure 11: North America Public Safety Market Revenue Share (%), by Country 2024 & 2032
- Figure 12: MEA Public Safety Market Revenue (Million), by Country 2024 & 2032
- Figure 13: MEA Public Safety Market Revenue Share (%), by Country 2024 & 2032
- Figure 14: North America Public Safety Market Revenue (Million), by Component 2024 & 2032
- Figure 15: North America Public Safety Market Revenue Share (%), by Component 2024 & 2032
- Figure 16: North America Public Safety Market Revenue (Million), by Deployment Type 2024 & 2032
- Figure 17: North America Public Safety Market Revenue Share (%), by Deployment Type 2024 & 2032
- Figure 18: North America Public Safety Market Revenue (Million), by End-user Vertical 2024 & 2032
- Figure 19: North America Public Safety Market Revenue Share (%), by End-user Vertical 2024 & 2032
- Figure 20: North America Public Safety Market Revenue (Million), by Country 2024 & 2032
- Figure 21: North America Public Safety Market Revenue Share (%), by Country 2024 & 2032
- Figure 22: Europe Public Safety Market Revenue (Million), by Component 2024 & 2032
- Figure 23: Europe Public Safety Market Revenue Share (%), by Component 2024 & 2032
- Figure 24: Europe Public Safety Market Revenue (Million), by Deployment Type 2024 & 2032
- Figure 25: Europe Public Safety Market Revenue Share (%), by Deployment Type 2024 & 2032
- Figure 26: Europe Public Safety Market Revenue (Million), by End-user Vertical 2024 & 2032
- Figure 27: Europe Public Safety Market Revenue Share (%), by End-user Vertical 2024 & 2032
- Figure 28: Europe Public Safety Market Revenue (Million), by Country 2024 & 2032
- Figure 29: Europe Public Safety Market Revenue Share (%), by Country 2024 & 2032
- Figure 30: Asia Public Safety Market Revenue (Million), by Component 2024 & 2032
- Figure 31: Asia Public Safety Market Revenue Share (%), by Component 2024 & 2032
- Figure 32: Asia Public Safety Market Revenue (Million), by Deployment Type 2024 & 2032
- Figure 33: Asia Public Safety Market Revenue Share (%), by Deployment Type 2024 & 2032
- Figure 34: Asia Public Safety Market Revenue (Million), by End-user Vertical 2024 & 2032
- Figure 35: Asia Public Safety Market Revenue Share (%), by End-user Vertical 2024 & 2032
- Figure 36: Asia Public Safety Market Revenue (Million), by Country 2024 & 2032
- Figure 37: Asia Public Safety Market Revenue Share (%), by Country 2024 & 2032
- Figure 38: Australia and New Zealand Public Safety Market Revenue (Million), by Component 2024 & 2032
- Figure 39: Australia and New Zealand Public Safety Market Revenue Share (%), by Component 2024 & 2032
- Figure 40: Australia and New Zealand Public Safety Market Revenue (Million), by Deployment Type 2024 & 2032
- Figure 41: Australia and New Zealand Public Safety Market Revenue Share (%), by Deployment Type 2024 & 2032
- Figure 42: Australia and New Zealand Public Safety Market Revenue (Million), by End-user Vertical 2024 & 2032
- Figure 43: Australia and New Zealand Public Safety Market Revenue Share (%), by End-user Vertical 2024 & 2032
- Figure 44: Australia and New Zealand Public Safety Market Revenue (Million), by Country 2024 & 2032
- Figure 45: Australia and New Zealand Public Safety Market Revenue Share (%), by Country 2024 & 2032
- Figure 46: Middle East and Africa Public Safety Market Revenue (Million), by Component 2024 & 2032
- Figure 47: Middle East and Africa Public Safety Market Revenue Share (%), by Component 2024 & 2032
- Figure 48: Middle East and Africa Public Safety Market Revenue (Million), by Deployment Type 2024 & 2032
- Figure 49: Middle East and Africa Public Safety Market Revenue Share (%), by Deployment Type 2024 & 2032
- Figure 50: Middle East and Africa Public Safety Market Revenue (Million), by End-user Vertical 2024 & 2032
- Figure 51: Middle East and Africa Public Safety Market Revenue Share (%), by End-user Vertical 2024 & 2032
- Figure 52: Middle East and Africa Public Safety Market Revenue (Million), by Country 2024 & 2032
- Figure 53: Middle East and Africa Public Safety Market Revenue Share (%), by Country 2024 & 2032
- Figure 54: Latin America Public Safety Market Revenue (Million), by Component 2024 & 2032
- Figure 55: Latin America Public Safety Market Revenue Share (%), by Component 2024 & 2032
- Figure 56: Latin America Public Safety Market Revenue (Million), by Deployment Type 2024 & 2032
- Figure 57: Latin America Public Safety Market Revenue Share (%), by Deployment Type 2024 & 2032
- Figure 58: Latin America Public Safety Market Revenue (Million), by End-user Vertical 2024 & 2032
- Figure 59: Latin America Public Safety Market Revenue Share (%), by End-user Vertical 2024 & 2032
- Figure 60: Latin America Public Safety Market Revenue (Million), by Country 2024 & 2032
- Figure 61: Latin America Public Safety Market Revenue Share (%), by Country 2024 & 2032
List of Tables
- Table 1: Global Public Safety Market Revenue Million Forecast, by Region 2019 & 2032
- Table 2: Global Public Safety Market Revenue Million Forecast, by Component 2019 & 2032
- Table 3: Global Public Safety Market Revenue Million Forecast, by Deployment Type 2019 & 2032
- Table 4: Global Public Safety Market Revenue Million Forecast, by End-user Vertical 2019 & 2032
- Table 5: Global Public Safety Market Revenue Million Forecast, by Region 2019 & 2032
- Table 6: Global Public Safety Market Revenue Million Forecast, by Country 2019 & 2032
- Table 7: United States Public Safety Market Revenue (Million) Forecast, by Application 2019 & 2032
- Table 8: Canada Public Safety Market Revenue (Million) Forecast, by Application 2019 & 2032
- Table 9: Mexico Public Safety Market Revenue (Million) Forecast, by Application 2019 & 2032
- Table 10: Global Public Safety Market Revenue Million Forecast, by Country 2019 & 2032
- Table 11: Germany Public Safety Market Revenue (Million) Forecast, by Application 2019 & 2032
- Table 12: United Kingdom Public Safety Market Revenue (Million) Forecast, by Application 2019 & 2032
- Table 13: France Public Safety Market Revenue (Million) Forecast, by Application 2019 & 2032
- Table 14: Spain Public Safety Market Revenue (Million) Forecast, by Application 2019 & 2032
- Table 15: Italy Public Safety Market Revenue (Million) Forecast, by Application 2019 & 2032
- Table 16: Spain Public Safety Market Revenue (Million) Forecast, by Application 2019 & 2032
- Table 17: Belgium Public Safety Market Revenue (Million) Forecast, by Application 2019 & 2032
- Table 18: Netherland Public Safety Market Revenue (Million) Forecast, by Application 2019 & 2032
- Table 19: Nordics Public Safety Market Revenue (Million) Forecast, by Application 2019 & 2032
- Table 20: Rest of Europe Public Safety Market Revenue (Million) Forecast, by Application 2019 & 2032
- Table 21: Global Public Safety Market Revenue Million Forecast, by Country 2019 & 2032
- Table 22: China Public Safety Market Revenue (Million) Forecast, by Application 2019 & 2032
- Table 23: Japan Public Safety Market Revenue (Million) Forecast, by Application 2019 & 2032
- Table 24: India Public Safety Market Revenue (Million) Forecast, by Application 2019 & 2032
- Table 25: South Korea Public Safety Market Revenue (Million) Forecast, by Application 2019 & 2032
- Table 26: Southeast Asia Public Safety Market Revenue (Million) Forecast, by Application 2019 & 2032
- Table 27: Australia Public Safety Market Revenue (Million) Forecast, by Application 2019 & 2032
- Table 28: Indonesia Public Safety Market Revenue (Million) Forecast, by Application 2019 & 2032
- Table 29: Phillipes Public Safety Market Revenue (Million) Forecast, by Application 2019 & 2032
- Table 30: Singapore Public Safety Market Revenue (Million) Forecast, by Application 2019 & 2032
- Table 31: Thailandc Public Safety Market Revenue (Million) Forecast, by Application 2019 & 2032
- Table 32: Rest of Asia Pacific Public Safety Market Revenue (Million) Forecast, by Application 2019 & 2032
- Table 33: Global Public Safety Market Revenue Million Forecast, by Country 2019 & 2032
- Table 34: Brazil Public Safety Market Revenue (Million) Forecast, by Application 2019 & 2032
- Table 35: Argentina Public Safety Market Revenue (Million) Forecast, by Application 2019 & 2032
- Table 36: Peru Public Safety Market Revenue (Million) Forecast, by Application 2019 & 2032
- Table 37: Chile Public Safety Market Revenue (Million) Forecast, by Application 2019 & 2032
- Table 38: Colombia Public Safety Market Revenue (Million) Forecast, by Application 2019 & 2032
- Table 39: Ecuador Public Safety Market Revenue (Million) Forecast, by Application 2019 & 2032
- Table 40: Venezuela Public Safety Market Revenue (Million) Forecast, by Application 2019 & 2032
- Table 41: Rest of South America Public Safety Market Revenue (Million) Forecast, by Application 2019 & 2032
- Table 42: Global Public Safety Market Revenue Million Forecast, by Country 2019 & 2032
- Table 43: United States Public Safety Market Revenue (Million) Forecast, by Application 2019 & 2032
- Table 44: Canada Public Safety Market Revenue (Million) Forecast, by Application 2019 & 2032
- Table 45: Mexico Public Safety Market Revenue (Million) Forecast, by Application 2019 & 2032
- Table 46: Global Public Safety Market Revenue Million Forecast, by Country 2019 & 2032
- Table 47: United Arab Emirates Public Safety Market Revenue (Million) Forecast, by Application 2019 & 2032
- Table 48: Saudi Arabia Public Safety Market Revenue (Million) Forecast, by Application 2019 & 2032
- Table 49: South Africa Public Safety Market Revenue (Million) Forecast, by Application 2019 & 2032
- Table 50: Rest of Middle East and Africa Public Safety Market Revenue (Million) Forecast, by Application 2019 & 2032
- Table 51: Global Public Safety Market Revenue Million Forecast, by Component 2019 & 2032
- Table 52: Global Public Safety Market Revenue Million Forecast, by Deployment Type 2019 & 2032
- Table 53: Global Public Safety Market Revenue Million Forecast, by End-user Vertical 2019 & 2032
- Table 54: Global Public Safety Market Revenue Million Forecast, by Country 2019 & 2032
- Table 55: Global Public Safety Market Revenue Million Forecast, by Component 2019 & 2032
- Table 56: Global Public Safety Market Revenue Million Forecast, by Deployment Type 2019 & 2032
- Table 57: Global Public Safety Market Revenue Million Forecast, by End-user Vertical 2019 & 2032
- Table 58: Global Public Safety Market Revenue Million Forecast, by Country 2019 & 2032
- Table 59: Global Public Safety Market Revenue Million Forecast, by Component 2019 & 2032
- Table 60: Global Public Safety Market Revenue Million Forecast, by Deployment Type 2019 & 2032
- Table 61: Global Public Safety Market Revenue Million Forecast, by End-user Vertical 2019 & 2032
- Table 62: Global Public Safety Market Revenue Million Forecast, by Country 2019 & 2032
- Table 63: Global Public Safety Market Revenue Million Forecast, by Component 2019 & 2032
- Table 64: Global Public Safety Market Revenue Million Forecast, by Deployment Type 2019 & 2032
- Table 65: Global Public Safety Market Revenue Million Forecast, by End-user Vertical 2019 & 2032
- Table 66: Global Public Safety Market Revenue Million Forecast, by Country 2019 & 2032
- Table 67: Global Public Safety Market Revenue Million Forecast, by Component 2019 & 2032
- Table 68: Global Public Safety Market Revenue Million Forecast, by Deployment Type 2019 & 2032
- Table 69: Global Public Safety Market Revenue Million Forecast, by End-user Vertical 2019 & 2032
- Table 70: Global Public Safety Market Revenue Million Forecast, by Country 2019 & 2032
- Table 71: Global Public Safety Market Revenue Million Forecast, by Component 2019 & 2032
- Table 72: Global Public Safety Market Revenue Million Forecast, by Deployment Type 2019 & 2032
- Table 73: Global Public Safety Market Revenue Million Forecast, by End-user Vertical 2019 & 2032
- Table 74: Global Public Safety Market Revenue Million Forecast, by Country 2019 & 2032
Frequently Asked Questions
1. What is the projected Compound Annual Growth Rate (CAGR) of the Public Safety Market?
The projected CAGR is approximately 8.38%.
2. Which companies are prominent players in the Public Safety Market?
Key companies in the market include L3Harris Technologies Inc, Motorola Solutions Inc, General Dynamics Corporation, IBM Corporation, Blackberry Limited, CentralSquare Technologies, Thales Group, Cisco Systems Inc, NICE Ltd, Verint Systems Inc, Atos SE, Semtech Corporatio.
3. What are the main segments of the Public Safety Market?
The market segments include Component, Deployment Type, End-user Vertical.
4. Can you provide details about the market size?
The market size is estimated to be USD 511.12 Million as of 2022.
5. What are some drivers contributing to market growth?
Growing Number of Global Catastrophic Accidents. Crime Rates. and Terrorist Activities; Rising Adoption of Advanced Technologies and Growth in Smart Cities.
6. What are the notable trends driving market growth?
Law Enforcement to be the Largest End-user Vertical.
7. Are there any restraints impacting market growth?
Lack of Cybersecurity Professionals; High Reliance on Traditional Authentication Methods and Low Preparedness.
8. Can you provide examples of recent developments in the market?
April 2024 - CentralSquare Technologies announced it would leverage Amazon Web Services (AWS) to deliver enhanced cloud migration guidance and services through CentralSquare’s end-to-end public safety portfolio. By deploying CentralSquare on AWS, responders and officers spend less time reporting back, streamlining processes, engaging with the community, and building more robust, trusting connections with citizens.
9. What pricing options are available for accessing the report?
Pricing options include single-user, multi-user, and enterprise licenses priced at USD 4750, USD 5250, and USD 8750 respectively.
10. Is the market size provided in terms of value or volume?
The market size is provided in terms of value, measured in Million.
11. Are there any specific market keywords associated with the report?
Yes, the market keyword associated with the report is "Public Safety Market," which aids in identifying and referencing the specific market segment covered.
12. How do I determine which pricing option suits my needs best?
The pricing options vary based on user requirements and access needs. Individual users may opt for single-user licenses, while businesses requiring broader access may choose multi-user or enterprise licenses for cost-effective access to the report.
13. Are there any additional resources or data provided in the Public Safety Market report?
While the report offers comprehensive insights, it's advisable to review the specific contents or supplementary materials provided to ascertain if additional resources or data are available.
14. How can I stay updated on further developments or reports in the Public Safety Market?
To stay informed about further developments, trends, and reports in the Public Safety Market, consider subscribing to industry newsletters, following relevant companies and organizations, or regularly checking reputable industry news sources and publications.
Methodology
Step 1 - Identification of Relevant Samples Size from Population Database


Step 2 - Approaches for Defining Global Market Size (Value, Volume* & Price*)

Note*: In applicable scenarios
Step 3 - Data Sources
Primary Research
- Web Analytics
- Survey Reports
- Research Institute
- Latest Research Reports
- Opinion Leaders
Secondary Research
- Annual Reports
- White Paper
- Latest Press Release
- Industry Association
- Paid Database
- Investor Presentations

Step 4 - Data Triangulation
Involves using different sources of information in order to increase the validity of a study
These sources are likely to be stakeholders in a program - participants, other researchers, program staff, other community members, and so on.
Then we put all data in single framework & apply various statistical tools to find out the dynamic on the market.
During the analysis stage, feedback from the stakeholder groups would be compared to determine areas of agreement as well as areas of divergence
