

Key Insights
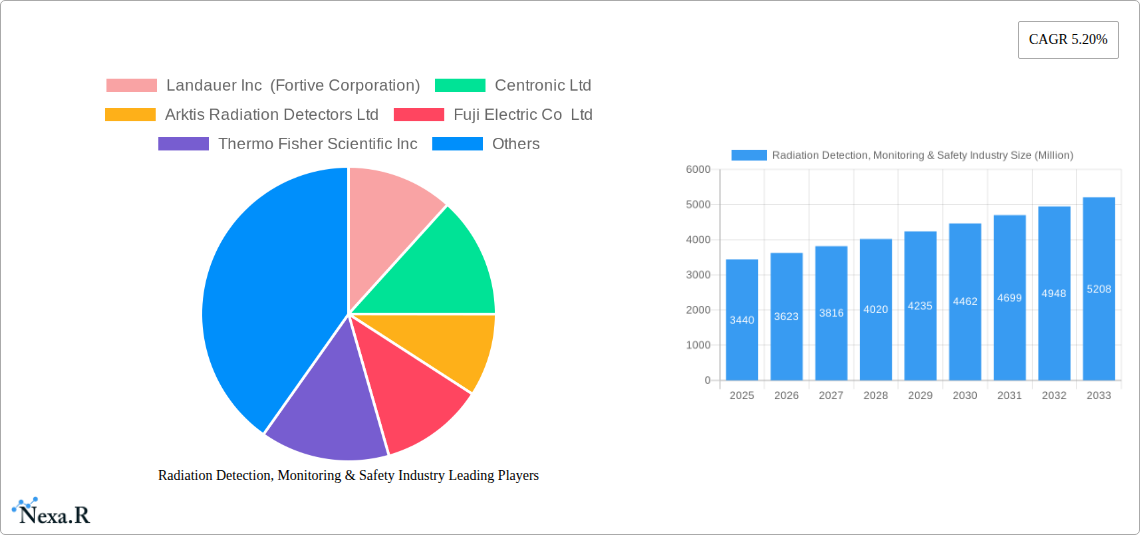
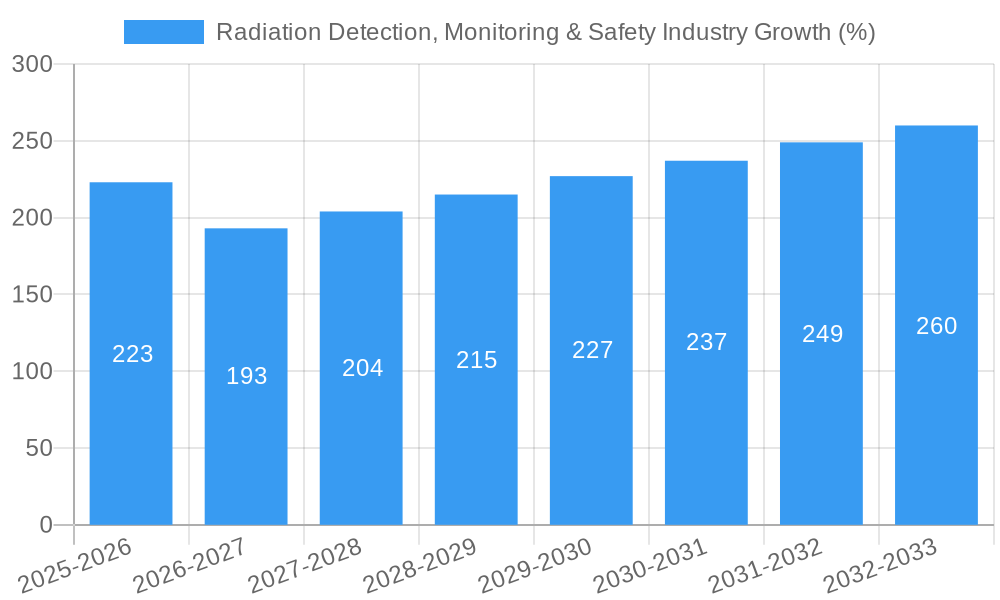
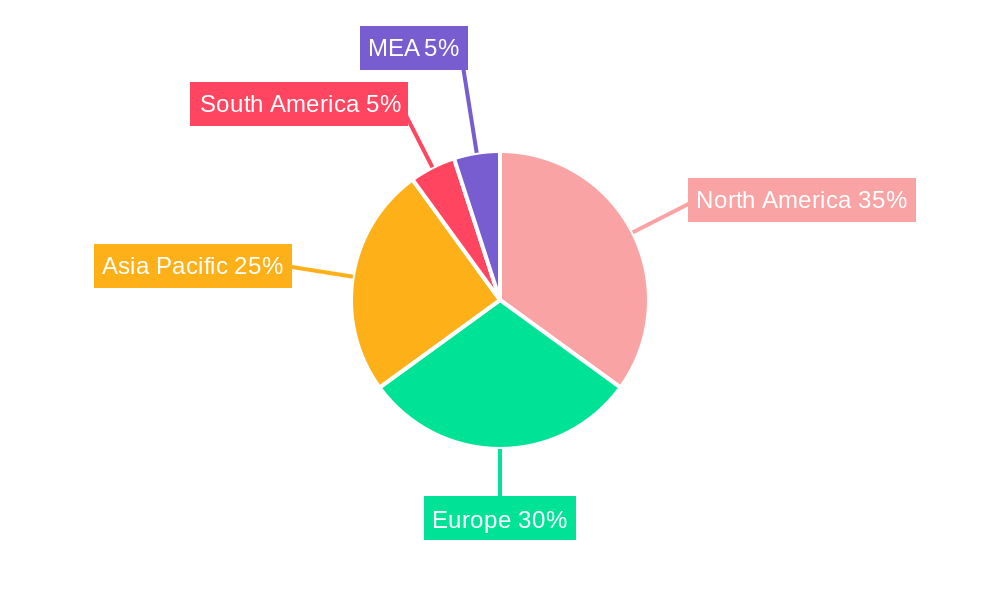
The Radiation Detection, Monitoring, and Safety market is experiencing robust growth, projected at a CAGR of 5.20% from 2019 to 2033. With a market size of $3.44 billion in 2025, this sector is driven by several key factors. Increasing concerns about nuclear terrorism and radiological threats are fueling demand for advanced detection technologies in homeland security and defense. Furthermore, the expanding healthcare sector, with its need for precise radiation monitoring in medical procedures and treatment, contributes significantly to market growth. The industrial sector also plays a crucial role, demanding radiation safety equipment for various applications, including manufacturing and energy production. Technological advancements, such as the development of more compact, sensitive, and user-friendly detectors, are further driving market expansion. The increasing adoption of sophisticated monitoring systems that offer real-time data and remote monitoring capabilities enhances efficiency and safety, thus bolstering market growth. Regulations related to radiation safety and worker protection also contribute to market expansion as organizations strive to comply with stringent guidelines. Segmentation within the market showcases a strong demand across various product types, including detection and monitoring equipment and safety devices. End-user industries like medical and healthcare, industrial settings, homeland security and defense, and the energy and power sector are key contributors to the market's overall value. Growth is expected to be geographically diverse, with significant contributions from North America, Europe, and the Asia-Pacific region.
Despite the positive outlook, the market faces some challenges. High initial investment costs associated with advanced radiation detection systems may hinder adoption, particularly among small and medium-sized enterprises. Furthermore, the market is influenced by fluctuations in government spending on defense and security, potentially impacting demand in specific segments. However, the long-term growth trajectory remains positive, fueled by the persistent need for radiation safety and the ongoing development of innovative technologies. The competitive landscape includes established players such as Fortive Corporation (Landauer Inc), Thermo Fisher Scientific Inc, and Ametek Inc (ORTEC), as well as specialized companies focusing on specific applications. This competitive environment fosters innovation and drives the market towards greater efficiency and performance.
Radiation Detection, Monitoring & Safety Industry Market Report: 2019-2033
This comprehensive report provides a detailed analysis of the Radiation Detection, Monitoring & Safety industry, encompassing market dynamics, growth trends, regional segmentation, product landscape, key players, and future outlook. The study period spans from 2019 to 2033, with 2025 as the base and estimated year. The report leverages extensive data analysis to provide actionable insights for industry professionals, investors, and stakeholders. The market is segmented by product type (Detection and Monitoring, Safety) and end-user industry (Medical and Healthcare, Industrial, Homeland Security and Defense, Energy and Power, Other End-user Industries). The total market size in 2025 is estimated at xx Million.
Radiation Detection, Monitoring & Safety Industry Market Dynamics & Structure
The Radiation Detection, Monitoring & Safety market is characterized by moderate concentration, with several major players and a number of smaller, specialized companies. Technological innovation, driven by advancements in sensor technology, data analytics, and miniaturization, is a key growth driver. Stringent regulatory frameworks concerning radiation safety across various sectors shape market dynamics and influence product development. The industry faces competition from substitute technologies in specific applications, impacting overall market share. M&A activity has been relatively steady, with strategic acquisitions aimed at expanding product portfolios and market reach.
- Market Concentration: Moderately concentrated, with top 5 players holding approximately xx% market share in 2025.
- Technological Innovation: Focus on developing advanced sensors, AI-powered data analysis, and portable, user-friendly devices.
- Regulatory Landscape: Stringent regulations on radiation safety in medical, industrial, and defense sectors influence market growth.
- Competitive Substitutes: Emerging technologies like alternative imaging methods in medical applications pose a challenge.
- M&A Activity: Moderate level of mergers and acquisitions, primarily focused on strategic expansion and technology integration (xx deals in the last 5 years).
- End-User Demographics: Growing demand from healthcare, industrial, and homeland security sectors fuels market expansion.
Radiation Detection, Monitoring & Safety Industry Growth Trends & Insights
The Radiation Detection, Monitoring & Safety market experienced steady growth during the historical period (2019-2024), with a CAGR of xx%. This growth is attributed to increasing awareness of radiation safety concerns across diverse industries, coupled with technological advancements leading to more sophisticated and user-friendly detection systems. Adoption rates are highest in developed economies with stringent regulations and significant investment in safety infrastructure. The market is poised for continued expansion in the forecast period (2025-2033), driven by factors such as increasing demand for advanced detection technologies in emerging markets and the growing adoption of IoT-enabled devices for remote monitoring. Technological disruptions, such as the introduction of miniaturized sensors and AI-powered analysis, are accelerating market growth and changing consumer behavior towards more efficient and reliable solutions. Market penetration continues to grow across all segments, with the highest penetration rates in the medical and healthcare sector. We predict a CAGR of xx% for the forecast period.
Dominant Regions, Countries, or Segments in Radiation Detection, Monitoring & Safety Industry
North America currently dominates the Radiation Detection, Monitoring & Safety market, driven by strong regulatory frameworks, significant investments in homeland security, and a robust healthcare sector. Europe follows as a key market, with high adoption rates in industrial and medical applications. Asia-Pacific exhibits substantial growth potential, fueled by expanding industrialization and increased government spending on infrastructure.
- North America: Dominant due to stringent regulations, high adoption rates in healthcare and homeland security, and strong technological advancements.
- Europe: Significant market share driven by strong industrial sectors and advanced medical facilities.
- Asia-Pacific: High-growth potential due to increasing industrialization and expanding healthcare infrastructure.
- Product Type: The "Detection and Monitoring" segment holds a larger market share, driven by the need for continuous radiation monitoring in various applications.
- End-User Industry: The "Medical and Healthcare" sector is currently the largest end-user, followed by the "Industrial" sector.
Radiation Detection, Monitoring & Safety Industry Product Landscape
The product landscape is marked by a diverse range of detectors, monitors, and safety equipment, catering to specific applications and radiation types. Innovations include advancements in sensor technology, miniaturization, improved data analytics capabilities, and integration with wireless communication networks for remote monitoring. Key performance indicators include sensitivity, accuracy, response time, and ease of use. Unique selling propositions focus on enhanced portability, real-time data analysis, and improved user interfaces. Recent technological advancements are primarily focused on improving the sensitivity and accuracy of detectors, as well as reducing their size and cost.
Key Drivers, Barriers & Challenges in Radiation Detection, Monitoring & Safety Industry
Key Drivers:
- Increasing awareness of radiation safety risks.
- Stringent regulations in key industries.
- Technological advancements in sensor and data analytics.
- Growing investments in infrastructure and security.
Key Barriers and Challenges:
- High initial investment costs for advanced systems.
- Complex regulatory approvals and certifications.
- Competition from substitute technologies.
- Supply chain disruptions impacting availability and cost of components. (Estimated impact on market growth: xx%)
Emerging Opportunities in Radiation Detection, Monitoring & Safety Industry
Emerging opportunities include expansion into untapped markets (e.g., developing economies), development of specialized detectors for niche applications (e.g., environmental monitoring), and integration of AI and machine learning for improved data analysis and predictive maintenance. Growing demand for portable and user-friendly devices, as well as integration with IoT platforms for remote monitoring and data management, presents significant market opportunities.
Growth Accelerators in the Radiation Detection, Monitoring & Safety Industry Industry
Technological breakthroughs in sensor technology and data analytics are key growth accelerators. Strategic partnerships between technology providers and end-users facilitate faster adoption of new technologies. Market expansion strategies targeting emerging economies and new applications (e.g., environmental monitoring) will propel long-term growth.
Key Players Shaping the Radiation Detection, Monitoring & Safety Market
- Landauer Inc (Fortive Corporation)
- Centronic Ltd
- Arktis Radiation Detectors Ltd
- Fuji Electric Co Ltd
- Thermo Fisher Scientific Inc
- Amray Group Limited
- ORTEC (Ametek Inc )
- Mirion Technologies Inc
- Burlington Medical LLC
- ATOMTEX SP
- Radiation Detection Company
- Teledyne FLIR Systems Inc
- RAE Systems Inc (Honeywell International Inc )
- Unfors RaySafe AB
Notable Milestones in Radiation Detection, Monitoring & Safety Industry Sector
- January 2024: US military adopts the new modular Radiological Detection System from D-Tect Systems (Ludlum), replacing outdated AN/PDR-77 and AN/VDR-2 detectors. This significantly impacts the demand for advanced detection systems within the defense sector.
- October 2023: Honeywell launches the FS24X Plus Flame Detector, enhancing safety measures in hydrogen production and use. This highlights the growing focus on safety in specialized industrial applications.
In-Depth Radiation Detection, Monitoring & Safety Industry Market Outlook
The Radiation Detection, Monitoring & Safety market is poised for robust growth over the forecast period, driven by increasing awareness of radiation safety, technological advancements, and expansion into new applications. Strategic opportunities exist in developing innovative products, expanding into emerging markets, and forming strategic partnerships to accelerate adoption and market penetration. The long-term outlook is positive, with significant potential for market expansion and value creation.
Radiation Detection, Monitoring & Safety Industry Segmentation
-
1. Product Type
- 1.1. Detection and Monitoring
- 1.2. Safety
-
2. End-user Industry
- 2.1. Medical and Healthcare
- 2.2. Industrial
- 2.3. Homeland Security and Defense
- 2.4. Energy and Power
- 2.5. Other End-user Industries
Radiation Detection, Monitoring & Safety Industry Segmentation By Geography
- 1. North America
- 2. Europe
- 3. Asia
- 4. Australia and New Zealand
- 5. Latin America
- 6. Middle East and Africa
Radiation Detection, Monitoring & Safety Industry REPORT HIGHLIGHTS
| Aspects | Details |
|---|---|
| Study Period | 2019-2033 |
| Base Year | 2024 |
| Estimated Year | 2025 |
| Forecast Period | 2025-2033 |
| Historical Period | 2019-2024 |
| Growth Rate | CAGR of 5.20% from 2019-2033 |
| Segmentation |
|
Table of Contents
- 1. Introduction
- 1.1. Research Scope
- 1.2. Market Segmentation
- 1.3. Research Methodology
- 1.4. Definitions and Assumptions
- 2. Executive Summary
- 2.1. Introduction
- 3. Market Dynamics
- 3.1. Introduction
- 3.2. Market Drivers
- 3.2.1. Increasing Incidence of Cancer and Other Chronic Diseases; Growing Use of Drones for Radiation Monitoring
- 3.3. Market Restrains
- 3.3.1. Stringent Government Regulations; Lack of Skilled Radiation Professionals
- 3.4. Market Trends
- 3.4.1. Medical and Healthcare Industry to be the Largest End User
- 4. Market Factor Analysis
- 4.1. Porters Five Forces
- 4.2. Supply/Value Chain
- 4.3. PESTEL analysis
- 4.4. Market Entropy
- 4.5. Patent/Trademark Analysis
- 5. Global Radiation Detection, Monitoring & Safety Industry Analysis, Insights and Forecast, 2019-2031
- 5.1. Market Analysis, Insights and Forecast - by Product Type
- 5.1.1. Detection and Monitoring
- 5.1.2. Safety
- 5.2. Market Analysis, Insights and Forecast - by End-user Industry
- 5.2.1. Medical and Healthcare
- 5.2.2. Industrial
- 5.2.3. Homeland Security and Defense
- 5.2.4. Energy and Power
- 5.2.5. Other End-user Industries
- 5.3. Market Analysis, Insights and Forecast - by Region
- 5.3.1. North America
- 5.3.2. Europe
- 5.3.3. Asia
- 5.3.4. Australia and New Zealand
- 5.3.5. Latin America
- 5.3.6. Middle East and Africa
- 5.1. Market Analysis, Insights and Forecast - by Product Type
- 6. North America Radiation Detection, Monitoring & Safety Industry Analysis, Insights and Forecast, 2019-2031
- 6.1. Market Analysis, Insights and Forecast - by Product Type
- 6.1.1. Detection and Monitoring
- 6.1.2. Safety
- 6.2. Market Analysis, Insights and Forecast - by End-user Industry
- 6.2.1. Medical and Healthcare
- 6.2.2. Industrial
- 6.2.3. Homeland Security and Defense
- 6.2.4. Energy and Power
- 6.2.5. Other End-user Industries
- 6.1. Market Analysis, Insights and Forecast - by Product Type
- 7. Europe Radiation Detection, Monitoring & Safety Industry Analysis, Insights and Forecast, 2019-2031
- 7.1. Market Analysis, Insights and Forecast - by Product Type
- 7.1.1. Detection and Monitoring
- 7.1.2. Safety
- 7.2. Market Analysis, Insights and Forecast - by End-user Industry
- 7.2.1. Medical and Healthcare
- 7.2.2. Industrial
- 7.2.3. Homeland Security and Defense
- 7.2.4. Energy and Power
- 7.2.5. Other End-user Industries
- 7.1. Market Analysis, Insights and Forecast - by Product Type
- 8. Asia Radiation Detection, Monitoring & Safety Industry Analysis, Insights and Forecast, 2019-2031
- 8.1. Market Analysis, Insights and Forecast - by Product Type
- 8.1.1. Detection and Monitoring
- 8.1.2. Safety
- 8.2. Market Analysis, Insights and Forecast - by End-user Industry
- 8.2.1. Medical and Healthcare
- 8.2.2. Industrial
- 8.2.3. Homeland Security and Defense
- 8.2.4. Energy and Power
- 8.2.5. Other End-user Industries
- 8.1. Market Analysis, Insights and Forecast - by Product Type
- 9. Australia and New Zealand Radiation Detection, Monitoring & Safety Industry Analysis, Insights and Forecast, 2019-2031
- 9.1. Market Analysis, Insights and Forecast - by Product Type
- 9.1.1. Detection and Monitoring
- 9.1.2. Safety
- 9.2. Market Analysis, Insights and Forecast - by End-user Industry
- 9.2.1. Medical and Healthcare
- 9.2.2. Industrial
- 9.2.3. Homeland Security and Defense
- 9.2.4. Energy and Power
- 9.2.5. Other End-user Industries
- 9.1. Market Analysis, Insights and Forecast - by Product Type
- 10. Latin America Radiation Detection, Monitoring & Safety Industry Analysis, Insights and Forecast, 2019-2031
- 10.1. Market Analysis, Insights and Forecast - by Product Type
- 10.1.1. Detection and Monitoring
- 10.1.2. Safety
- 10.2. Market Analysis, Insights and Forecast - by End-user Industry
- 10.2.1. Medical and Healthcare
- 10.2.2. Industrial
- 10.2.3. Homeland Security and Defense
- 10.2.4. Energy and Power
- 10.2.5. Other End-user Industries
- 10.1. Market Analysis, Insights and Forecast - by Product Type
- 11. Middle East and Africa Radiation Detection, Monitoring & Safety Industry Analysis, Insights and Forecast, 2019-2031
- 11.1. Market Analysis, Insights and Forecast - by Product Type
- 11.1.1. Detection and Monitoring
- 11.1.2. Safety
- 11.2. Market Analysis, Insights and Forecast - by End-user Industry
- 11.2.1. Medical and Healthcare
- 11.2.2. Industrial
- 11.2.3. Homeland Security and Defense
- 11.2.4. Energy and Power
- 11.2.5. Other End-user Industries
- 11.1. Market Analysis, Insights and Forecast - by Product Type
- 12. North America Radiation Detection, Monitoring & Safety Industry Analysis, Insights and Forecast, 2019-2031
- 12.1. Market Analysis, Insights and Forecast - By Country/Sub-region
- 12.1.1 United States
- 12.1.2 Canada
- 12.1.3 Mexico
- 13. Europe Radiation Detection, Monitoring & Safety Industry Analysis, Insights and Forecast, 2019-2031
- 13.1. Market Analysis, Insights and Forecast - By Country/Sub-region
- 13.1.1 Germany
- 13.1.2 United Kingdom
- 13.1.3 France
- 13.1.4 Spain
- 13.1.5 Italy
- 13.1.6 Spain
- 13.1.7 Belgium
- 13.1.8 Netherland
- 13.1.9 Nordics
- 13.1.10 Rest of Europe
- 14. Asia Pacific Radiation Detection, Monitoring & Safety Industry Analysis, Insights and Forecast, 2019-2031
- 14.1. Market Analysis, Insights and Forecast - By Country/Sub-region
- 14.1.1 China
- 14.1.2 Japan
- 14.1.3 India
- 14.1.4 South Korea
- 14.1.5 Southeast Asia
- 14.1.6 Australia
- 14.1.7 Indonesia
- 14.1.8 Phillipes
- 14.1.9 Singapore
- 14.1.10 Thailandc
- 14.1.11 Rest of Asia Pacific
- 15. South America Radiation Detection, Monitoring & Safety Industry Analysis, Insights and Forecast, 2019-2031
- 15.1. Market Analysis, Insights and Forecast - By Country/Sub-region
- 15.1.1 Brazil
- 15.1.2 Argentina
- 15.1.3 Peru
- 15.1.4 Chile
- 15.1.5 Colombia
- 15.1.6 Ecuador
- 15.1.7 Venezuela
- 15.1.8 Rest of South America
- 16. MEA Radiation Detection, Monitoring & Safety Industry Analysis, Insights and Forecast, 2019-2031
- 16.1. Market Analysis, Insights and Forecast - By Country/Sub-region
- 16.1.1 United Arab Emirates
- 16.1.2 Saudi Arabia
- 16.1.3 South Africa
- 16.1.4 Rest of Middle East and Africa
- 17. Competitive Analysis
- 17.1. Global Market Share Analysis 2024
- 17.2. Company Profiles
- 17.2.1 Landauer Inc (Fortive Corporation)
- 17.2.1.1. Overview
- 17.2.1.2. Products
- 17.2.1.3. SWOT Analysis
- 17.2.1.4. Recent Developments
- 17.2.1.5. Financials (Based on Availability)
- 17.2.2 Centronic Ltd
- 17.2.2.1. Overview
- 17.2.2.2. Products
- 17.2.2.3. SWOT Analysis
- 17.2.2.4. Recent Developments
- 17.2.2.5. Financials (Based on Availability)
- 17.2.3 Arktis Radiation Detectors Ltd
- 17.2.3.1. Overview
- 17.2.3.2. Products
- 17.2.3.3. SWOT Analysis
- 17.2.3.4. Recent Developments
- 17.2.3.5. Financials (Based on Availability)
- 17.2.4 Fuji Electric Co Ltd
- 17.2.4.1. Overview
- 17.2.4.2. Products
- 17.2.4.3. SWOT Analysis
- 17.2.4.4. Recent Developments
- 17.2.4.5. Financials (Based on Availability)
- 17.2.5 Thermo Fisher Scientific Inc
- 17.2.5.1. Overview
- 17.2.5.2. Products
- 17.2.5.3. SWOT Analysis
- 17.2.5.4. Recent Developments
- 17.2.5.5. Financials (Based on Availability)
- 17.2.6 Amray Group Limited
- 17.2.6.1. Overview
- 17.2.6.2. Products
- 17.2.6.3. SWOT Analysis
- 17.2.6.4. Recent Developments
- 17.2.6.5. Financials (Based on Availability)
- 17.2.7 ORTEC (Ametek Inc )
- 17.2.7.1. Overview
- 17.2.7.2. Products
- 17.2.7.3. SWOT Analysis
- 17.2.7.4. Recent Developments
- 17.2.7.5. Financials (Based on Availability)
- 17.2.8 Mirion Technologies Inc
- 17.2.8.1. Overview
- 17.2.8.2. Products
- 17.2.8.3. SWOT Analysis
- 17.2.8.4. Recent Developments
- 17.2.8.5. Financials (Based on Availability)
- 17.2.9 Burlington Medical LLC
- 17.2.9.1. Overview
- 17.2.9.2. Products
- 17.2.9.3. SWOT Analysis
- 17.2.9.4. Recent Developments
- 17.2.9.5. Financials (Based on Availability)
- 17.2.10 ATOMTEX SP
- 17.2.10.1. Overview
- 17.2.10.2. Products
- 17.2.10.3. SWOT Analysis
- 17.2.10.4. Recent Developments
- 17.2.10.5. Financials (Based on Availability)
- 17.2.11 Radiation Detection Company
- 17.2.11.1. Overview
- 17.2.11.2. Products
- 17.2.11.3. SWOT Analysis
- 17.2.11.4. Recent Developments
- 17.2.11.5. Financials (Based on Availability)
- 17.2.12 Teledyne FLIR Systems Inc
- 17.2.12.1. Overview
- 17.2.12.2. Products
- 17.2.12.3. SWOT Analysis
- 17.2.12.4. Recent Developments
- 17.2.12.5. Financials (Based on Availability)
- 17.2.13 RAE Systems Inc (Honeywell International Inc )
- 17.2.13.1. Overview
- 17.2.13.2. Products
- 17.2.13.3. SWOT Analysis
- 17.2.13.4. Recent Developments
- 17.2.13.5. Financials (Based on Availability)
- 17.2.14 Unfors RaySafe AB
- 17.2.14.1. Overview
- 17.2.14.2. Products
- 17.2.14.3. SWOT Analysis
- 17.2.14.4. Recent Developments
- 17.2.14.5. Financials (Based on Availability)
- 17.2.1 Landauer Inc (Fortive Corporation)
List of Figures
- Figure 1: Global Radiation Detection, Monitoring & Safety Industry Revenue Breakdown (Million, %) by Region 2024 & 2032
- Figure 2: North America Radiation Detection, Monitoring & Safety Industry Revenue (Million), by Country 2024 & 2032
- Figure 3: North America Radiation Detection, Monitoring & Safety Industry Revenue Share (%), by Country 2024 & 2032
- Figure 4: Europe Radiation Detection, Monitoring & Safety Industry Revenue (Million), by Country 2024 & 2032
- Figure 5: Europe Radiation Detection, Monitoring & Safety Industry Revenue Share (%), by Country 2024 & 2032
- Figure 6: Asia Pacific Radiation Detection, Monitoring & Safety Industry Revenue (Million), by Country 2024 & 2032
- Figure 7: Asia Pacific Radiation Detection, Monitoring & Safety Industry Revenue Share (%), by Country 2024 & 2032
- Figure 8: South America Radiation Detection, Monitoring & Safety Industry Revenue (Million), by Country 2024 & 2032
- Figure 9: South America Radiation Detection, Monitoring & Safety Industry Revenue Share (%), by Country 2024 & 2032
- Figure 10: MEA Radiation Detection, Monitoring & Safety Industry Revenue (Million), by Country 2024 & 2032
- Figure 11: MEA Radiation Detection, Monitoring & Safety Industry Revenue Share (%), by Country 2024 & 2032
- Figure 12: North America Radiation Detection, Monitoring & Safety Industry Revenue (Million), by Product Type 2024 & 2032
- Figure 13: North America Radiation Detection, Monitoring & Safety Industry Revenue Share (%), by Product Type 2024 & 2032
- Figure 14: North America Radiation Detection, Monitoring & Safety Industry Revenue (Million), by End-user Industry 2024 & 2032
- Figure 15: North America Radiation Detection, Monitoring & Safety Industry Revenue Share (%), by End-user Industry 2024 & 2032
- Figure 16: North America Radiation Detection, Monitoring & Safety Industry Revenue (Million), by Country 2024 & 2032
- Figure 17: North America Radiation Detection, Monitoring & Safety Industry Revenue Share (%), by Country 2024 & 2032
- Figure 18: Europe Radiation Detection, Monitoring & Safety Industry Revenue (Million), by Product Type 2024 & 2032
- Figure 19: Europe Radiation Detection, Monitoring & Safety Industry Revenue Share (%), by Product Type 2024 & 2032
- Figure 20: Europe Radiation Detection, Monitoring & Safety Industry Revenue (Million), by End-user Industry 2024 & 2032
- Figure 21: Europe Radiation Detection, Monitoring & Safety Industry Revenue Share (%), by End-user Industry 2024 & 2032
- Figure 22: Europe Radiation Detection, Monitoring & Safety Industry Revenue (Million), by Country 2024 & 2032
- Figure 23: Europe Radiation Detection, Monitoring & Safety Industry Revenue Share (%), by Country 2024 & 2032
- Figure 24: Asia Radiation Detection, Monitoring & Safety Industry Revenue (Million), by Product Type 2024 & 2032
- Figure 25: Asia Radiation Detection, Monitoring & Safety Industry Revenue Share (%), by Product Type 2024 & 2032
- Figure 26: Asia Radiation Detection, Monitoring & Safety Industry Revenue (Million), by End-user Industry 2024 & 2032
- Figure 27: Asia Radiation Detection, Monitoring & Safety Industry Revenue Share (%), by End-user Industry 2024 & 2032
- Figure 28: Asia Radiation Detection, Monitoring & Safety Industry Revenue (Million), by Country 2024 & 2032
- Figure 29: Asia Radiation Detection, Monitoring & Safety Industry Revenue Share (%), by Country 2024 & 2032
- Figure 30: Australia and New Zealand Radiation Detection, Monitoring & Safety Industry Revenue (Million), by Product Type 2024 & 2032
- Figure 31: Australia and New Zealand Radiation Detection, Monitoring & Safety Industry Revenue Share (%), by Product Type 2024 & 2032
- Figure 32: Australia and New Zealand Radiation Detection, Monitoring & Safety Industry Revenue (Million), by End-user Industry 2024 & 2032
- Figure 33: Australia and New Zealand Radiation Detection, Monitoring & Safety Industry Revenue Share (%), by End-user Industry 2024 & 2032
- Figure 34: Australia and New Zealand Radiation Detection, Monitoring & Safety Industry Revenue (Million), by Country 2024 & 2032
- Figure 35: Australia and New Zealand Radiation Detection, Monitoring & Safety Industry Revenue Share (%), by Country 2024 & 2032
- Figure 36: Latin America Radiation Detection, Monitoring & Safety Industry Revenue (Million), by Product Type 2024 & 2032
- Figure 37: Latin America Radiation Detection, Monitoring & Safety Industry Revenue Share (%), by Product Type 2024 & 2032
- Figure 38: Latin America Radiation Detection, Monitoring & Safety Industry Revenue (Million), by End-user Industry 2024 & 2032
- Figure 39: Latin America Radiation Detection, Monitoring & Safety Industry Revenue Share (%), by End-user Industry 2024 & 2032
- Figure 40: Latin America Radiation Detection, Monitoring & Safety Industry Revenue (Million), by Country 2024 & 2032
- Figure 41: Latin America Radiation Detection, Monitoring & Safety Industry Revenue Share (%), by Country 2024 & 2032
- Figure 42: Middle East and Africa Radiation Detection, Monitoring & Safety Industry Revenue (Million), by Product Type 2024 & 2032
- Figure 43: Middle East and Africa Radiation Detection, Monitoring & Safety Industry Revenue Share (%), by Product Type 2024 & 2032
- Figure 44: Middle East and Africa Radiation Detection, Monitoring & Safety Industry Revenue (Million), by End-user Industry 2024 & 2032
- Figure 45: Middle East and Africa Radiation Detection, Monitoring & Safety Industry Revenue Share (%), by End-user Industry 2024 & 2032
- Figure 46: Middle East and Africa Radiation Detection, Monitoring & Safety Industry Revenue (Million), by Country 2024 & 2032
- Figure 47: Middle East and Africa Radiation Detection, Monitoring & Safety Industry Revenue Share (%), by Country 2024 & 2032
List of Tables
- Table 1: Global Radiation Detection, Monitoring & Safety Industry Revenue Million Forecast, by Region 2019 & 2032
- Table 2: Global Radiation Detection, Monitoring & Safety Industry Revenue Million Forecast, by Product Type 2019 & 2032
- Table 3: Global Radiation Detection, Monitoring & Safety Industry Revenue Million Forecast, by End-user Industry 2019 & 2032
- Table 4: Global Radiation Detection, Monitoring & Safety Industry Revenue Million Forecast, by Region 2019 & 2032
- Table 5: Global Radiation Detection, Monitoring & Safety Industry Revenue Million Forecast, by Country 2019 & 2032
- Table 6: United States Radiation Detection, Monitoring & Safety Industry Revenue (Million) Forecast, by Application 2019 & 2032
- Table 7: Canada Radiation Detection, Monitoring & Safety Industry Revenue (Million) Forecast, by Application 2019 & 2032
- Table 8: Mexico Radiation Detection, Monitoring & Safety Industry Revenue (Million) Forecast, by Application 2019 & 2032
- Table 9: Global Radiation Detection, Monitoring & Safety Industry Revenue Million Forecast, by Country 2019 & 2032
- Table 10: Germany Radiation Detection, Monitoring & Safety Industry Revenue (Million) Forecast, by Application 2019 & 2032
- Table 11: United Kingdom Radiation Detection, Monitoring & Safety Industry Revenue (Million) Forecast, by Application 2019 & 2032
- Table 12: France Radiation Detection, Monitoring & Safety Industry Revenue (Million) Forecast, by Application 2019 & 2032
- Table 13: Spain Radiation Detection, Monitoring & Safety Industry Revenue (Million) Forecast, by Application 2019 & 2032
- Table 14: Italy Radiation Detection, Monitoring & Safety Industry Revenue (Million) Forecast, by Application 2019 & 2032
- Table 15: Spain Radiation Detection, Monitoring & Safety Industry Revenue (Million) Forecast, by Application 2019 & 2032
- Table 16: Belgium Radiation Detection, Monitoring & Safety Industry Revenue (Million) Forecast, by Application 2019 & 2032
- Table 17: Netherland Radiation Detection, Monitoring & Safety Industry Revenue (Million) Forecast, by Application 2019 & 2032
- Table 18: Nordics Radiation Detection, Monitoring & Safety Industry Revenue (Million) Forecast, by Application 2019 & 2032
- Table 19: Rest of Europe Radiation Detection, Monitoring & Safety Industry Revenue (Million) Forecast, by Application 2019 & 2032
- Table 20: Global Radiation Detection, Monitoring & Safety Industry Revenue Million Forecast, by Country 2019 & 2032
- Table 21: China Radiation Detection, Monitoring & Safety Industry Revenue (Million) Forecast, by Application 2019 & 2032
- Table 22: Japan Radiation Detection, Monitoring & Safety Industry Revenue (Million) Forecast, by Application 2019 & 2032
- Table 23: India Radiation Detection, Monitoring & Safety Industry Revenue (Million) Forecast, by Application 2019 & 2032
- Table 24: South Korea Radiation Detection, Monitoring & Safety Industry Revenue (Million) Forecast, by Application 2019 & 2032
- Table 25: Southeast Asia Radiation Detection, Monitoring & Safety Industry Revenue (Million) Forecast, by Application 2019 & 2032
- Table 26: Australia Radiation Detection, Monitoring & Safety Industry Revenue (Million) Forecast, by Application 2019 & 2032
- Table 27: Indonesia Radiation Detection, Monitoring & Safety Industry Revenue (Million) Forecast, by Application 2019 & 2032
- Table 28: Phillipes Radiation Detection, Monitoring & Safety Industry Revenue (Million) Forecast, by Application 2019 & 2032
- Table 29: Singapore Radiation Detection, Monitoring & Safety Industry Revenue (Million) Forecast, by Application 2019 & 2032
- Table 30: Thailandc Radiation Detection, Monitoring & Safety Industry Revenue (Million) Forecast, by Application 2019 & 2032
- Table 31: Rest of Asia Pacific Radiation Detection, Monitoring & Safety Industry Revenue (Million) Forecast, by Application 2019 & 2032
- Table 32: Global Radiation Detection, Monitoring & Safety Industry Revenue Million Forecast, by Country 2019 & 2032
- Table 33: Brazil Radiation Detection, Monitoring & Safety Industry Revenue (Million) Forecast, by Application 2019 & 2032
- Table 34: Argentina Radiation Detection, Monitoring & Safety Industry Revenue (Million) Forecast, by Application 2019 & 2032
- Table 35: Peru Radiation Detection, Monitoring & Safety Industry Revenue (Million) Forecast, by Application 2019 & 2032
- Table 36: Chile Radiation Detection, Monitoring & Safety Industry Revenue (Million) Forecast, by Application 2019 & 2032
- Table 37: Colombia Radiation Detection, Monitoring & Safety Industry Revenue (Million) Forecast, by Application 2019 & 2032
- Table 38: Ecuador Radiation Detection, Monitoring & Safety Industry Revenue (Million) Forecast, by Application 2019 & 2032
- Table 39: Venezuela Radiation Detection, Monitoring & Safety Industry Revenue (Million) Forecast, by Application 2019 & 2032
- Table 40: Rest of South America Radiation Detection, Monitoring & Safety Industry Revenue (Million) Forecast, by Application 2019 & 2032
- Table 41: Global Radiation Detection, Monitoring & Safety Industry Revenue Million Forecast, by Country 2019 & 2032
- Table 42: United Arab Emirates Radiation Detection, Monitoring & Safety Industry Revenue (Million) Forecast, by Application 2019 & 2032
- Table 43: Saudi Arabia Radiation Detection, Monitoring & Safety Industry Revenue (Million) Forecast, by Application 2019 & 2032
- Table 44: South Africa Radiation Detection, Monitoring & Safety Industry Revenue (Million) Forecast, by Application 2019 & 2032
- Table 45: Rest of Middle East and Africa Radiation Detection, Monitoring & Safety Industry Revenue (Million) Forecast, by Application 2019 & 2032
- Table 46: Global Radiation Detection, Monitoring & Safety Industry Revenue Million Forecast, by Product Type 2019 & 2032
- Table 47: Global Radiation Detection, Monitoring & Safety Industry Revenue Million Forecast, by End-user Industry 2019 & 2032
- Table 48: Global Radiation Detection, Monitoring & Safety Industry Revenue Million Forecast, by Country 2019 & 2032
- Table 49: Global Radiation Detection, Monitoring & Safety Industry Revenue Million Forecast, by Product Type 2019 & 2032
- Table 50: Global Radiation Detection, Monitoring & Safety Industry Revenue Million Forecast, by End-user Industry 2019 & 2032
- Table 51: Global Radiation Detection, Monitoring & Safety Industry Revenue Million Forecast, by Country 2019 & 2032
- Table 52: Global Radiation Detection, Monitoring & Safety Industry Revenue Million Forecast, by Product Type 2019 & 2032
- Table 53: Global Radiation Detection, Monitoring & Safety Industry Revenue Million Forecast, by End-user Industry 2019 & 2032
- Table 54: Global Radiation Detection, Monitoring & Safety Industry Revenue Million Forecast, by Country 2019 & 2032
- Table 55: Global Radiation Detection, Monitoring & Safety Industry Revenue Million Forecast, by Product Type 2019 & 2032
- Table 56: Global Radiation Detection, Monitoring & Safety Industry Revenue Million Forecast, by End-user Industry 2019 & 2032
- Table 57: Global Radiation Detection, Monitoring & Safety Industry Revenue Million Forecast, by Country 2019 & 2032
- Table 58: Global Radiation Detection, Monitoring & Safety Industry Revenue Million Forecast, by Product Type 2019 & 2032
- Table 59: Global Radiation Detection, Monitoring & Safety Industry Revenue Million Forecast, by End-user Industry 2019 & 2032
- Table 60: Global Radiation Detection, Monitoring & Safety Industry Revenue Million Forecast, by Country 2019 & 2032
- Table 61: Global Radiation Detection, Monitoring & Safety Industry Revenue Million Forecast, by Product Type 2019 & 2032
- Table 62: Global Radiation Detection, Monitoring & Safety Industry Revenue Million Forecast, by End-user Industry 2019 & 2032
- Table 63: Global Radiation Detection, Monitoring & Safety Industry Revenue Million Forecast, by Country 2019 & 2032
Frequently Asked Questions
1. What is the projected Compound Annual Growth Rate (CAGR) of the Radiation Detection, Monitoring & Safety Industry?
The projected CAGR is approximately 5.20%.
2. Which companies are prominent players in the Radiation Detection, Monitoring & Safety Industry?
Key companies in the market include Landauer Inc (Fortive Corporation), Centronic Ltd, Arktis Radiation Detectors Ltd, Fuji Electric Co Ltd, Thermo Fisher Scientific Inc, Amray Group Limited, ORTEC (Ametek Inc ), Mirion Technologies Inc, Burlington Medical LLC, ATOMTEX SP, Radiation Detection Company, Teledyne FLIR Systems Inc, RAE Systems Inc (Honeywell International Inc ), Unfors RaySafe AB.
3. What are the main segments of the Radiation Detection, Monitoring & Safety Industry?
The market segments include Product Type, End-user Industry.
4. Can you provide details about the market size?
The market size is estimated to be USD 3.44 Million as of 2022.
5. What are some drivers contributing to market growth?
Increasing Incidence of Cancer and Other Chronic Diseases; Growing Use of Drones for Radiation Monitoring.
6. What are the notable trends driving market growth?
Medical and Healthcare Industry to be the Largest End User.
7. Are there any restraints impacting market growth?
Stringent Government Regulations; Lack of Skilled Radiation Professionals.
8. Can you provide examples of recent developments in the market?
January 2024: The US military made the decision to upgrade its radiation detection equipment by adopting the new "Radiological Detection System" produced by D-Tect Systems, a division of Ludlum based in Utah. This system is modular, allowing for customization with various external probes to meet specific detection needs, such as alpha or neutron detection. The outdated AN/PDR-77 and AN/VDR-2 radiation detectors, which had been in use for 35 years, were replaced with this new technology.
9. What pricing options are available for accessing the report?
Pricing options include single-user, multi-user, and enterprise licenses priced at USD 4750, USD 5250, and USD 8750 respectively.
10. Is the market size provided in terms of value or volume?
The market size is provided in terms of value, measured in Million.
11. Are there any specific market keywords associated with the report?
Yes, the market keyword associated with the report is "Radiation Detection, Monitoring & Safety Industry," which aids in identifying and referencing the specific market segment covered.
12. How do I determine which pricing option suits my needs best?
The pricing options vary based on user requirements and access needs. Individual users may opt for single-user licenses, while businesses requiring broader access may choose multi-user or enterprise licenses for cost-effective access to the report.
13. Are there any additional resources or data provided in the Radiation Detection, Monitoring & Safety Industry report?
While the report offers comprehensive insights, it's advisable to review the specific contents or supplementary materials provided to ascertain if additional resources or data are available.
14. How can I stay updated on further developments or reports in the Radiation Detection, Monitoring & Safety Industry?
To stay informed about further developments, trends, and reports in the Radiation Detection, Monitoring & Safety Industry, consider subscribing to industry newsletters, following relevant companies and organizations, or regularly checking reputable industry news sources and publications.
Methodology
Step 1 - Identification of Relevant Samples Size from Population Database


Step 2 - Approaches for Defining Global Market Size (Value, Volume* & Price*)

Note*: In applicable scenarios
Step 3 - Data Sources
Primary Research
- Web Analytics
- Survey Reports
- Research Institute
- Latest Research Reports
- Opinion Leaders
Secondary Research
- Annual Reports
- White Paper
- Latest Press Release
- Industry Association
- Paid Database
- Investor Presentations

Step 4 - Data Triangulation
Involves using different sources of information in order to increase the validity of a study
These sources are likely to be stakeholders in a program - participants, other researchers, program staff, other community members, and so on.
Then we put all data in single framework & apply various statistical tools to find out the dynamic on the market.
During the analysis stage, feedback from the stakeholder groups would be compared to determine areas of agreement as well as areas of divergence
