

Key Insights
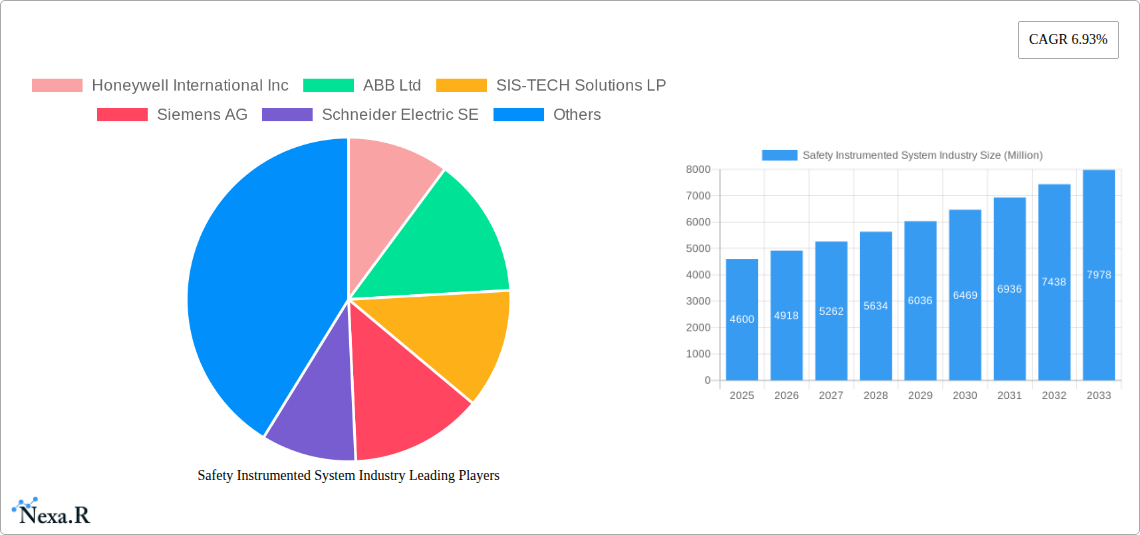
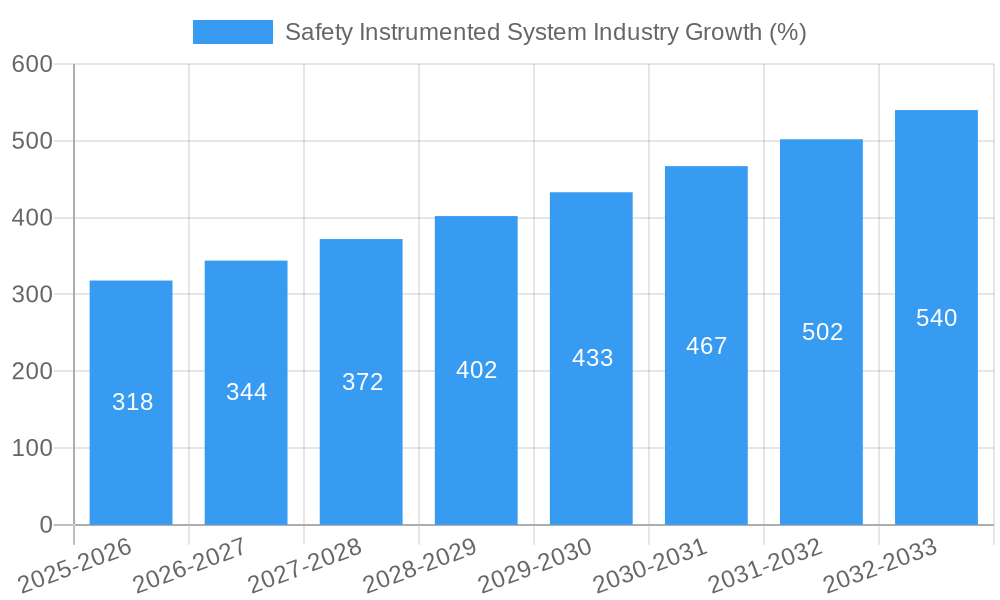
The Safety Instrumented System (SIS) market, valued at $4.60 billion in 2025, is projected to experience robust growth, driven by increasing industrial automation, stringent safety regulations across sectors like oil & gas and chemicals, and the rising demand for process safety in critical infrastructure. The Compound Annual Growth Rate (CAGR) of 6.93% from 2025 to 2033 indicates a significant expansion of the market, exceeding $8 billion by 2033. Key application segments include Emergency Shutdown Systems (ESD), Fire & Gas Monitoring and Control (F&GC), and High Integrity Pressure Protection Systems (HIPPS), all crucial for preventing catastrophic incidents. The Oil & Gas, Chemicals & Petrochemicals, and Power Generation sectors are major end-users, contributing significantly to the market's growth. Technological advancements, such as the integration of advanced analytics and artificial intelligence for predictive maintenance and improved safety protocols, further fuel market expansion. However, high initial investment costs for SIS implementation and the complexity involved in integrating these systems across existing infrastructure pose challenges to market growth.
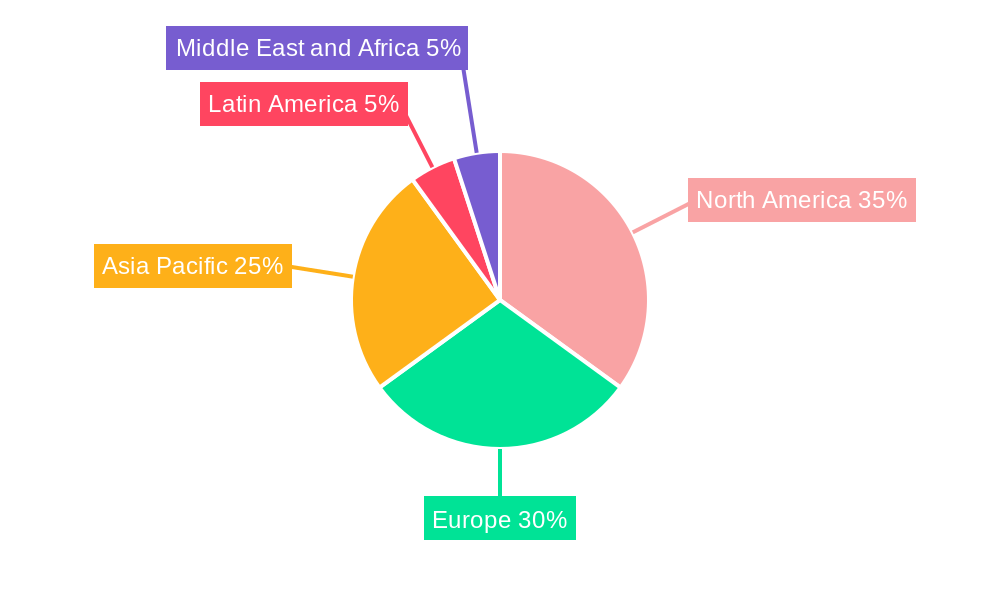
Competition in the SIS market is intense, with major players like Honeywell, ABB, Siemens, and Schneider Electric vying for market share. These established players are leveraging their extensive experience and technological capabilities to cater to diverse industry needs. The market is also witnessing the emergence of specialized solution providers offering niche applications and services, enhancing customization and flexibility. The geographical distribution of the market is likely to be dominated by North America and Europe initially, followed by a rapid expansion in the Asia-Pacific region driven by industrialization and infrastructure development. Future growth will hinge on advancements in cybersecurity, the integration of SIS with other industrial automation systems, and the increasing adoption of Industry 4.0 technologies.
Safety Instrumented System (SIS) Industry Market Report: 2019-2033
This comprehensive report provides a detailed analysis of the Safety Instrumented System (SIS) industry, encompassing market dynamics, growth trends, regional insights, and competitive landscapes. The study period spans from 2019 to 2033, with 2025 serving as the base and estimated year. The report utilizes data from the historical period (2019-2024) to forecast market trends from 2025 to 2033. The total market value in 2025 is estimated at xx Million units, expected to reach xx Million units by 2033.
Safety Instrumented System Industry Market Dynamics & Structure
The SIS market is characterized by a moderately concentrated structure, with key players like Honeywell International Inc, ABB Ltd, Siemens AG, and Schneider Electric SE holding significant market share. However, the presence of several specialized players like SIS-TECH Solutions LP, HIMA Paul Hildebrandt GmbH, Rockwell Automation Inc, Yokogawa Electric Corporation, Schlumberger Limited, and Emerson Electric Company fosters competition. The market is driven by stringent safety regulations across industries, increasing automation in hazardous environments, and the growing adoption of advanced technologies like AI and IoT for enhanced safety and efficiency. Technological innovation is a crucial driver, with ongoing advancements in hardware, software, and communication protocols.
- Market Concentration: Moderately concentrated, with top players holding xx% market share in 2025.
- Technological Innovation: Driven by AI, IoT integration, and improved communication protocols.
- Regulatory Frameworks: Stringent safety standards (e.g., IEC 61508, ISO 13849) are key drivers.
- Competitive Substitutes: Limited direct substitutes, but alternative safety solutions exist.
- M&A Activity: Moderate M&A activity observed, with a focus on expanding product portfolios and geographical reach. xx deals were recorded between 2019-2024.
- End-User Demographics: Primarily driven by Oil & Gas, Chemicals & Petrochemicals, and Power Generation sectors.
Safety Instrumented System Industry Growth Trends & Insights
The SIS market experienced a Compound Annual Growth Rate (CAGR) of xx% during 2019-2024. This growth is attributed to increasing industrial automation, stringent safety regulations, and rising demand from high-risk industries. Technological advancements, particularly in areas like predictive maintenance and remote diagnostics, further propelled market growth. Market penetration in key end-user sectors remains relatively high in mature markets, with growth opportunities emerging from the adoption of SIS in emerging economies and new applications. Consumer behavior shifts toward enhanced safety and operational reliability are significant contributors to the market's expansion. The market is projected to witness a CAGR of xx% from 2025-2033, driven by continuous advancements in SIS technology and the increasing demand for improved safety systems across various industries.
Dominant Regions, Countries, or Segments in Safety Instrumented System Industry
The Oil and Gas sector is currently the largest segment in the SIS market, followed by Chemicals and Petrochemicals. North America and Europe lead in market share, driven by high industrial automation adoption and stringent safety regulations. The Asia-Pacific region is expected to experience significant growth due to rapid industrialization and investments in infrastructure projects.
By Application:
- Emergency Shutdown Systems (ESD): Largest segment due to mandatory installations in hazardous industries.
- Fire and Gas Monitoring and Control (F&GC): Significant growth driven by the need for early fire detection and prevention.
- High Integrity Pressure Protection Systems (HIPPS): Steady growth due to essential role in preventing catastrophic pressure events.
By End-User:
- Oil and Gas: Largest end-user, driven by high-risk operations and stringent safety requirements.
- Chemicals and Petrochemicals: High adoption rates due to potential for hazardous incidents.
- Power Generation: Growing demand for reliable safety systems to mitigate risks in power plants.
Safety Instrumented System Industry Product Landscape
The SIS product landscape is evolving rapidly, with manufacturers focusing on developing advanced systems that integrate advanced technologies. This includes intelligent diagnostic capabilities, enhanced cybersecurity measures, and seamless integration with other industrial automation systems. Key features include improved human-machine interface (HMI) for ease of operation, remote diagnostics for predictive maintenance, and better data analytics for improved safety management. Unique selling propositions include higher safety integrity levels (SILs), reduced lifecycle costs, and increased operational efficiency.
Key Drivers, Barriers & Challenges in Safety Instrumented System Industry
Key Drivers:
- Stringent safety regulations and industry standards.
- Increasing automation in hazardous industries.
- Rising awareness of safety and risk mitigation.
- Technological advancements, such as AI and IoT integration.
Key Challenges:
- High initial investment costs.
- Complexity of system integration.
- Cybersecurity threats to SIS systems.
- Skill gaps in SIS system design and maintenance. The shortage of skilled personnel impacts approximately xx% of SIS implementations.
Emerging Opportunities in Safety Instrumented System Industry
Emerging opportunities include the increasing adoption of SIS in new and evolving industrial sectors, the integration of advanced technologies such as AI and machine learning for predictive maintenance and improved decision-making, and the growth of the digital twin technology, creating virtual representations of SIS for testing and optimization purposes. Furthermore, the development of more compact and modular SIS systems is expected to open up opportunities in smaller industrial settings.
Growth Accelerators in the Safety Instrumented System Industry
Long-term growth is fueled by the ongoing development of advanced SIS technologies, strategic partnerships between manufacturers and end-users, and the expansion into new geographic markets. Focus on reducing lifecycle costs through innovative solutions, improved training and support for end-users, and better cybersecurity protocols, coupled with increasing regulatory compliance, will continue to drive market growth.
Key Players Shaping the Safety Instrumented System Industry Market
- Honeywell International Inc
- ABB Ltd
- SIS-TECH Solutions LP
- Siemens AG
- Schneider Electric SE
- HIMA Paul Hildebrandt GmbH
- Rockwell Automation Inc
- Yokogawa Electric Corporation
- Schlumberger Limited
- Emerson Electric Company
Notable Milestones in Safety Instrumented System Industry Sector
- January 2021: Yokogawa Electric Corporation developed ProSafe-RS Lite, a SIL2 safety instrumented system.
- March 2021: BASF implemented HIMA's safety technology in a new production facility.
- June 2021: Intel's Atom x6000E series processors received IEC61508 SIL2 and ISO13849 certifications.
In-Depth Safety Instrumented System Industry Market Outlook
The SIS market presents significant long-term growth potential, driven by continuous technological advancements and increasing demand for enhanced safety measures across various industries. Strategic partnerships, global market expansion, and a focus on cost-effective solutions will play a key role in shaping the future of the SIS industry. The integration of AI, IoT, and digital twin technology will create opportunities for innovation and improved system performance, leading to substantial growth over the forecast period.
Safety Instrumented System Industry Segmentation
-
1. Application
- 1.1. Emergency Shutdown Systems (ESD)
- 1.2. Fire and Gas Monitoring and Control (F&GC)
- 1.3. High Integrity Pressure Protection Systems (HIPPS)
- 1.4. Burner Management Systems (BMS)
- 1.5. Turbo Machinery Control
- 1.6. Other Applications
-
2. End User
- 2.1. Chemicals and Petrochemicals
- 2.2. Power Generation
- 2.3. Pharmaceutical
- 2.4. Food and Beverage
- 2.5. Oil and Gas
- 2.6. Other End Users
Safety Instrumented System Industry Segmentation By Geography
- 1. North America
- 2. Europe
- 3. Asia
- 4. Australia and New Zealand
- 5. Latin America
- 6. Middle East
- 7. Africa
Safety Instrumented System Industry REPORT HIGHLIGHTS
| Aspects | Details |
|---|---|
| Study Period | 2019-2033 |
| Base Year | 2024 |
| Estimated Year | 2025 |
| Forecast Period | 2025-2033 |
| Historical Period | 2019-2024 |
| Growth Rate | CAGR of 6.93% from 2019-2033 |
| Segmentation |
|
Table of Contents
- 1. Introduction
- 1.1. Research Scope
- 1.2. Market Segmentation
- 1.3. Research Methodology
- 1.4. Definitions and Assumptions
- 2. Executive Summary
- 2.1. Introduction
- 3. Market Dynamics
- 3.1. Introduction
- 3.2. Market Drivers
- 3.2.1. Growing Regulatory Environment in the Industry; Presence of Robust SIS Service Ecosystem
- 3.3. Market Restrains
- 3.3.1. Operational Complexity Coupled with High Maintenance Costs
- 3.4. Market Trends
- 3.4.1. The Chemical and Petrochemical Industry is expected to Hold a Major Market Share
- 4. Market Factor Analysis
- 4.1. Porters Five Forces
- 4.2. Supply/Value Chain
- 4.3. PESTEL analysis
- 4.4. Market Entropy
- 4.5. Patent/Trademark Analysis
- 5. Global Safety Instrumented System Industry Analysis, Insights and Forecast, 2019-2031
- 5.1. Market Analysis, Insights and Forecast - by Application
- 5.1.1. Emergency Shutdown Systems (ESD)
- 5.1.2. Fire and Gas Monitoring and Control (F&GC)
- 5.1.3. High Integrity Pressure Protection Systems (HIPPS)
- 5.1.4. Burner Management Systems (BMS)
- 5.1.5. Turbo Machinery Control
- 5.1.6. Other Applications
- 5.2. Market Analysis, Insights and Forecast - by End User
- 5.2.1. Chemicals and Petrochemicals
- 5.2.2. Power Generation
- 5.2.3. Pharmaceutical
- 5.2.4. Food and Beverage
- 5.2.5. Oil and Gas
- 5.2.6. Other End Users
- 5.3. Market Analysis, Insights and Forecast - by Region
- 5.3.1. North America
- 5.3.2. Europe
- 5.3.3. Asia
- 5.3.4. Australia and New Zealand
- 5.3.5. Latin America
- 5.3.6. Middle East
- 5.3.7. Africa
- 5.1. Market Analysis, Insights and Forecast - by Application
- 6. North America Safety Instrumented System Industry Analysis, Insights and Forecast, 2019-2031
- 6.1. Market Analysis, Insights and Forecast - by Application
- 6.1.1. Emergency Shutdown Systems (ESD)
- 6.1.2. Fire and Gas Monitoring and Control (F&GC)
- 6.1.3. High Integrity Pressure Protection Systems (HIPPS)
- 6.1.4. Burner Management Systems (BMS)
- 6.1.5. Turbo Machinery Control
- 6.1.6. Other Applications
- 6.2. Market Analysis, Insights and Forecast - by End User
- 6.2.1. Chemicals and Petrochemicals
- 6.2.2. Power Generation
- 6.2.3. Pharmaceutical
- 6.2.4. Food and Beverage
- 6.2.5. Oil and Gas
- 6.2.6. Other End Users
- 6.1. Market Analysis, Insights and Forecast - by Application
- 7. Europe Safety Instrumented System Industry Analysis, Insights and Forecast, 2019-2031
- 7.1. Market Analysis, Insights and Forecast - by Application
- 7.1.1. Emergency Shutdown Systems (ESD)
- 7.1.2. Fire and Gas Monitoring and Control (F&GC)
- 7.1.3. High Integrity Pressure Protection Systems (HIPPS)
- 7.1.4. Burner Management Systems (BMS)
- 7.1.5. Turbo Machinery Control
- 7.1.6. Other Applications
- 7.2. Market Analysis, Insights and Forecast - by End User
- 7.2.1. Chemicals and Petrochemicals
- 7.2.2. Power Generation
- 7.2.3. Pharmaceutical
- 7.2.4. Food and Beverage
- 7.2.5. Oil and Gas
- 7.2.6. Other End Users
- 7.1. Market Analysis, Insights and Forecast - by Application
- 8. Asia Safety Instrumented System Industry Analysis, Insights and Forecast, 2019-2031
- 8.1. Market Analysis, Insights and Forecast - by Application
- 8.1.1. Emergency Shutdown Systems (ESD)
- 8.1.2. Fire and Gas Monitoring and Control (F&GC)
- 8.1.3. High Integrity Pressure Protection Systems (HIPPS)
- 8.1.4. Burner Management Systems (BMS)
- 8.1.5. Turbo Machinery Control
- 8.1.6. Other Applications
- 8.2. Market Analysis, Insights and Forecast - by End User
- 8.2.1. Chemicals and Petrochemicals
- 8.2.2. Power Generation
- 8.2.3. Pharmaceutical
- 8.2.4. Food and Beverage
- 8.2.5. Oil and Gas
- 8.2.6. Other End Users
- 8.1. Market Analysis, Insights and Forecast - by Application
- 9. Australia and New Zealand Safety Instrumented System Industry Analysis, Insights and Forecast, 2019-2031
- 9.1. Market Analysis, Insights and Forecast - by Application
- 9.1.1. Emergency Shutdown Systems (ESD)
- 9.1.2. Fire and Gas Monitoring and Control (F&GC)
- 9.1.3. High Integrity Pressure Protection Systems (HIPPS)
- 9.1.4. Burner Management Systems (BMS)
- 9.1.5. Turbo Machinery Control
- 9.1.6. Other Applications
- 9.2. Market Analysis, Insights and Forecast - by End User
- 9.2.1. Chemicals and Petrochemicals
- 9.2.2. Power Generation
- 9.2.3. Pharmaceutical
- 9.2.4. Food and Beverage
- 9.2.5. Oil and Gas
- 9.2.6. Other End Users
- 9.1. Market Analysis, Insights and Forecast - by Application
- 10. Latin America Safety Instrumented System Industry Analysis, Insights and Forecast, 2019-2031
- 10.1. Market Analysis, Insights and Forecast - by Application
- 10.1.1. Emergency Shutdown Systems (ESD)
- 10.1.2. Fire and Gas Monitoring and Control (F&GC)
- 10.1.3. High Integrity Pressure Protection Systems (HIPPS)
- 10.1.4. Burner Management Systems (BMS)
- 10.1.5. Turbo Machinery Control
- 10.1.6. Other Applications
- 10.2. Market Analysis, Insights and Forecast - by End User
- 10.2.1. Chemicals and Petrochemicals
- 10.2.2. Power Generation
- 10.2.3. Pharmaceutical
- 10.2.4. Food and Beverage
- 10.2.5. Oil and Gas
- 10.2.6. Other End Users
- 10.1. Market Analysis, Insights and Forecast - by Application
- 11. Middle East Safety Instrumented System Industry Analysis, Insights and Forecast, 2019-2031
- 11.1. Market Analysis, Insights and Forecast - by Application
- 11.1.1. Emergency Shutdown Systems (ESD)
- 11.1.2. Fire and Gas Monitoring and Control (F&GC)
- 11.1.3. High Integrity Pressure Protection Systems (HIPPS)
- 11.1.4. Burner Management Systems (BMS)
- 11.1.5. Turbo Machinery Control
- 11.1.6. Other Applications
- 11.2. Market Analysis, Insights and Forecast - by End User
- 11.2.1. Chemicals and Petrochemicals
- 11.2.2. Power Generation
- 11.2.3. Pharmaceutical
- 11.2.4. Food and Beverage
- 11.2.5. Oil and Gas
- 11.2.6. Other End Users
- 11.1. Market Analysis, Insights and Forecast - by Application
- 12. Africa Safety Instrumented System Industry Analysis, Insights and Forecast, 2019-2031
- 12.1. Market Analysis, Insights and Forecast - by Application
- 12.1.1. Emergency Shutdown Systems (ESD)
- 12.1.2. Fire and Gas Monitoring and Control (F&GC)
- 12.1.3. High Integrity Pressure Protection Systems (HIPPS)
- 12.1.4. Burner Management Systems (BMS)
- 12.1.5. Turbo Machinery Control
- 12.1.6. Other Applications
- 12.2. Market Analysis, Insights and Forecast - by End User
- 12.2.1. Chemicals and Petrochemicals
- 12.2.2. Power Generation
- 12.2.3. Pharmaceutical
- 12.2.4. Food and Beverage
- 12.2.5. Oil and Gas
- 12.2.6. Other End Users
- 12.1. Market Analysis, Insights and Forecast - by Application
- 13. North America Safety Instrumented System Industry Analysis, Insights and Forecast, 2019-2031
- 13.1. Market Analysis, Insights and Forecast - By Country/Sub-region
- 13.1.1.
- 14. Europe Safety Instrumented System Industry Analysis, Insights and Forecast, 2019-2031
- 14.1. Market Analysis, Insights and Forecast - By Country/Sub-region
- 14.1.1.
- 15. Asia Pacific Safety Instrumented System Industry Analysis, Insights and Forecast, 2019-2031
- 15.1. Market Analysis, Insights and Forecast - By Country/Sub-region
- 15.1.1.
- 16. Latin America Safety Instrumented System Industry Analysis, Insights and Forecast, 2019-2031
- 16.1. Market Analysis, Insights and Forecast - By Country/Sub-region
- 16.1.1.
- 17. Middle East and Africa Safety Instrumented System Industry Analysis, Insights and Forecast, 2019-2031
- 17.1. Market Analysis, Insights and Forecast - By Country/Sub-region
- 17.1.1.
- 18. Competitive Analysis
- 18.1. Global Market Share Analysis 2024
- 18.2. Company Profiles
- 18.2.1 Honeywell International Inc
- 18.2.1.1. Overview
- 18.2.1.2. Products
- 18.2.1.3. SWOT Analysis
- 18.2.1.4. Recent Developments
- 18.2.1.5. Financials (Based on Availability)
- 18.2.2 ABB Ltd
- 18.2.2.1. Overview
- 18.2.2.2. Products
- 18.2.2.3. SWOT Analysis
- 18.2.2.4. Recent Developments
- 18.2.2.5. Financials (Based on Availability)
- 18.2.3 SIS-TECH Solutions LP
- 18.2.3.1. Overview
- 18.2.3.2. Products
- 18.2.3.3. SWOT Analysis
- 18.2.3.4. Recent Developments
- 18.2.3.5. Financials (Based on Availability)
- 18.2.4 Siemens AG
- 18.2.4.1. Overview
- 18.2.4.2. Products
- 18.2.4.3. SWOT Analysis
- 18.2.4.4. Recent Developments
- 18.2.4.5. Financials (Based on Availability)
- 18.2.5 Schneider Electric SE
- 18.2.5.1. Overview
- 18.2.5.2. Products
- 18.2.5.3. SWOT Analysis
- 18.2.5.4. Recent Developments
- 18.2.5.5. Financials (Based on Availability)
- 18.2.6 HIMA Paul Hildebrandt GmbH
- 18.2.6.1. Overview
- 18.2.6.2. Products
- 18.2.6.3. SWOT Analysis
- 18.2.6.4. Recent Developments
- 18.2.6.5. Financials (Based on Availability)
- 18.2.7 Rockwell Automation Inc
- 18.2.7.1. Overview
- 18.2.7.2. Products
- 18.2.7.3. SWOT Analysis
- 18.2.7.4. Recent Developments
- 18.2.7.5. Financials (Based on Availability)
- 18.2.8 Yokogawa Electric Corporation
- 18.2.8.1. Overview
- 18.2.8.2. Products
- 18.2.8.3. SWOT Analysis
- 18.2.8.4. Recent Developments
- 18.2.8.5. Financials (Based on Availability)
- 18.2.9 Schlumberger Limited*List Not Exhaustive
- 18.2.9.1. Overview
- 18.2.9.2. Products
- 18.2.9.3. SWOT Analysis
- 18.2.9.4. Recent Developments
- 18.2.9.5. Financials (Based on Availability)
- 18.2.10 Emerson Electric Company
- 18.2.10.1. Overview
- 18.2.10.2. Products
- 18.2.10.3. SWOT Analysis
- 18.2.10.4. Recent Developments
- 18.2.10.5. Financials (Based on Availability)
- 18.2.1 Honeywell International Inc
List of Figures
- Figure 1: Global Safety Instrumented System Industry Revenue Breakdown (Million, %) by Region 2024 & 2032
- Figure 2: North America Safety Instrumented System Industry Revenue (Million), by Country 2024 & 2032
- Figure 3: North America Safety Instrumented System Industry Revenue Share (%), by Country 2024 & 2032
- Figure 4: Europe Safety Instrumented System Industry Revenue (Million), by Country 2024 & 2032
- Figure 5: Europe Safety Instrumented System Industry Revenue Share (%), by Country 2024 & 2032
- Figure 6: Asia Pacific Safety Instrumented System Industry Revenue (Million), by Country 2024 & 2032
- Figure 7: Asia Pacific Safety Instrumented System Industry Revenue Share (%), by Country 2024 & 2032
- Figure 8: Latin America Safety Instrumented System Industry Revenue (Million), by Country 2024 & 2032
- Figure 9: Latin America Safety Instrumented System Industry Revenue Share (%), by Country 2024 & 2032
- Figure 10: Middle East and Africa Safety Instrumented System Industry Revenue (Million), by Country 2024 & 2032
- Figure 11: Middle East and Africa Safety Instrumented System Industry Revenue Share (%), by Country 2024 & 2032
- Figure 12: North America Safety Instrumented System Industry Revenue (Million), by Application 2024 & 2032
- Figure 13: North America Safety Instrumented System Industry Revenue Share (%), by Application 2024 & 2032
- Figure 14: North America Safety Instrumented System Industry Revenue (Million), by End User 2024 & 2032
- Figure 15: North America Safety Instrumented System Industry Revenue Share (%), by End User 2024 & 2032
- Figure 16: North America Safety Instrumented System Industry Revenue (Million), by Country 2024 & 2032
- Figure 17: North America Safety Instrumented System Industry Revenue Share (%), by Country 2024 & 2032
- Figure 18: Europe Safety Instrumented System Industry Revenue (Million), by Application 2024 & 2032
- Figure 19: Europe Safety Instrumented System Industry Revenue Share (%), by Application 2024 & 2032
- Figure 20: Europe Safety Instrumented System Industry Revenue (Million), by End User 2024 & 2032
- Figure 21: Europe Safety Instrumented System Industry Revenue Share (%), by End User 2024 & 2032
- Figure 22: Europe Safety Instrumented System Industry Revenue (Million), by Country 2024 & 2032
- Figure 23: Europe Safety Instrumented System Industry Revenue Share (%), by Country 2024 & 2032
- Figure 24: Asia Safety Instrumented System Industry Revenue (Million), by Application 2024 & 2032
- Figure 25: Asia Safety Instrumented System Industry Revenue Share (%), by Application 2024 & 2032
- Figure 26: Asia Safety Instrumented System Industry Revenue (Million), by End User 2024 & 2032
- Figure 27: Asia Safety Instrumented System Industry Revenue Share (%), by End User 2024 & 2032
- Figure 28: Asia Safety Instrumented System Industry Revenue (Million), by Country 2024 & 2032
- Figure 29: Asia Safety Instrumented System Industry Revenue Share (%), by Country 2024 & 2032
- Figure 30: Australia and New Zealand Safety Instrumented System Industry Revenue (Million), by Application 2024 & 2032
- Figure 31: Australia and New Zealand Safety Instrumented System Industry Revenue Share (%), by Application 2024 & 2032
- Figure 32: Australia and New Zealand Safety Instrumented System Industry Revenue (Million), by End User 2024 & 2032
- Figure 33: Australia and New Zealand Safety Instrumented System Industry Revenue Share (%), by End User 2024 & 2032
- Figure 34: Australia and New Zealand Safety Instrumented System Industry Revenue (Million), by Country 2024 & 2032
- Figure 35: Australia and New Zealand Safety Instrumented System Industry Revenue Share (%), by Country 2024 & 2032
- Figure 36: Latin America Safety Instrumented System Industry Revenue (Million), by Application 2024 & 2032
- Figure 37: Latin America Safety Instrumented System Industry Revenue Share (%), by Application 2024 & 2032
- Figure 38: Latin America Safety Instrumented System Industry Revenue (Million), by End User 2024 & 2032
- Figure 39: Latin America Safety Instrumented System Industry Revenue Share (%), by End User 2024 & 2032
- Figure 40: Latin America Safety Instrumented System Industry Revenue (Million), by Country 2024 & 2032
- Figure 41: Latin America Safety Instrumented System Industry Revenue Share (%), by Country 2024 & 2032
- Figure 42: Middle East Safety Instrumented System Industry Revenue (Million), by Application 2024 & 2032
- Figure 43: Middle East Safety Instrumented System Industry Revenue Share (%), by Application 2024 & 2032
- Figure 44: Middle East Safety Instrumented System Industry Revenue (Million), by End User 2024 & 2032
- Figure 45: Middle East Safety Instrumented System Industry Revenue Share (%), by End User 2024 & 2032
- Figure 46: Middle East Safety Instrumented System Industry Revenue (Million), by Country 2024 & 2032
- Figure 47: Middle East Safety Instrumented System Industry Revenue Share (%), by Country 2024 & 2032
- Figure 48: Africa Safety Instrumented System Industry Revenue (Million), by Application 2024 & 2032
- Figure 49: Africa Safety Instrumented System Industry Revenue Share (%), by Application 2024 & 2032
- Figure 50: Africa Safety Instrumented System Industry Revenue (Million), by End User 2024 & 2032
- Figure 51: Africa Safety Instrumented System Industry Revenue Share (%), by End User 2024 & 2032
- Figure 52: Africa Safety Instrumented System Industry Revenue (Million), by Country 2024 & 2032
- Figure 53: Africa Safety Instrumented System Industry Revenue Share (%), by Country 2024 & 2032
List of Tables
- Table 1: Global Safety Instrumented System Industry Revenue Million Forecast, by Region 2019 & 2032
- Table 2: Global Safety Instrumented System Industry Revenue Million Forecast, by Application 2019 & 2032
- Table 3: Global Safety Instrumented System Industry Revenue Million Forecast, by End User 2019 & 2032
- Table 4: Global Safety Instrumented System Industry Revenue Million Forecast, by Region 2019 & 2032
- Table 5: Global Safety Instrumented System Industry Revenue Million Forecast, by Country 2019 & 2032
- Table 6: Safety Instrumented System Industry Revenue (Million) Forecast, by Application 2019 & 2032
- Table 7: Global Safety Instrumented System Industry Revenue Million Forecast, by Country 2019 & 2032
- Table 8: Safety Instrumented System Industry Revenue (Million) Forecast, by Application 2019 & 2032
- Table 9: Global Safety Instrumented System Industry Revenue Million Forecast, by Country 2019 & 2032
- Table 10: Safety Instrumented System Industry Revenue (Million) Forecast, by Application 2019 & 2032
- Table 11: Global Safety Instrumented System Industry Revenue Million Forecast, by Country 2019 & 2032
- Table 12: Safety Instrumented System Industry Revenue (Million) Forecast, by Application 2019 & 2032
- Table 13: Global Safety Instrumented System Industry Revenue Million Forecast, by Country 2019 & 2032
- Table 14: Safety Instrumented System Industry Revenue (Million) Forecast, by Application 2019 & 2032
- Table 15: Global Safety Instrumented System Industry Revenue Million Forecast, by Application 2019 & 2032
- Table 16: Global Safety Instrumented System Industry Revenue Million Forecast, by End User 2019 & 2032
- Table 17: Global Safety Instrumented System Industry Revenue Million Forecast, by Country 2019 & 2032
- Table 18: Global Safety Instrumented System Industry Revenue Million Forecast, by Application 2019 & 2032
- Table 19: Global Safety Instrumented System Industry Revenue Million Forecast, by End User 2019 & 2032
- Table 20: Global Safety Instrumented System Industry Revenue Million Forecast, by Country 2019 & 2032
- Table 21: Global Safety Instrumented System Industry Revenue Million Forecast, by Application 2019 & 2032
- Table 22: Global Safety Instrumented System Industry Revenue Million Forecast, by End User 2019 & 2032
- Table 23: Global Safety Instrumented System Industry Revenue Million Forecast, by Country 2019 & 2032
- Table 24: Global Safety Instrumented System Industry Revenue Million Forecast, by Application 2019 & 2032
- Table 25: Global Safety Instrumented System Industry Revenue Million Forecast, by End User 2019 & 2032
- Table 26: Global Safety Instrumented System Industry Revenue Million Forecast, by Country 2019 & 2032
- Table 27: Global Safety Instrumented System Industry Revenue Million Forecast, by Application 2019 & 2032
- Table 28: Global Safety Instrumented System Industry Revenue Million Forecast, by End User 2019 & 2032
- Table 29: Global Safety Instrumented System Industry Revenue Million Forecast, by Country 2019 & 2032
- Table 30: Global Safety Instrumented System Industry Revenue Million Forecast, by Application 2019 & 2032
- Table 31: Global Safety Instrumented System Industry Revenue Million Forecast, by End User 2019 & 2032
- Table 32: Global Safety Instrumented System Industry Revenue Million Forecast, by Country 2019 & 2032
- Table 33: Global Safety Instrumented System Industry Revenue Million Forecast, by Application 2019 & 2032
- Table 34: Global Safety Instrumented System Industry Revenue Million Forecast, by End User 2019 & 2032
- Table 35: Global Safety Instrumented System Industry Revenue Million Forecast, by Country 2019 & 2032
Frequently Asked Questions
1. What is the projected Compound Annual Growth Rate (CAGR) of the Safety Instrumented System Industry?
The projected CAGR is approximately 6.93%.
2. Which companies are prominent players in the Safety Instrumented System Industry?
Key companies in the market include Honeywell International Inc, ABB Ltd, SIS-TECH Solutions LP, Siemens AG, Schneider Electric SE, HIMA Paul Hildebrandt GmbH, Rockwell Automation Inc, Yokogawa Electric Corporation, Schlumberger Limited*List Not Exhaustive, Emerson Electric Company.
3. What are the main segments of the Safety Instrumented System Industry?
The market segments include Application, End User.
4. Can you provide details about the market size?
The market size is estimated to be USD 4.60 Million as of 2022.
5. What are some drivers contributing to market growth?
Growing Regulatory Environment in the Industry; Presence of Robust SIS Service Ecosystem.
6. What are the notable trends driving market growth?
The Chemical and Petrochemical Industry is expected to Hold a Major Market Share.
7. Are there any restraints impacting market growth?
Operational Complexity Coupled with High Maintenance Costs.
8. Can you provide examples of recent developments in the market?
January 2021 - ProSafe-RS Lite, a safety integrity level 2 (SIL2*1) version of the ProSafeTM series safety instrumented system, was recently developed by Yokogawa Electric Corporation.
9. What pricing options are available for accessing the report?
Pricing options include single-user, multi-user, and enterprise licenses priced at USD 4750, USD 5250, and USD 8750 respectively.
10. Is the market size provided in terms of value or volume?
The market size is provided in terms of value, measured in Million.
11. Are there any specific market keywords associated with the report?
Yes, the market keyword associated with the report is "Safety Instrumented System Industry," which aids in identifying and referencing the specific market segment covered.
12. How do I determine which pricing option suits my needs best?
The pricing options vary based on user requirements and access needs. Individual users may opt for single-user licenses, while businesses requiring broader access may choose multi-user or enterprise licenses for cost-effective access to the report.
13. Are there any additional resources or data provided in the Safety Instrumented System Industry report?
While the report offers comprehensive insights, it's advisable to review the specific contents or supplementary materials provided to ascertain if additional resources or data are available.
14. How can I stay updated on further developments or reports in the Safety Instrumented System Industry?
To stay informed about further developments, trends, and reports in the Safety Instrumented System Industry, consider subscribing to industry newsletters, following relevant companies and organizations, or regularly checking reputable industry news sources and publications.
Methodology
Step 1 - Identification of Relevant Samples Size from Population Database


Step 2 - Approaches for Defining Global Market Size (Value, Volume* & Price*)

Note*: In applicable scenarios
Step 3 - Data Sources
Primary Research
- Web Analytics
- Survey Reports
- Research Institute
- Latest Research Reports
- Opinion Leaders
Secondary Research
- Annual Reports
- White Paper
- Latest Press Release
- Industry Association
- Paid Database
- Investor Presentations

Step 4 - Data Triangulation
Involves using different sources of information in order to increase the validity of a study
These sources are likely to be stakeholders in a program - participants, other researchers, program staff, other community members, and so on.
Then we put all data in single framework & apply various statistical tools to find out the dynamic on the market.
During the analysis stage, feedback from the stakeholder groups would be compared to determine areas of agreement as well as areas of divergence
