

Key Insights
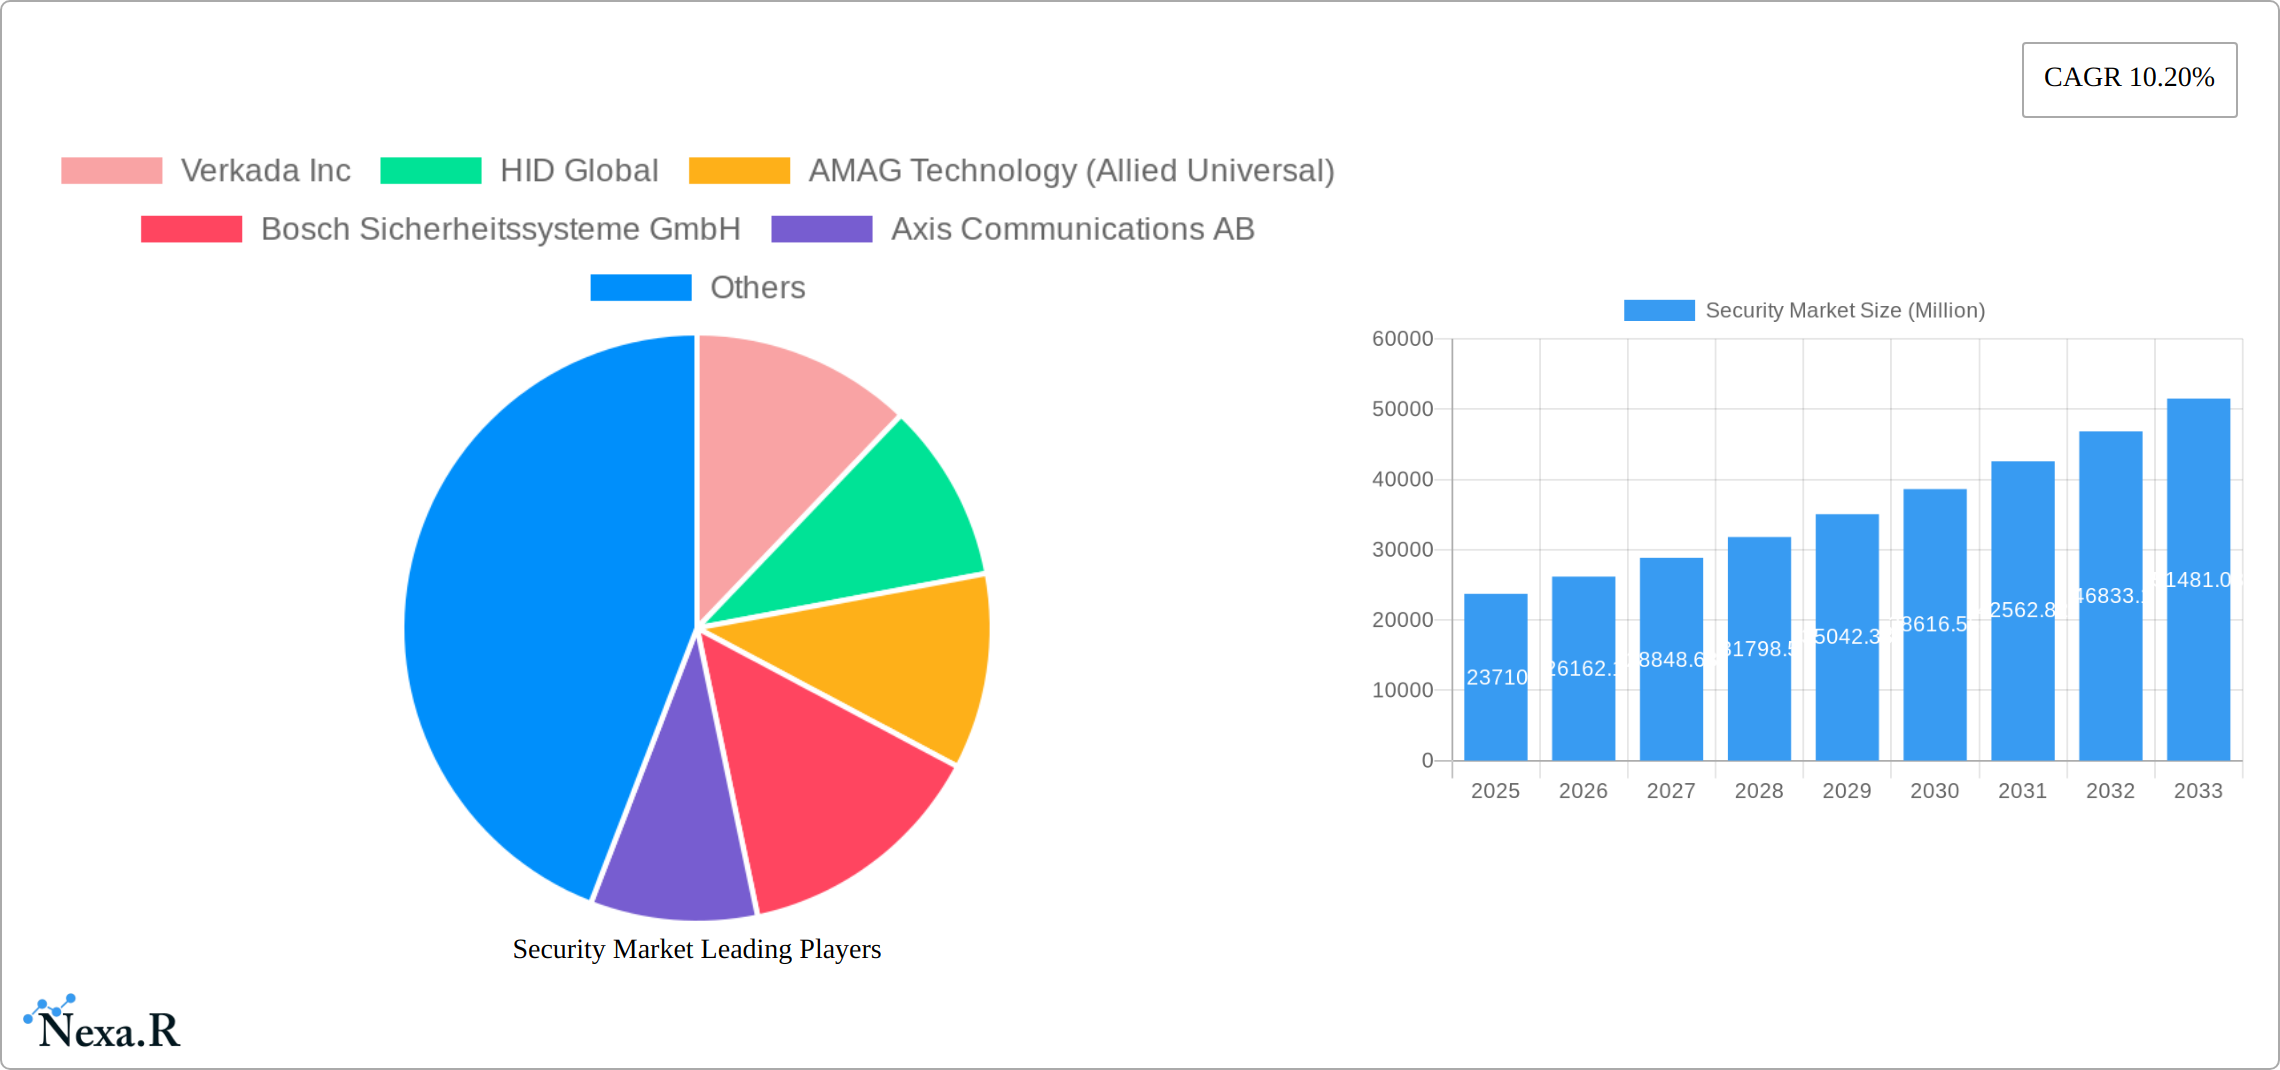
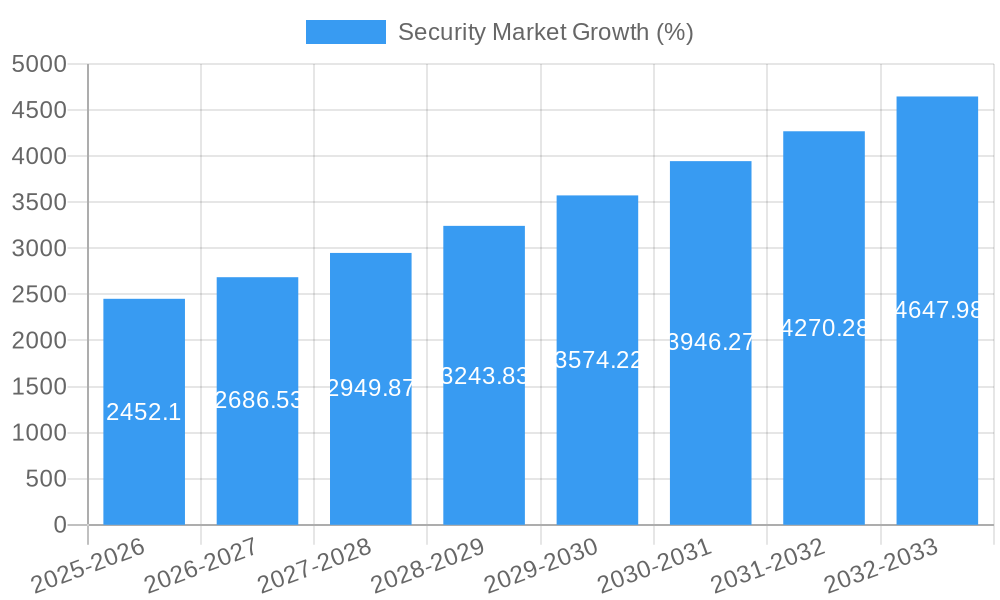
The global security market, valued at $23.71 billion in 2025, is projected to experience robust growth, driven by a compound annual growth rate (CAGR) of 10.20% from 2025 to 2033. This expansion is fueled by several key factors. Increasing cyber threats and the rising adoption of cloud-based security solutions are major drivers. Furthermore, the growing need for robust physical security measures across various sectors, including government, healthcare, and finance, significantly contributes to market growth. Government initiatives promoting cybersecurity and stricter data privacy regulations also incentivize businesses to invest heavily in advanced security systems. The market is witnessing a shift towards integrated security solutions, combining physical and cybersecurity measures for comprehensive protection. This trend reflects a move towards proactive risk management rather than reactive incident response. Technological advancements, such as artificial intelligence (AI) and machine learning (ML) in security analytics, are enhancing threat detection and response capabilities, further boosting market growth.
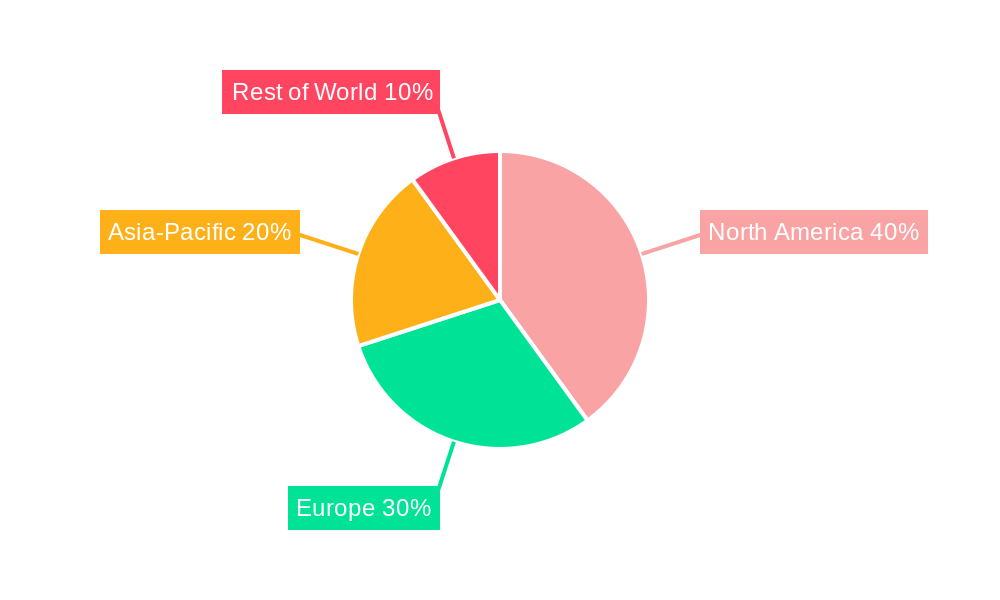
Competition in the security market is intense, with key players like Verkada Inc, HID Global, AMAG Technology, and Bosch Sicherheitssysteme GmbH vying for market share. These established companies are constantly innovating and expanding their product portfolios to meet evolving customer demands. The market also sees the emergence of specialized cybersecurity firms focusing on cloud security, endpoint protection, and threat intelligence. The market is segmented by product type (hardware, software, services), deployment type (cloud, on-premise), end-user industry (BFSI, government, healthcare, etc.), and geography. While North America and Europe currently dominate the market, significant growth potential exists in the Asia-Pacific region due to rapid urbanization and economic expansion. The restraints on market growth include high initial investment costs for advanced security systems, the complexity of integrating multiple security solutions, and the persistent challenge of skilled cybersecurity personnel shortage.
Security Market: A Comprehensive Market Report (2019-2033)
This in-depth report provides a comprehensive analysis of the Security Market, encompassing market dynamics, growth trends, regional dominance, product landscape, key players, and future outlook. With a focus on the parent market of security and its child markets (e.g., physical security, cybersecurity), this report offers invaluable insights for industry professionals, investors, and strategic decision-makers. The study period covers 2019-2033, with 2025 as the base year and forecast period spanning 2025-2033.
Security Market Dynamics & Structure
The global Security Market, valued at xx Million in 2024, exhibits a moderately concentrated structure with several key players holding significant market share. Technological innovation, particularly in AI, IoT, and cloud-based solutions, is a primary growth driver. Stringent government regulations surrounding data privacy and cybersecurity are shaping market practices. The market also faces competition from substitute technologies and evolving end-user needs. Mergers and acquisitions (M&A) activity is moderately high, indicating consolidation within the sector.
- Market Concentration: High (Top 5 players hold xx% market share).
- Technological Innovation: AI-driven security, IoT integration, cloud-based security solutions.
- Regulatory Framework: GDPR, CCPA, NIS2 impacting data security practices.
- Competitive Substitutes: Traditional security systems, alternative authentication methods.
- End-User Demographics: Growing adoption across various sectors (government, commercial, residential).
- M&A Trends: xx M&A deals recorded in the past 5 years, with an average deal value of xx Million. Consolidation driven by technological advancement and market expansion.
Security Market Growth Trends & Insights
The Security Market has experienced consistent growth over the historical period (2019-2024), with a CAGR of xx%. This growth is attributed to increasing cyber threats, rising awareness of physical security vulnerabilities, and the adoption of advanced security technologies across various sectors. Market penetration of smart security systems is steadily increasing, driven by technological advancements, affordability, and consumer preference for convenience. Technological disruptions, such as the rise of AI and IoT, are reshaping the market landscape, creating opportunities for innovation and market expansion. The market size is projected to reach xx Million by 2033, indicating sustained growth in the forecast period (2025-2033). Consumer behavior is shifting toward integrated security systems, preference for remote monitoring capabilities, and higher demand for user-friendly interfaces.
Dominant Regions, Countries, or Segments in Security Market
North America currently holds the largest market share in the Security Market, driven by high technological adoption, robust IT infrastructure, and strong government regulations. Europe follows closely, influenced by stringent data protection laws and a growing focus on cybersecurity. Asia-Pacific is witnessing rapid growth due to increasing urbanization, rising disposable incomes, and government investments in infrastructure security. Within segments, cybersecurity solutions are experiencing the fastest growth, followed by physical security systems.
- North America: Strong regulatory environment, high technological adoption, and substantial investments in security infrastructure.
- Europe: Stringent data protection laws (GDPR), leading to high demand for advanced security solutions.
- Asia-Pacific: Rapid urbanization, rising disposable incomes, and government initiatives fostering security market expansion.
- Growth Potential: Asia-Pacific shows highest growth potential, while North America and Europe represent mature markets.
Security Market Product Landscape
The Security Market offers a wide range of products, including physical security systems (access control, video surveillance, intrusion detection), cybersecurity solutions (network security, endpoint protection, data loss prevention), and integrated security systems combining both. Recent innovations focus on AI-powered analytics for threat detection, IoT-enabled devices for remote monitoring, and cloud-based solutions for centralized management. Key selling propositions include improved ease of use, enhanced security features, and cost-effectiveness.
Key Drivers, Barriers & Challenges in Security Market
Key Drivers:
- Increasing cyber threats and data breaches.
- Growing adoption of IoT devices creating larger attack surfaces.
- Stringent government regulations promoting security investments.
- Rising demand for integrated security solutions.
Key Challenges:
- High initial investment costs for advanced security technologies.
- Complexity in integrating various security systems.
- Shortage of skilled cybersecurity professionals.
- Concerns regarding data privacy and compliance.
Emerging Opportunities in Security Market
- Growing adoption of AI and machine learning in security analytics.
- Expansion of cloud-based security solutions.
- Increasing demand for security solutions in emerging markets.
- Integration of security with other technologies (e.g., building automation systems).
Growth Accelerators in the Security Market Industry
Strategic partnerships, mergers and acquisitions, and technological breakthroughs in AI and IoT are key catalysts driving long-term growth. Expansion into new markets and development of innovative security solutions are further accelerating market expansion. The increasing demand for managed security services is also contributing to market growth.
Key Players Shaping the Security Market Market
- Verkada Inc
- HID Global
- AMAG Technology (Allied Universal)
- Bosch Sicherheitssysteme GmbH
- Axis Communications AB
- Honeywell International Inc
- Johnson Controls
- ADT Inc
- Securitas Technology
- Assa Abloy Group
- Genetec Inc
- Palo Alto Networks
- Fortinet Inc
- IBM Corporation
- Cisco Systems Inc
Notable Milestones in Security Market Sector
- August 2024: Alfred International launches the Alfred ML2 Smart Mortise Lock, expanding the smart lock market and offering retrofitting options.
- May 2024: Palo Alto Networks and IBM partner to deliver AI-driven security solutions, enhancing threat detection and response capabilities.
In-Depth Security Market Market Outlook
The Security Market is poised for continued growth, driven by technological advancements, increasing cyber threats, and growing awareness of security vulnerabilities. Strategic partnerships and innovations in AI and IoT will create significant opportunities for market expansion and the development of innovative security solutions. The market's future potential is substantial, particularly in emerging markets and segments like cybersecurity and cloud-based security.
Security Market Segmentation
-
1. Security Type
-
1.1. Physical Security
- 1.1.1. Access Control
- 1.1.2. Video Surveillance
- 1.1.3. Intrusion Detection
- 1.1.4. Perimeter Security
-
1.2. Cyber Security
- 1.2.1. Network Security
- 1.2.2. End Point Security
- 1.2.3. Application Security
- 1.2.4. Cloud Security
- 1.2.5. Information Security
-
1.1. Physical Security
-
2. End-user Vertical
- 2.1. Government and Public Sector
- 2.2. Commercial
- 2.3. Industrial
- 2.4. Residential
- 2.5. Healthcare
- 2.6. Education
- 2.7. Critical Infrastructure
-
3. Solution Type
- 3.1. Hardware
- 3.2. Software
- 3.3. Services
-
4. Deployment Type
- 4.1. On-premise
- 4.2. Cloud-based
Security Market Segmentation By Geography
- 1. North America
- 2. Europe
- 3. Asia
- 4. Australia and New Zealand
- 5. Latin America
- 6. Middle East and Africa
Security Market REPORT HIGHLIGHTS
| Aspects | Details |
|---|---|
| Study Period | 2019-2033 |
| Base Year | 2024 |
| Estimated Year | 2025 |
| Forecast Period | 2025-2033 |
| Historical Period | 2019-2024 |
| Growth Rate | CAGR of 10.20% from 2019-2033 |
| Segmentation |
|
Table of Contents
- 1. Introduction
- 1.1. Research Scope
- 1.2. Market Segmentation
- 1.3. Research Methodology
- 1.4. Definitions and Assumptions
- 2. Executive Summary
- 2.1. Introduction
- 3. Market Dynamics
- 3.1. Introduction
- 3.2. Market Drivers
- 3.2.1. Increasing Cyber Threats; Growth in IoT Devices
- 3.3. Market Restrains
- 3.3.1. Increasing Cyber Threats; Growth in IoT Devices
- 3.4. Market Trends
- 3.4.1. Commercial Sector Witnessing Demand
- 4. Market Factor Analysis
- 4.1. Porters Five Forces
- 4.2. Supply/Value Chain
- 4.3. PESTEL analysis
- 4.4. Market Entropy
- 4.5. Patent/Trademark Analysis
- 5. Global Security Market Analysis, Insights and Forecast, 2019-2031
- 5.1. Market Analysis, Insights and Forecast - by Security Type
- 5.1.1. Physical Security
- 5.1.1.1. Access Control
- 5.1.1.2. Video Surveillance
- 5.1.1.3. Intrusion Detection
- 5.1.1.4. Perimeter Security
- 5.1.2. Cyber Security
- 5.1.2.1. Network Security
- 5.1.2.2. End Point Security
- 5.1.2.3. Application Security
- 5.1.2.4. Cloud Security
- 5.1.2.5. Information Security
- 5.1.1. Physical Security
- 5.2. Market Analysis, Insights and Forecast - by End-user Vertical
- 5.2.1. Government and Public Sector
- 5.2.2. Commercial
- 5.2.3. Industrial
- 5.2.4. Residential
- 5.2.5. Healthcare
- 5.2.6. Education
- 5.2.7. Critical Infrastructure
- 5.3. Market Analysis, Insights and Forecast - by Solution Type
- 5.3.1. Hardware
- 5.3.2. Software
- 5.3.3. Services
- 5.4. Market Analysis, Insights and Forecast - by Deployment Type
- 5.4.1. On-premise
- 5.4.2. Cloud-based
- 5.5. Market Analysis, Insights and Forecast - by Region
- 5.5.1. North America
- 5.5.2. Europe
- 5.5.3. Asia
- 5.5.4. Australia and New Zealand
- 5.5.5. Latin America
- 5.5.6. Middle East and Africa
- 5.1. Market Analysis, Insights and Forecast - by Security Type
- 6. North America Security Market Analysis, Insights and Forecast, 2019-2031
- 6.1. Market Analysis, Insights and Forecast - by Security Type
- 6.1.1. Physical Security
- 6.1.1.1. Access Control
- 6.1.1.2. Video Surveillance
- 6.1.1.3. Intrusion Detection
- 6.1.1.4. Perimeter Security
- 6.1.2. Cyber Security
- 6.1.2.1. Network Security
- 6.1.2.2. End Point Security
- 6.1.2.3. Application Security
- 6.1.2.4. Cloud Security
- 6.1.2.5. Information Security
- 6.1.1. Physical Security
- 6.2. Market Analysis, Insights and Forecast - by End-user Vertical
- 6.2.1. Government and Public Sector
- 6.2.2. Commercial
- 6.2.3. Industrial
- 6.2.4. Residential
- 6.2.5. Healthcare
- 6.2.6. Education
- 6.2.7. Critical Infrastructure
- 6.3. Market Analysis, Insights and Forecast - by Solution Type
- 6.3.1. Hardware
- 6.3.2. Software
- 6.3.3. Services
- 6.4. Market Analysis, Insights and Forecast - by Deployment Type
- 6.4.1. On-premise
- 6.4.2. Cloud-based
- 6.1. Market Analysis, Insights and Forecast - by Security Type
- 7. Europe Security Market Analysis, Insights and Forecast, 2019-2031
- 7.1. Market Analysis, Insights and Forecast - by Security Type
- 7.1.1. Physical Security
- 7.1.1.1. Access Control
- 7.1.1.2. Video Surveillance
- 7.1.1.3. Intrusion Detection
- 7.1.1.4. Perimeter Security
- 7.1.2. Cyber Security
- 7.1.2.1. Network Security
- 7.1.2.2. End Point Security
- 7.1.2.3. Application Security
- 7.1.2.4. Cloud Security
- 7.1.2.5. Information Security
- 7.1.1. Physical Security
- 7.2. Market Analysis, Insights and Forecast - by End-user Vertical
- 7.2.1. Government and Public Sector
- 7.2.2. Commercial
- 7.2.3. Industrial
- 7.2.4. Residential
- 7.2.5. Healthcare
- 7.2.6. Education
- 7.2.7. Critical Infrastructure
- 7.3. Market Analysis, Insights and Forecast - by Solution Type
- 7.3.1. Hardware
- 7.3.2. Software
- 7.3.3. Services
- 7.4. Market Analysis, Insights and Forecast - by Deployment Type
- 7.4.1. On-premise
- 7.4.2. Cloud-based
- 7.1. Market Analysis, Insights and Forecast - by Security Type
- 8. Asia Security Market Analysis, Insights and Forecast, 2019-2031
- 8.1. Market Analysis, Insights and Forecast - by Security Type
- 8.1.1. Physical Security
- 8.1.1.1. Access Control
- 8.1.1.2. Video Surveillance
- 8.1.1.3. Intrusion Detection
- 8.1.1.4. Perimeter Security
- 8.1.2. Cyber Security
- 8.1.2.1. Network Security
- 8.1.2.2. End Point Security
- 8.1.2.3. Application Security
- 8.1.2.4. Cloud Security
- 8.1.2.5. Information Security
- 8.1.1. Physical Security
- 8.2. Market Analysis, Insights and Forecast - by End-user Vertical
- 8.2.1. Government and Public Sector
- 8.2.2. Commercial
- 8.2.3. Industrial
- 8.2.4. Residential
- 8.2.5. Healthcare
- 8.2.6. Education
- 8.2.7. Critical Infrastructure
- 8.3. Market Analysis, Insights and Forecast - by Solution Type
- 8.3.1. Hardware
- 8.3.2. Software
- 8.3.3. Services
- 8.4. Market Analysis, Insights and Forecast - by Deployment Type
- 8.4.1. On-premise
- 8.4.2. Cloud-based
- 8.1. Market Analysis, Insights and Forecast - by Security Type
- 9. Australia and New Zealand Security Market Analysis, Insights and Forecast, 2019-2031
- 9.1. Market Analysis, Insights and Forecast - by Security Type
- 9.1.1. Physical Security
- 9.1.1.1. Access Control
- 9.1.1.2. Video Surveillance
- 9.1.1.3. Intrusion Detection
- 9.1.1.4. Perimeter Security
- 9.1.2. Cyber Security
- 9.1.2.1. Network Security
- 9.1.2.2. End Point Security
- 9.1.2.3. Application Security
- 9.1.2.4. Cloud Security
- 9.1.2.5. Information Security
- 9.1.1. Physical Security
- 9.2. Market Analysis, Insights and Forecast - by End-user Vertical
- 9.2.1. Government and Public Sector
- 9.2.2. Commercial
- 9.2.3. Industrial
- 9.2.4. Residential
- 9.2.5. Healthcare
- 9.2.6. Education
- 9.2.7. Critical Infrastructure
- 9.3. Market Analysis, Insights and Forecast - by Solution Type
- 9.3.1. Hardware
- 9.3.2. Software
- 9.3.3. Services
- 9.4. Market Analysis, Insights and Forecast - by Deployment Type
- 9.4.1. On-premise
- 9.4.2. Cloud-based
- 9.1. Market Analysis, Insights and Forecast - by Security Type
- 10. Latin America Security Market Analysis, Insights and Forecast, 2019-2031
- 10.1. Market Analysis, Insights and Forecast - by Security Type
- 10.1.1. Physical Security
- 10.1.1.1. Access Control
- 10.1.1.2. Video Surveillance
- 10.1.1.3. Intrusion Detection
- 10.1.1.4. Perimeter Security
- 10.1.2. Cyber Security
- 10.1.2.1. Network Security
- 10.1.2.2. End Point Security
- 10.1.2.3. Application Security
- 10.1.2.4. Cloud Security
- 10.1.2.5. Information Security
- 10.1.1. Physical Security
- 10.2. Market Analysis, Insights and Forecast - by End-user Vertical
- 10.2.1. Government and Public Sector
- 10.2.2. Commercial
- 10.2.3. Industrial
- 10.2.4. Residential
- 10.2.5. Healthcare
- 10.2.6. Education
- 10.2.7. Critical Infrastructure
- 10.3. Market Analysis, Insights and Forecast - by Solution Type
- 10.3.1. Hardware
- 10.3.2. Software
- 10.3.3. Services
- 10.4. Market Analysis, Insights and Forecast - by Deployment Type
- 10.4.1. On-premise
- 10.4.2. Cloud-based
- 10.1. Market Analysis, Insights and Forecast - by Security Type
- 11. Middle East and Africa Security Market Analysis, Insights and Forecast, 2019-2031
- 11.1. Market Analysis, Insights and Forecast - by Security Type
- 11.1.1. Physical Security
- 11.1.1.1. Access Control
- 11.1.1.2. Video Surveillance
- 11.1.1.3. Intrusion Detection
- 11.1.1.4. Perimeter Security
- 11.1.2. Cyber Security
- 11.1.2.1. Network Security
- 11.1.2.2. End Point Security
- 11.1.2.3. Application Security
- 11.1.2.4. Cloud Security
- 11.1.2.5. Information Security
- 11.1.1. Physical Security
- 11.2. Market Analysis, Insights and Forecast - by End-user Vertical
- 11.2.1. Government and Public Sector
- 11.2.2. Commercial
- 11.2.3. Industrial
- 11.2.4. Residential
- 11.2.5. Healthcare
- 11.2.6. Education
- 11.2.7. Critical Infrastructure
- 11.3. Market Analysis, Insights and Forecast - by Solution Type
- 11.3.1. Hardware
- 11.3.2. Software
- 11.3.3. Services
- 11.4. Market Analysis, Insights and Forecast - by Deployment Type
- 11.4.1. On-premise
- 11.4.2. Cloud-based
- 11.1. Market Analysis, Insights and Forecast - by Security Type
- 12. Competitive Analysis
- 12.1. Global Market Share Analysis 2024
- 12.2. Company Profiles
- 12.2.1 Verkada Inc
- 12.2.1.1. Overview
- 12.2.1.2. Products
- 12.2.1.3. SWOT Analysis
- 12.2.1.4. Recent Developments
- 12.2.1.5. Financials (Based on Availability)
- 12.2.2 HID Global
- 12.2.2.1. Overview
- 12.2.2.2. Products
- 12.2.2.3. SWOT Analysis
- 12.2.2.4. Recent Developments
- 12.2.2.5. Financials (Based on Availability)
- 12.2.3 AMAG Technology (Allied Universal)
- 12.2.3.1. Overview
- 12.2.3.2. Products
- 12.2.3.3. SWOT Analysis
- 12.2.3.4. Recent Developments
- 12.2.3.5. Financials (Based on Availability)
- 12.2.4 Bosch Sicherheitssysteme GmbH
- 12.2.4.1. Overview
- 12.2.4.2. Products
- 12.2.4.3. SWOT Analysis
- 12.2.4.4. Recent Developments
- 12.2.4.5. Financials (Based on Availability)
- 12.2.5 Axis Communications AB
- 12.2.5.1. Overview
- 12.2.5.2. Products
- 12.2.5.3. SWOT Analysis
- 12.2.5.4. Recent Developments
- 12.2.5.5. Financials (Based on Availability)
- 12.2.6 Honeywell International Inc
- 12.2.6.1. Overview
- 12.2.6.2. Products
- 12.2.6.3. SWOT Analysis
- 12.2.6.4. Recent Developments
- 12.2.6.5. Financials (Based on Availability)
- 12.2.7 Johnson Controls
- 12.2.7.1. Overview
- 12.2.7.2. Products
- 12.2.7.3. SWOT Analysis
- 12.2.7.4. Recent Developments
- 12.2.7.5. Financials (Based on Availability)
- 12.2.8 ADT Inc
- 12.2.8.1. Overview
- 12.2.8.2. Products
- 12.2.8.3. SWOT Analysis
- 12.2.8.4. Recent Developments
- 12.2.8.5. Financials (Based on Availability)
- 12.2.9 Securitas Technology
- 12.2.9.1. Overview
- 12.2.9.2. Products
- 12.2.9.3. SWOT Analysis
- 12.2.9.4. Recent Developments
- 12.2.9.5. Financials (Based on Availability)
- 12.2.10 Assa Abloy Group
- 12.2.10.1. Overview
- 12.2.10.2. Products
- 12.2.10.3. SWOT Analysis
- 12.2.10.4. Recent Developments
- 12.2.10.5. Financials (Based on Availability)
- 12.2.11 Genetec Inc
- 12.2.11.1. Overview
- 12.2.11.2. Products
- 12.2.11.3. SWOT Analysis
- 12.2.11.4. Recent Developments
- 12.2.11.5. Financials (Based on Availability)
- 12.2.12 Palo Alto Networks
- 12.2.12.1. Overview
- 12.2.12.2. Products
- 12.2.12.3. SWOT Analysis
- 12.2.12.4. Recent Developments
- 12.2.12.5. Financials (Based on Availability)
- 12.2.13 Fortinet Inc
- 12.2.13.1. Overview
- 12.2.13.2. Products
- 12.2.13.3. SWOT Analysis
- 12.2.13.4. Recent Developments
- 12.2.13.5. Financials (Based on Availability)
- 12.2.14 IBM Corporation
- 12.2.14.1. Overview
- 12.2.14.2. Products
- 12.2.14.3. SWOT Analysis
- 12.2.14.4. Recent Developments
- 12.2.14.5. Financials (Based on Availability)
- 12.2.15 Cisco Systems Inc
- 12.2.15.1. Overview
- 12.2.15.2. Products
- 12.2.15.3. SWOT Analysis
- 12.2.15.4. Recent Developments
- 12.2.15.5. Financials (Based on Availability)
- 12.2.1 Verkada Inc
List of Figures
- Figure 1: Global Security Market Revenue Breakdown (Million, %) by Region 2024 & 2032
- Figure 2: Global Security Market Volume Breakdown (Billion, %) by Region 2024 & 2032
- Figure 3: North America Security Market Revenue (Million), by Security Type 2024 & 2032
- Figure 4: North America Security Market Volume (Billion), by Security Type 2024 & 2032
- Figure 5: North America Security Market Revenue Share (%), by Security Type 2024 & 2032
- Figure 6: North America Security Market Volume Share (%), by Security Type 2024 & 2032
- Figure 7: North America Security Market Revenue (Million), by End-user Vertical 2024 & 2032
- Figure 8: North America Security Market Volume (Billion), by End-user Vertical 2024 & 2032
- Figure 9: North America Security Market Revenue Share (%), by End-user Vertical 2024 & 2032
- Figure 10: North America Security Market Volume Share (%), by End-user Vertical 2024 & 2032
- Figure 11: North America Security Market Revenue (Million), by Solution Type 2024 & 2032
- Figure 12: North America Security Market Volume (Billion), by Solution Type 2024 & 2032
- Figure 13: North America Security Market Revenue Share (%), by Solution Type 2024 & 2032
- Figure 14: North America Security Market Volume Share (%), by Solution Type 2024 & 2032
- Figure 15: North America Security Market Revenue (Million), by Deployment Type 2024 & 2032
- Figure 16: North America Security Market Volume (Billion), by Deployment Type 2024 & 2032
- Figure 17: North America Security Market Revenue Share (%), by Deployment Type 2024 & 2032
- Figure 18: North America Security Market Volume Share (%), by Deployment Type 2024 & 2032
- Figure 19: North America Security Market Revenue (Million), by Country 2024 & 2032
- Figure 20: North America Security Market Volume (Billion), by Country 2024 & 2032
- Figure 21: North America Security Market Revenue Share (%), by Country 2024 & 2032
- Figure 22: North America Security Market Volume Share (%), by Country 2024 & 2032
- Figure 23: Europe Security Market Revenue (Million), by Security Type 2024 & 2032
- Figure 24: Europe Security Market Volume (Billion), by Security Type 2024 & 2032
- Figure 25: Europe Security Market Revenue Share (%), by Security Type 2024 & 2032
- Figure 26: Europe Security Market Volume Share (%), by Security Type 2024 & 2032
- Figure 27: Europe Security Market Revenue (Million), by End-user Vertical 2024 & 2032
- Figure 28: Europe Security Market Volume (Billion), by End-user Vertical 2024 & 2032
- Figure 29: Europe Security Market Revenue Share (%), by End-user Vertical 2024 & 2032
- Figure 30: Europe Security Market Volume Share (%), by End-user Vertical 2024 & 2032
- Figure 31: Europe Security Market Revenue (Million), by Solution Type 2024 & 2032
- Figure 32: Europe Security Market Volume (Billion), by Solution Type 2024 & 2032
- Figure 33: Europe Security Market Revenue Share (%), by Solution Type 2024 & 2032
- Figure 34: Europe Security Market Volume Share (%), by Solution Type 2024 & 2032
- Figure 35: Europe Security Market Revenue (Million), by Deployment Type 2024 & 2032
- Figure 36: Europe Security Market Volume (Billion), by Deployment Type 2024 & 2032
- Figure 37: Europe Security Market Revenue Share (%), by Deployment Type 2024 & 2032
- Figure 38: Europe Security Market Volume Share (%), by Deployment Type 2024 & 2032
- Figure 39: Europe Security Market Revenue (Million), by Country 2024 & 2032
- Figure 40: Europe Security Market Volume (Billion), by Country 2024 & 2032
- Figure 41: Europe Security Market Revenue Share (%), by Country 2024 & 2032
- Figure 42: Europe Security Market Volume Share (%), by Country 2024 & 2032
- Figure 43: Asia Security Market Revenue (Million), by Security Type 2024 & 2032
- Figure 44: Asia Security Market Volume (Billion), by Security Type 2024 & 2032
- Figure 45: Asia Security Market Revenue Share (%), by Security Type 2024 & 2032
- Figure 46: Asia Security Market Volume Share (%), by Security Type 2024 & 2032
- Figure 47: Asia Security Market Revenue (Million), by End-user Vertical 2024 & 2032
- Figure 48: Asia Security Market Volume (Billion), by End-user Vertical 2024 & 2032
- Figure 49: Asia Security Market Revenue Share (%), by End-user Vertical 2024 & 2032
- Figure 50: Asia Security Market Volume Share (%), by End-user Vertical 2024 & 2032
- Figure 51: Asia Security Market Revenue (Million), by Solution Type 2024 & 2032
- Figure 52: Asia Security Market Volume (Billion), by Solution Type 2024 & 2032
- Figure 53: Asia Security Market Revenue Share (%), by Solution Type 2024 & 2032
- Figure 54: Asia Security Market Volume Share (%), by Solution Type 2024 & 2032
- Figure 55: Asia Security Market Revenue (Million), by Deployment Type 2024 & 2032
- Figure 56: Asia Security Market Volume (Billion), by Deployment Type 2024 & 2032
- Figure 57: Asia Security Market Revenue Share (%), by Deployment Type 2024 & 2032
- Figure 58: Asia Security Market Volume Share (%), by Deployment Type 2024 & 2032
- Figure 59: Asia Security Market Revenue (Million), by Country 2024 & 2032
- Figure 60: Asia Security Market Volume (Billion), by Country 2024 & 2032
- Figure 61: Asia Security Market Revenue Share (%), by Country 2024 & 2032
- Figure 62: Asia Security Market Volume Share (%), by Country 2024 & 2032
- Figure 63: Australia and New Zealand Security Market Revenue (Million), by Security Type 2024 & 2032
- Figure 64: Australia and New Zealand Security Market Volume (Billion), by Security Type 2024 & 2032
- Figure 65: Australia and New Zealand Security Market Revenue Share (%), by Security Type 2024 & 2032
- Figure 66: Australia and New Zealand Security Market Volume Share (%), by Security Type 2024 & 2032
- Figure 67: Australia and New Zealand Security Market Revenue (Million), by End-user Vertical 2024 & 2032
- Figure 68: Australia and New Zealand Security Market Volume (Billion), by End-user Vertical 2024 & 2032
- Figure 69: Australia and New Zealand Security Market Revenue Share (%), by End-user Vertical 2024 & 2032
- Figure 70: Australia and New Zealand Security Market Volume Share (%), by End-user Vertical 2024 & 2032
- Figure 71: Australia and New Zealand Security Market Revenue (Million), by Solution Type 2024 & 2032
- Figure 72: Australia and New Zealand Security Market Volume (Billion), by Solution Type 2024 & 2032
- Figure 73: Australia and New Zealand Security Market Revenue Share (%), by Solution Type 2024 & 2032
- Figure 74: Australia and New Zealand Security Market Volume Share (%), by Solution Type 2024 & 2032
- Figure 75: Australia and New Zealand Security Market Revenue (Million), by Deployment Type 2024 & 2032
- Figure 76: Australia and New Zealand Security Market Volume (Billion), by Deployment Type 2024 & 2032
- Figure 77: Australia and New Zealand Security Market Revenue Share (%), by Deployment Type 2024 & 2032
- Figure 78: Australia and New Zealand Security Market Volume Share (%), by Deployment Type 2024 & 2032
- Figure 79: Australia and New Zealand Security Market Revenue (Million), by Country 2024 & 2032
- Figure 80: Australia and New Zealand Security Market Volume (Billion), by Country 2024 & 2032
- Figure 81: Australia and New Zealand Security Market Revenue Share (%), by Country 2024 & 2032
- Figure 82: Australia and New Zealand Security Market Volume Share (%), by Country 2024 & 2032
- Figure 83: Latin America Security Market Revenue (Million), by Security Type 2024 & 2032
- Figure 84: Latin America Security Market Volume (Billion), by Security Type 2024 & 2032
- Figure 85: Latin America Security Market Revenue Share (%), by Security Type 2024 & 2032
- Figure 86: Latin America Security Market Volume Share (%), by Security Type 2024 & 2032
- Figure 87: Latin America Security Market Revenue (Million), by End-user Vertical 2024 & 2032
- Figure 88: Latin America Security Market Volume (Billion), by End-user Vertical 2024 & 2032
- Figure 89: Latin America Security Market Revenue Share (%), by End-user Vertical 2024 & 2032
- Figure 90: Latin America Security Market Volume Share (%), by End-user Vertical 2024 & 2032
- Figure 91: Latin America Security Market Revenue (Million), by Solution Type 2024 & 2032
- Figure 92: Latin America Security Market Volume (Billion), by Solution Type 2024 & 2032
- Figure 93: Latin America Security Market Revenue Share (%), by Solution Type 2024 & 2032
- Figure 94: Latin America Security Market Volume Share (%), by Solution Type 2024 & 2032
- Figure 95: Latin America Security Market Revenue (Million), by Deployment Type 2024 & 2032
- Figure 96: Latin America Security Market Volume (Billion), by Deployment Type 2024 & 2032
- Figure 97: Latin America Security Market Revenue Share (%), by Deployment Type 2024 & 2032
- Figure 98: Latin America Security Market Volume Share (%), by Deployment Type 2024 & 2032
- Figure 99: Latin America Security Market Revenue (Million), by Country 2024 & 2032
- Figure 100: Latin America Security Market Volume (Billion), by Country 2024 & 2032
- Figure 101: Latin America Security Market Revenue Share (%), by Country 2024 & 2032
- Figure 102: Latin America Security Market Volume Share (%), by Country 2024 & 2032
- Figure 103: Middle East and Africa Security Market Revenue (Million), by Security Type 2024 & 2032
- Figure 104: Middle East and Africa Security Market Volume (Billion), by Security Type 2024 & 2032
- Figure 105: Middle East and Africa Security Market Revenue Share (%), by Security Type 2024 & 2032
- Figure 106: Middle East and Africa Security Market Volume Share (%), by Security Type 2024 & 2032
- Figure 107: Middle East and Africa Security Market Revenue (Million), by End-user Vertical 2024 & 2032
- Figure 108: Middle East and Africa Security Market Volume (Billion), by End-user Vertical 2024 & 2032
- Figure 109: Middle East and Africa Security Market Revenue Share (%), by End-user Vertical 2024 & 2032
- Figure 110: Middle East and Africa Security Market Volume Share (%), by End-user Vertical 2024 & 2032
- Figure 111: Middle East and Africa Security Market Revenue (Million), by Solution Type 2024 & 2032
- Figure 112: Middle East and Africa Security Market Volume (Billion), by Solution Type 2024 & 2032
- Figure 113: Middle East and Africa Security Market Revenue Share (%), by Solution Type 2024 & 2032
- Figure 114: Middle East and Africa Security Market Volume Share (%), by Solution Type 2024 & 2032
- Figure 115: Middle East and Africa Security Market Revenue (Million), by Deployment Type 2024 & 2032
- Figure 116: Middle East and Africa Security Market Volume (Billion), by Deployment Type 2024 & 2032
- Figure 117: Middle East and Africa Security Market Revenue Share (%), by Deployment Type 2024 & 2032
- Figure 118: Middle East and Africa Security Market Volume Share (%), by Deployment Type 2024 & 2032
- Figure 119: Middle East and Africa Security Market Revenue (Million), by Country 2024 & 2032
- Figure 120: Middle East and Africa Security Market Volume (Billion), by Country 2024 & 2032
- Figure 121: Middle East and Africa Security Market Revenue Share (%), by Country 2024 & 2032
- Figure 122: Middle East and Africa Security Market Volume Share (%), by Country 2024 & 2032
List of Tables
- Table 1: Global Security Market Revenue Million Forecast, by Region 2019 & 2032
- Table 2: Global Security Market Volume Billion Forecast, by Region 2019 & 2032
- Table 3: Global Security Market Revenue Million Forecast, by Security Type 2019 & 2032
- Table 4: Global Security Market Volume Billion Forecast, by Security Type 2019 & 2032
- Table 5: Global Security Market Revenue Million Forecast, by End-user Vertical 2019 & 2032
- Table 6: Global Security Market Volume Billion Forecast, by End-user Vertical 2019 & 2032
- Table 7: Global Security Market Revenue Million Forecast, by Solution Type 2019 & 2032
- Table 8: Global Security Market Volume Billion Forecast, by Solution Type 2019 & 2032
- Table 9: Global Security Market Revenue Million Forecast, by Deployment Type 2019 & 2032
- Table 10: Global Security Market Volume Billion Forecast, by Deployment Type 2019 & 2032
- Table 11: Global Security Market Revenue Million Forecast, by Region 2019 & 2032
- Table 12: Global Security Market Volume Billion Forecast, by Region 2019 & 2032
- Table 13: Global Security Market Revenue Million Forecast, by Security Type 2019 & 2032
- Table 14: Global Security Market Volume Billion Forecast, by Security Type 2019 & 2032
- Table 15: Global Security Market Revenue Million Forecast, by End-user Vertical 2019 & 2032
- Table 16: Global Security Market Volume Billion Forecast, by End-user Vertical 2019 & 2032
- Table 17: Global Security Market Revenue Million Forecast, by Solution Type 2019 & 2032
- Table 18: Global Security Market Volume Billion Forecast, by Solution Type 2019 & 2032
- Table 19: Global Security Market Revenue Million Forecast, by Deployment Type 2019 & 2032
- Table 20: Global Security Market Volume Billion Forecast, by Deployment Type 2019 & 2032
- Table 21: Global Security Market Revenue Million Forecast, by Country 2019 & 2032
- Table 22: Global Security Market Volume Billion Forecast, by Country 2019 & 2032
- Table 23: Global Security Market Revenue Million Forecast, by Security Type 2019 & 2032
- Table 24: Global Security Market Volume Billion Forecast, by Security Type 2019 & 2032
- Table 25: Global Security Market Revenue Million Forecast, by End-user Vertical 2019 & 2032
- Table 26: Global Security Market Volume Billion Forecast, by End-user Vertical 2019 & 2032
- Table 27: Global Security Market Revenue Million Forecast, by Solution Type 2019 & 2032
- Table 28: Global Security Market Volume Billion Forecast, by Solution Type 2019 & 2032
- Table 29: Global Security Market Revenue Million Forecast, by Deployment Type 2019 & 2032
- Table 30: Global Security Market Volume Billion Forecast, by Deployment Type 2019 & 2032
- Table 31: Global Security Market Revenue Million Forecast, by Country 2019 & 2032
- Table 32: Global Security Market Volume Billion Forecast, by Country 2019 & 2032
- Table 33: Global Security Market Revenue Million Forecast, by Security Type 2019 & 2032
- Table 34: Global Security Market Volume Billion Forecast, by Security Type 2019 & 2032
- Table 35: Global Security Market Revenue Million Forecast, by End-user Vertical 2019 & 2032
- Table 36: Global Security Market Volume Billion Forecast, by End-user Vertical 2019 & 2032
- Table 37: Global Security Market Revenue Million Forecast, by Solution Type 2019 & 2032
- Table 38: Global Security Market Volume Billion Forecast, by Solution Type 2019 & 2032
- Table 39: Global Security Market Revenue Million Forecast, by Deployment Type 2019 & 2032
- Table 40: Global Security Market Volume Billion Forecast, by Deployment Type 2019 & 2032
- Table 41: Global Security Market Revenue Million Forecast, by Country 2019 & 2032
- Table 42: Global Security Market Volume Billion Forecast, by Country 2019 & 2032
- Table 43: Global Security Market Revenue Million Forecast, by Security Type 2019 & 2032
- Table 44: Global Security Market Volume Billion Forecast, by Security Type 2019 & 2032
- Table 45: Global Security Market Revenue Million Forecast, by End-user Vertical 2019 & 2032
- Table 46: Global Security Market Volume Billion Forecast, by End-user Vertical 2019 & 2032
- Table 47: Global Security Market Revenue Million Forecast, by Solution Type 2019 & 2032
- Table 48: Global Security Market Volume Billion Forecast, by Solution Type 2019 & 2032
- Table 49: Global Security Market Revenue Million Forecast, by Deployment Type 2019 & 2032
- Table 50: Global Security Market Volume Billion Forecast, by Deployment Type 2019 & 2032
- Table 51: Global Security Market Revenue Million Forecast, by Country 2019 & 2032
- Table 52: Global Security Market Volume Billion Forecast, by Country 2019 & 2032
- Table 53: Global Security Market Revenue Million Forecast, by Security Type 2019 & 2032
- Table 54: Global Security Market Volume Billion Forecast, by Security Type 2019 & 2032
- Table 55: Global Security Market Revenue Million Forecast, by End-user Vertical 2019 & 2032
- Table 56: Global Security Market Volume Billion Forecast, by End-user Vertical 2019 & 2032
- Table 57: Global Security Market Revenue Million Forecast, by Solution Type 2019 & 2032
- Table 58: Global Security Market Volume Billion Forecast, by Solution Type 2019 & 2032
- Table 59: Global Security Market Revenue Million Forecast, by Deployment Type 2019 & 2032
- Table 60: Global Security Market Volume Billion Forecast, by Deployment Type 2019 & 2032
- Table 61: Global Security Market Revenue Million Forecast, by Country 2019 & 2032
- Table 62: Global Security Market Volume Billion Forecast, by Country 2019 & 2032
- Table 63: Global Security Market Revenue Million Forecast, by Security Type 2019 & 2032
- Table 64: Global Security Market Volume Billion Forecast, by Security Type 2019 & 2032
- Table 65: Global Security Market Revenue Million Forecast, by End-user Vertical 2019 & 2032
- Table 66: Global Security Market Volume Billion Forecast, by End-user Vertical 2019 & 2032
- Table 67: Global Security Market Revenue Million Forecast, by Solution Type 2019 & 2032
- Table 68: Global Security Market Volume Billion Forecast, by Solution Type 2019 & 2032
- Table 69: Global Security Market Revenue Million Forecast, by Deployment Type 2019 & 2032
- Table 70: Global Security Market Volume Billion Forecast, by Deployment Type 2019 & 2032
- Table 71: Global Security Market Revenue Million Forecast, by Country 2019 & 2032
- Table 72: Global Security Market Volume Billion Forecast, by Country 2019 & 2032
Frequently Asked Questions
1. What is the projected Compound Annual Growth Rate (CAGR) of the Security Market?
The projected CAGR is approximately 10.20%.
2. Which companies are prominent players in the Security Market?
Key companies in the market include Verkada Inc, HID Global, AMAG Technology (Allied Universal), Bosch Sicherheitssysteme GmbH, Axis Communications AB, Honeywell International Inc, Johnson Controls, ADT Inc, Securitas Technology, Assa Abloy Group, Genetec Inc, Palo Alto Networks, Fortinet Inc, IBM Corporation, Cisco Systems Inc.
3. What are the main segments of the Security Market?
The market segments include Security Type, End-user Vertical, Solution Type, Deployment Type.
4. Can you provide details about the market size?
The market size is estimated to be USD 23.71 Million as of 2022.
5. What are some drivers contributing to market growth?
Increasing Cyber Threats; Growth in IoT Devices.
6. What are the notable trends driving market growth?
Commercial Sector Witnessing Demand.
7. Are there any restraints impacting market growth?
Increasing Cyber Threats; Growth in IoT Devices.
8. Can you provide examples of recent developments in the market?
August 2024: Alfred International, a subsidiary of GHT Door Hardware specializing in smart and connected locks, launched its patented Alfred ML2 Smart Mortise Lock with Z-Wave Long Range in the United States. The ML2, as per the company's claims, merges cutting-edge technology with a modern keypad and a unique design. This patented drive mechanism enables dealers to retrofit the ML2 into properties that previously used older mortise-style locks. Now available in the United States, the ML2 caters to property managers and homeowners who wish to upgrade to a smart mortise lock. This upgrade can be done without entirely replacing or re-keying the existing lock, thus sidestepping common installation challenges.
9. What pricing options are available for accessing the report?
Pricing options include single-user, multi-user, and enterprise licenses priced at USD 4750, USD 5250, and USD 8750 respectively.
10. Is the market size provided in terms of value or volume?
The market size is provided in terms of value, measured in Million and volume, measured in Billion.
11. Are there any specific market keywords associated with the report?
Yes, the market keyword associated with the report is "Security Market," which aids in identifying and referencing the specific market segment covered.
12. How do I determine which pricing option suits my needs best?
The pricing options vary based on user requirements and access needs. Individual users may opt for single-user licenses, while businesses requiring broader access may choose multi-user or enterprise licenses for cost-effective access to the report.
13. Are there any additional resources or data provided in the Security Market report?
While the report offers comprehensive insights, it's advisable to review the specific contents or supplementary materials provided to ascertain if additional resources or data are available.
14. How can I stay updated on further developments or reports in the Security Market?
To stay informed about further developments, trends, and reports in the Security Market, consider subscribing to industry newsletters, following relevant companies and organizations, or regularly checking reputable industry news sources and publications.
Methodology
Step 1 - Identification of Relevant Samples Size from Population Database


Step 2 - Approaches for Defining Global Market Size (Value, Volume* & Price*)

Note*: In applicable scenarios
Step 3 - Data Sources
Primary Research
- Web Analytics
- Survey Reports
- Research Institute
- Latest Research Reports
- Opinion Leaders
Secondary Research
- Annual Reports
- White Paper
- Latest Press Release
- Industry Association
- Paid Database
- Investor Presentations

Step 4 - Data Triangulation
Involves using different sources of information in order to increase the validity of a study
These sources are likely to be stakeholders in a program - participants, other researchers, program staff, other community members, and so on.
Then we put all data in single framework & apply various statistical tools to find out the dynamic on the market.
During the analysis stage, feedback from the stakeholder groups would be compared to determine areas of agreement as well as areas of divergence
