

Key Insights
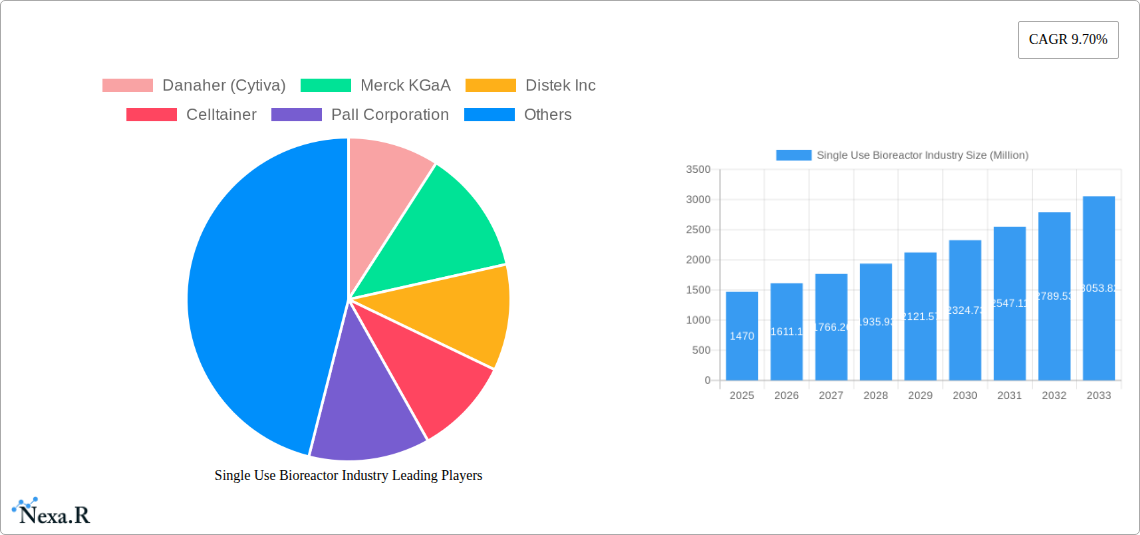
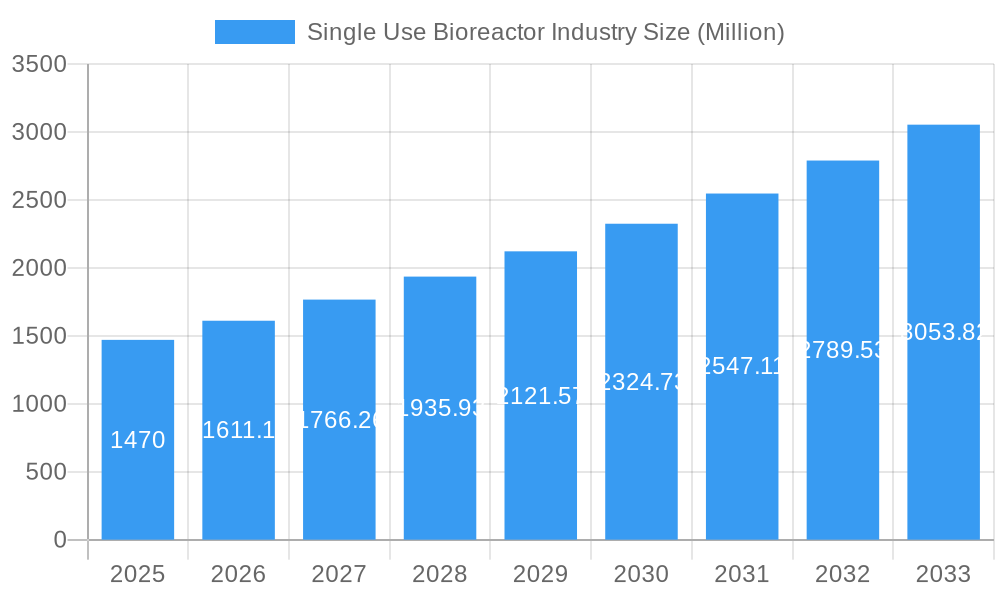
The single-use bioreactor market, valued at $1.47 billion in 2025, is experiencing robust growth, projected to expand at a compound annual growth rate (CAGR) of 9.70% from 2025 to 2033. This expansion is driven by several key factors. The increasing demand for biopharmaceuticals, particularly vaccines, monoclonal antibodies, and recombinant proteins, fuels the need for efficient and cost-effective manufacturing processes. Single-use bioreactors offer significant advantages over traditional stainless steel systems, including reduced cleaning validation time, lower risk of cross-contamination, and faster turnaround times, ultimately leading to increased production efficiency and reduced operational costs. Furthermore, advancements in bioreactor technology, such as improved sensor integration and automation, are enhancing process control and yield, attracting wider adoption across various end-user segments. The growing prevalence of contract research organizations (CROs) also contributes to market growth, as they increasingly utilize single-use bioreactors for their research and development activities. Technological advancements in cell culture techniques, especially for mammalian cells, are further enhancing the applicability and appeal of single-use bioreactors.
Single Use Bioreactor Industry Market Size (In Billion)
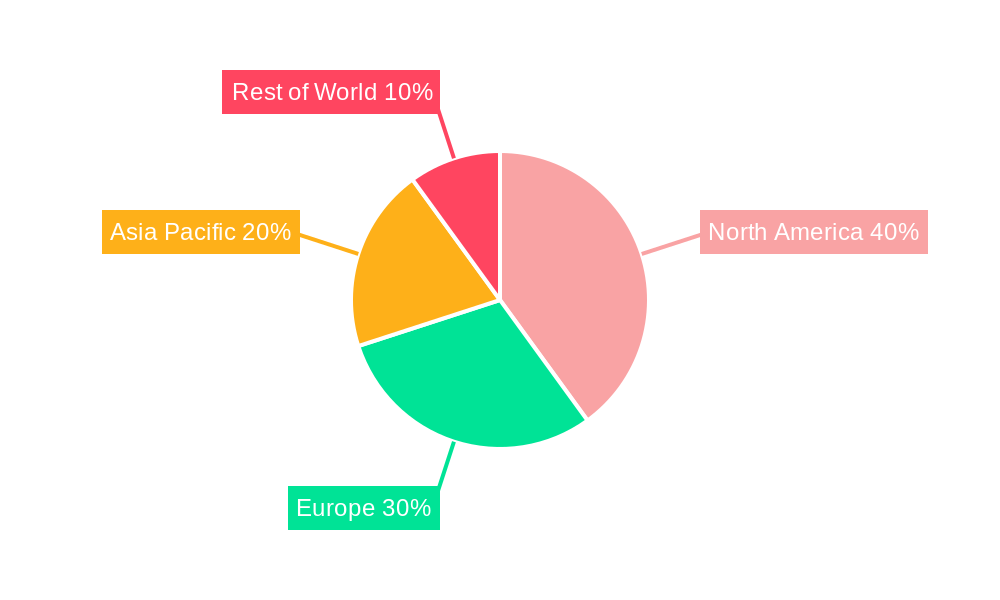
The market segmentation reveals a diverse landscape. Mammalian cell-based therapies dominate the cell type segment, driven by the increasing demand for biologics. Similarly, vaccines and monoclonal antibodies represent significant portions of the molecule type segment, reflecting the substantial investments in their development and production. The pharmaceutical and biopharmaceutical industries remain the primary end-users, with CROs demonstrating strong growth potential. Geographically, North America currently holds a significant market share, owing to the presence of established biopharmaceutical companies and advanced research infrastructure. However, Asia-Pacific is expected to experience rapid growth, driven by increasing investments in biotechnology and pharmaceutical manufacturing in countries like China and India. The continued expansion of the biopharmaceutical industry, coupled with technological advancements and growing outsourcing to CROs, positions the single-use bioreactor market for sustained and significant growth in the coming years.
Single Use Bioreactor Industry Company Market Share
Single Use Bioreactor Industry Market Report: 2019-2033
This comprehensive report provides an in-depth analysis of the Single Use Bioreactor Industry, encompassing market dynamics, growth trends, regional segmentation, product landscape, and key players. The report covers the period 2019-2033, with a focus on the forecast period 2025-2033 and a base year of 2025. The market is segmented by product type, cell type, molecule type, and end-user, providing a granular understanding of this rapidly evolving sector. Projected market value for 2025 is estimated at xx Million.
Single Use Bioreactor Industry Market Dynamics & Structure
This section analyzes the competitive landscape, technological advancements, regulatory influences, and market trends within the single-use bioreactor industry. The market is characterized by a moderate level of concentration, with key players such as Danaher (Cytiva), Merck KGaA, Sartorius AG, and Thermo Fisher Scientific holding significant market share. However, smaller specialized companies and emerging players continue to innovate and challenge the established players.
- Market Concentration: Moderate, with top 5 players holding approximately xx% market share in 2025.
- Technological Innovation: Driven by increasing demand for higher throughput, reduced contamination risk, and cost-effectiveness. This includes advancements in bioreactor design, automation, and process monitoring.
- Regulatory Landscape: Stringent regulations (e.g., GMP compliance) influence technology adoption and manufacturing practices. This necessitates robust quality control and validation procedures.
- Competitive Substitutes: Traditional stainless steel bioreactors still hold a market share but face increasing competition from single-use systems due to advantages in flexibility and reduced cleaning validation.
- End-User Demographics: Primarily driven by pharmaceutical and biopharmaceutical companies, with a growing segment of CROs.
- M&A Trends: Strategic acquisitions and partnerships are prevalent, leading to consolidation and expansion of product portfolios. An estimated xx M&A deals occurred between 2019-2024, resulting in a market consolidation of xx%.
Single Use Bioreactor Industry Growth Trends & Insights
The single-use bioreactor market is experiencing robust growth, driven by the increasing demand for biologics, the adoption of advanced manufacturing technologies, and the rising need for flexible and cost-effective bioprocessing solutions. The market size is projected to expand at a CAGR of xx% during the forecast period (2025-2033), reaching an estimated value of xx Million by 2033. This growth is fueled by several factors including: increased demand for biologics driven by an aging population and the prevalence of chronic diseases, increasing adoption of single-use technologies across diverse applications such as cell therapy, vaccines, and monoclonal antibodies; continuous process innovation and technological advancements. Market penetration in emerging economies is expected to increase significantly, contributing substantially to overall market growth. Consumer behavior shifts toward preference for quicker development and manufacturing times are also impacting the market.
Dominant Regions, Countries, or Segments in Single Use Bioreactor Industry
North America and Europe currently dominate the single-use bioreactor market, driven by established biopharmaceutical industries and robust regulatory frameworks. However, Asia-Pacific is expected to witness significant growth due to expanding healthcare infrastructure and increasing investments in biopharmaceutical manufacturing.
Product Type: Single-use bioreactor systems represent the largest segment, followed by media bags and filtration assemblies.
Cell Type: Mammalian cells dominate the market, driven by the high demand for monoclonal antibodies and other therapeutic proteins.
Molecule Type: Monoclonal antibodies account for a significant portion of the market, followed by vaccines and recombinant proteins.
End-User: Pharmaceutical and biopharmaceutical industries constitute the primary end-users, with a growing contribution from CROs.
Key Drivers: Growing biologics market, increasing adoption of single-use technologies, advancements in bioprocessing technology, supportive government policies, and increasing investments in R&D.
Single Use Bioreactor Industry Product Landscape
The single-use bioreactor market offers a wide range of products, including disposable bioreactor systems, media bags, sensors, and other accessories. Recent innovations focus on improving scalability, automation, and process monitoring capabilities. Manufacturers are focusing on developing systems with higher cell densities, improved oxygen transfer rates, and enhanced control over process parameters. Unique selling propositions include reduced cleaning validation efforts, improved flexibility in process design, and enhanced sterility.
Key Drivers, Barriers & Challenges in Single Use Bioreactor Industry
Key Drivers:
- Increasing demand for biologics.
- Growing adoption of continuous manufacturing processes.
- Rising investments in research and development.
- Technological advancements in single-use technologies.
Challenges & Restraints:
- High initial investment costs for single-use systems.
- Potential for material compatibility issues.
- Concerns regarding the environmental impact of single-use disposables. Supply chain disruptions have impacted the availability and cost of raw materials.
- Regulatory compliance requirements add to the overall cost and complexity of product development.
Emerging Opportunities in Single Use Bioreactor Industry
Emerging opportunities lie in the development of advanced single-use bioreactor systems for cell therapy, personalized medicine, and the production of novel biologics. Expansion into emerging markets, development of innovative bioprocessing technologies, and strategic partnerships with key players hold significant potential for growth. The development of more sustainable and eco-friendly single-use materials presents a significant opportunity for market expansion.
Growth Accelerators in the Single Use Bioreactor Industry Industry
Technological advancements, strategic partnerships, and the growing adoption of continuous manufacturing processes are key catalysts for long-term growth. Expansion into emerging markets and the development of innovative bioprocessing technologies, such as perfusion bioreactors, also promise significant future opportunities.
Key Players Shaping the Single Use Bioreactor Market
- Danaher (Cytiva)
- Merck KGaA
- Distek Inc
- Celltainer
- Pall Corporation
- Eppendorf SE
- Sartorius AG
- Thermo Fisher Scientific
- OmniBRx Biotechnologies
- ABEC
Notable Milestones in Single Use Bioreactor Industry Sector
- June 2022: mAbxience installs an additional ABEC 4,000L CSR bioreactor, expanding its CDMO capacity.
- May 2022: RD-Biotech partners with Pall Corporation for single-use solutions in pDNA production.
In-Depth Single Use Bioreactor Industry Market Outlook
The future of the single-use bioreactor market appears bright, with continued growth driven by technological innovation, expanding applications, and increasing demand for biologics. Strategic partnerships, market expansion into emerging economies, and the adoption of sustainable practices will further fuel market expansion and create significant opportunities for key players in this dynamic industry.
Single Use Bioreactor Industry Segmentation
-
1. Type of Product
- 1.1. Single-use Bioreactor Systems
- 1.2. Media Bags
- 1.3. Filtration Assemblies
- 1.4. Other Products
-
2. Cell Type
- 2.1. Mammalian Cell
- 2.2. Bacteria
- 2.3. Yeast
- 2.4. Other Cell Types
-
3. Molecule Type
- 3.1. Vaccines
- 3.2. Monoclonal Antibodies
- 3.3. Stem Cells
- 3.4. Recombinant Proteins
- 3.5. Other Molecule Types
-
4. End User
- 4.1. Pharmaceutical and Biopharmaceutical Industries
- 4.2. Contract Research Organizations (CRO)
- 4.3. Other End Users
Single Use Bioreactor Industry Segmentation By Geography
-
1. North America
- 1.1. United States
- 1.2. Canada
- 1.3. Mexico
-
2. Europe
- 2.1. Germany
- 2.2. United Kingdom
- 2.3. France
- 2.4. Italy
- 2.5. Spain
- 2.6. Rest of Europe
-
3. Asia Pacific
- 3.1. China
- 3.2. Japan
- 3.3. India
- 3.4. Australia
- 3.5. South Korea
- 3.6. Rest of Asia Pacific
-
4. Middle East and Africa
- 4.1. GCC
- 4.2. South Africa
- 4.3. Rest of Middle East and Africa
-
5. South America
- 5.1. Brazil
- 5.2. Argentina
- 5.3. Rest of South America
Single Use Bioreactor Industry Regional Market Share
Geographic Coverage of Single Use Bioreactor Industry
Single Use Bioreactor Industry REPORT HIGHLIGHTS
| Aspects | Details |
|---|---|
| Study Period | 2020-2034 |
| Base Year | 2025 |
| Estimated Year | 2026 |
| Forecast Period | 2026-2034 |
| Historical Period | 2020-2025 |
| Growth Rate | CAGR of 9.70% from 2020-2034 |
| Segmentation |
|
Table of Contents
- 1. Introduction
- 1.1. Research Scope
- 1.2. Market Segmentation
- 1.3. Research Methodology
- 1.4. Definitions and Assumptions
- 2. Executive Summary
- 2.1. Introduction
- 3. Market Dynamics
- 3.1. Introduction
- 3.2. Market Drivers
- 3.2.1. Rapid Adoption of Single-use Technologies (SUTs) by the Industry; Cost Effectiveness and Lower Downtime; New Product Launches
- 3.3. Market Restrains
- 3.3.1. High Regular Recurring Expenses; Issues with Meeting the Standards of Good Manufacturing Practices
- 3.4. Market Trends
- 3.4.1. Monoclonal Antibodies Segment is Anticipated to Witness Growth
- 4. Market Factor Analysis
- 4.1. Porters Five Forces
- 4.2. Supply/Value Chain
- 4.3. PESTEL analysis
- 4.4. Market Entropy
- 4.5. Patent/Trademark Analysis
- 5. Global Single Use Bioreactor Industry Analysis, Insights and Forecast, 2020-2032
- 5.1. Market Analysis, Insights and Forecast - by Type of Product
- 5.1.1. Single-use Bioreactor Systems
- 5.1.2. Media Bags
- 5.1.3. Filtration Assemblies
- 5.1.4. Other Products
- 5.2. Market Analysis, Insights and Forecast - by Cell Type
- 5.2.1. Mammalian Cell
- 5.2.2. Bacteria
- 5.2.3. Yeast
- 5.2.4. Other Cell Types
- 5.3. Market Analysis, Insights and Forecast - by Molecule Type
- 5.3.1. Vaccines
- 5.3.2. Monoclonal Antibodies
- 5.3.3. Stem Cells
- 5.3.4. Recombinant Proteins
- 5.3.5. Other Molecule Types
- 5.4. Market Analysis, Insights and Forecast - by End User
- 5.4.1. Pharmaceutical and Biopharmaceutical Industries
- 5.4.2. Contract Research Organizations (CRO)
- 5.4.3. Other End Users
- 5.5. Market Analysis, Insights and Forecast - by Region
- 5.5.1. North America
- 5.5.2. Europe
- 5.5.3. Asia Pacific
- 5.5.4. Middle East and Africa
- 5.5.5. South America
- 5.1. Market Analysis, Insights and Forecast - by Type of Product
- 6. North America Single Use Bioreactor Industry Analysis, Insights and Forecast, 2020-2032
- 6.1. Market Analysis, Insights and Forecast - by Type of Product
- 6.1.1. Single-use Bioreactor Systems
- 6.1.2. Media Bags
- 6.1.3. Filtration Assemblies
- 6.1.4. Other Products
- 6.2. Market Analysis, Insights and Forecast - by Cell Type
- 6.2.1. Mammalian Cell
- 6.2.2. Bacteria
- 6.2.3. Yeast
- 6.2.4. Other Cell Types
- 6.3. Market Analysis, Insights and Forecast - by Molecule Type
- 6.3.1. Vaccines
- 6.3.2. Monoclonal Antibodies
- 6.3.3. Stem Cells
- 6.3.4. Recombinant Proteins
- 6.3.5. Other Molecule Types
- 6.4. Market Analysis, Insights and Forecast - by End User
- 6.4.1. Pharmaceutical and Biopharmaceutical Industries
- 6.4.2. Contract Research Organizations (CRO)
- 6.4.3. Other End Users
- 6.1. Market Analysis, Insights and Forecast - by Type of Product
- 7. Europe Single Use Bioreactor Industry Analysis, Insights and Forecast, 2020-2032
- 7.1. Market Analysis, Insights and Forecast - by Type of Product
- 7.1.1. Single-use Bioreactor Systems
- 7.1.2. Media Bags
- 7.1.3. Filtration Assemblies
- 7.1.4. Other Products
- 7.2. Market Analysis, Insights and Forecast - by Cell Type
- 7.2.1. Mammalian Cell
- 7.2.2. Bacteria
- 7.2.3. Yeast
- 7.2.4. Other Cell Types
- 7.3. Market Analysis, Insights and Forecast - by Molecule Type
- 7.3.1. Vaccines
- 7.3.2. Monoclonal Antibodies
- 7.3.3. Stem Cells
- 7.3.4. Recombinant Proteins
- 7.3.5. Other Molecule Types
- 7.4. Market Analysis, Insights and Forecast - by End User
- 7.4.1. Pharmaceutical and Biopharmaceutical Industries
- 7.4.2. Contract Research Organizations (CRO)
- 7.4.3. Other End Users
- 7.1. Market Analysis, Insights and Forecast - by Type of Product
- 8. Asia Pacific Single Use Bioreactor Industry Analysis, Insights and Forecast, 2020-2032
- 8.1. Market Analysis, Insights and Forecast - by Type of Product
- 8.1.1. Single-use Bioreactor Systems
- 8.1.2. Media Bags
- 8.1.3. Filtration Assemblies
- 8.1.4. Other Products
- 8.2. Market Analysis, Insights and Forecast - by Cell Type
- 8.2.1. Mammalian Cell
- 8.2.2. Bacteria
- 8.2.3. Yeast
- 8.2.4. Other Cell Types
- 8.3. Market Analysis, Insights and Forecast - by Molecule Type
- 8.3.1. Vaccines
- 8.3.2. Monoclonal Antibodies
- 8.3.3. Stem Cells
- 8.3.4. Recombinant Proteins
- 8.3.5. Other Molecule Types
- 8.4. Market Analysis, Insights and Forecast - by End User
- 8.4.1. Pharmaceutical and Biopharmaceutical Industries
- 8.4.2. Contract Research Organizations (CRO)
- 8.4.3. Other End Users
- 8.1. Market Analysis, Insights and Forecast - by Type of Product
- 9. Middle East and Africa Single Use Bioreactor Industry Analysis, Insights and Forecast, 2020-2032
- 9.1. Market Analysis, Insights and Forecast - by Type of Product
- 9.1.1. Single-use Bioreactor Systems
- 9.1.2. Media Bags
- 9.1.3. Filtration Assemblies
- 9.1.4. Other Products
- 9.2. Market Analysis, Insights and Forecast - by Cell Type
- 9.2.1. Mammalian Cell
- 9.2.2. Bacteria
- 9.2.3. Yeast
- 9.2.4. Other Cell Types
- 9.3. Market Analysis, Insights and Forecast - by Molecule Type
- 9.3.1. Vaccines
- 9.3.2. Monoclonal Antibodies
- 9.3.3. Stem Cells
- 9.3.4. Recombinant Proteins
- 9.3.5. Other Molecule Types
- 9.4. Market Analysis, Insights and Forecast - by End User
- 9.4.1. Pharmaceutical and Biopharmaceutical Industries
- 9.4.2. Contract Research Organizations (CRO)
- 9.4.3. Other End Users
- 9.1. Market Analysis, Insights and Forecast - by Type of Product
- 10. South America Single Use Bioreactor Industry Analysis, Insights and Forecast, 2020-2032
- 10.1. Market Analysis, Insights and Forecast - by Type of Product
- 10.1.1. Single-use Bioreactor Systems
- 10.1.2. Media Bags
- 10.1.3. Filtration Assemblies
- 10.1.4. Other Products
- 10.2. Market Analysis, Insights and Forecast - by Cell Type
- 10.2.1. Mammalian Cell
- 10.2.2. Bacteria
- 10.2.3. Yeast
- 10.2.4. Other Cell Types
- 10.3. Market Analysis, Insights and Forecast - by Molecule Type
- 10.3.1. Vaccines
- 10.3.2. Monoclonal Antibodies
- 10.3.3. Stem Cells
- 10.3.4. Recombinant Proteins
- 10.3.5. Other Molecule Types
- 10.4. Market Analysis, Insights and Forecast - by End User
- 10.4.1. Pharmaceutical and Biopharmaceutical Industries
- 10.4.2. Contract Research Organizations (CRO)
- 10.4.3. Other End Users
- 10.1. Market Analysis, Insights and Forecast - by Type of Product
- 11. Competitive Analysis
- 11.1. Global Market Share Analysis 2025
- 11.2. Company Profiles
- 11.2.1 Danaher (Cytiva)
- 11.2.1.1. Overview
- 11.2.1.2. Products
- 11.2.1.3. SWOT Analysis
- 11.2.1.4. Recent Developments
- 11.2.1.5. Financials (Based on Availability)
- 11.2.2 Merck KGaA
- 11.2.2.1. Overview
- 11.2.2.2. Products
- 11.2.2.3. SWOT Analysis
- 11.2.2.4. Recent Developments
- 11.2.2.5. Financials (Based on Availability)
- 11.2.3 Distek Inc
- 11.2.3.1. Overview
- 11.2.3.2. Products
- 11.2.3.3. SWOT Analysis
- 11.2.3.4. Recent Developments
- 11.2.3.5. Financials (Based on Availability)
- 11.2.4 Celltainer
- 11.2.4.1. Overview
- 11.2.4.2. Products
- 11.2.4.3. SWOT Analysis
- 11.2.4.4. Recent Developments
- 11.2.4.5. Financials (Based on Availability)
- 11.2.5 Pall Corporation
- 11.2.5.1. Overview
- 11.2.5.2. Products
- 11.2.5.3. SWOT Analysis
- 11.2.5.4. Recent Developments
- 11.2.5.5. Financials (Based on Availability)
- 11.2.6 Eppendorf SE
- 11.2.6.1. Overview
- 11.2.6.2. Products
- 11.2.6.3. SWOT Analysis
- 11.2.6.4. Recent Developments
- 11.2.6.5. Financials (Based on Availability)
- 11.2.7 Sartorius AG
- 11.2.7.1. Overview
- 11.2.7.2. Products
- 11.2.7.3. SWOT Analysis
- 11.2.7.4. Recent Developments
- 11.2.7.5. Financials (Based on Availability)
- 11.2.8 Thermo Fisher Scientific
- 11.2.8.1. Overview
- 11.2.8.2. Products
- 11.2.8.3. SWOT Analysis
- 11.2.8.4. Recent Developments
- 11.2.8.5. Financials (Based on Availability)
- 11.2.9 OmniBRx Biotechnologies
- 11.2.9.1. Overview
- 11.2.9.2. Products
- 11.2.9.3. SWOT Analysis
- 11.2.9.4. Recent Developments
- 11.2.9.5. Financials (Based on Availability)
- 11.2.10 ABEC
- 11.2.10.1. Overview
- 11.2.10.2. Products
- 11.2.10.3. SWOT Analysis
- 11.2.10.4. Recent Developments
- 11.2.10.5. Financials (Based on Availability)
- 11.2.1 Danaher (Cytiva)
List of Figures
- Figure 1: Global Single Use Bioreactor Industry Revenue Breakdown (Million, %) by Region 2025 & 2033
- Figure 2: Global Single Use Bioreactor Industry Volume Breakdown (K Units, %) by Region 2025 & 2033
- Figure 3: North America Single Use Bioreactor Industry Revenue (Million), by Type of Product 2025 & 2033
- Figure 4: North America Single Use Bioreactor Industry Volume (K Units), by Type of Product 2025 & 2033
- Figure 5: North America Single Use Bioreactor Industry Revenue Share (%), by Type of Product 2025 & 2033
- Figure 6: North America Single Use Bioreactor Industry Volume Share (%), by Type of Product 2025 & 2033
- Figure 7: North America Single Use Bioreactor Industry Revenue (Million), by Cell Type 2025 & 2033
- Figure 8: North America Single Use Bioreactor Industry Volume (K Units), by Cell Type 2025 & 2033
- Figure 9: North America Single Use Bioreactor Industry Revenue Share (%), by Cell Type 2025 & 2033
- Figure 10: North America Single Use Bioreactor Industry Volume Share (%), by Cell Type 2025 & 2033
- Figure 11: North America Single Use Bioreactor Industry Revenue (Million), by Molecule Type 2025 & 2033
- Figure 12: North America Single Use Bioreactor Industry Volume (K Units), by Molecule Type 2025 & 2033
- Figure 13: North America Single Use Bioreactor Industry Revenue Share (%), by Molecule Type 2025 & 2033
- Figure 14: North America Single Use Bioreactor Industry Volume Share (%), by Molecule Type 2025 & 2033
- Figure 15: North America Single Use Bioreactor Industry Revenue (Million), by End User 2025 & 2033
- Figure 16: North America Single Use Bioreactor Industry Volume (K Units), by End User 2025 & 2033
- Figure 17: North America Single Use Bioreactor Industry Revenue Share (%), by End User 2025 & 2033
- Figure 18: North America Single Use Bioreactor Industry Volume Share (%), by End User 2025 & 2033
- Figure 19: North America Single Use Bioreactor Industry Revenue (Million), by Country 2025 & 2033
- Figure 20: North America Single Use Bioreactor Industry Volume (K Units), by Country 2025 & 2033
- Figure 21: North America Single Use Bioreactor Industry Revenue Share (%), by Country 2025 & 2033
- Figure 22: North America Single Use Bioreactor Industry Volume Share (%), by Country 2025 & 2033
- Figure 23: Europe Single Use Bioreactor Industry Revenue (Million), by Type of Product 2025 & 2033
- Figure 24: Europe Single Use Bioreactor Industry Volume (K Units), by Type of Product 2025 & 2033
- Figure 25: Europe Single Use Bioreactor Industry Revenue Share (%), by Type of Product 2025 & 2033
- Figure 26: Europe Single Use Bioreactor Industry Volume Share (%), by Type of Product 2025 & 2033
- Figure 27: Europe Single Use Bioreactor Industry Revenue (Million), by Cell Type 2025 & 2033
- Figure 28: Europe Single Use Bioreactor Industry Volume (K Units), by Cell Type 2025 & 2033
- Figure 29: Europe Single Use Bioreactor Industry Revenue Share (%), by Cell Type 2025 & 2033
- Figure 30: Europe Single Use Bioreactor Industry Volume Share (%), by Cell Type 2025 & 2033
- Figure 31: Europe Single Use Bioreactor Industry Revenue (Million), by Molecule Type 2025 & 2033
- Figure 32: Europe Single Use Bioreactor Industry Volume (K Units), by Molecule Type 2025 & 2033
- Figure 33: Europe Single Use Bioreactor Industry Revenue Share (%), by Molecule Type 2025 & 2033
- Figure 34: Europe Single Use Bioreactor Industry Volume Share (%), by Molecule Type 2025 & 2033
- Figure 35: Europe Single Use Bioreactor Industry Revenue (Million), by End User 2025 & 2033
- Figure 36: Europe Single Use Bioreactor Industry Volume (K Units), by End User 2025 & 2033
- Figure 37: Europe Single Use Bioreactor Industry Revenue Share (%), by End User 2025 & 2033
- Figure 38: Europe Single Use Bioreactor Industry Volume Share (%), by End User 2025 & 2033
- Figure 39: Europe Single Use Bioreactor Industry Revenue (Million), by Country 2025 & 2033
- Figure 40: Europe Single Use Bioreactor Industry Volume (K Units), by Country 2025 & 2033
- Figure 41: Europe Single Use Bioreactor Industry Revenue Share (%), by Country 2025 & 2033
- Figure 42: Europe Single Use Bioreactor Industry Volume Share (%), by Country 2025 & 2033
- Figure 43: Asia Pacific Single Use Bioreactor Industry Revenue (Million), by Type of Product 2025 & 2033
- Figure 44: Asia Pacific Single Use Bioreactor Industry Volume (K Units), by Type of Product 2025 & 2033
- Figure 45: Asia Pacific Single Use Bioreactor Industry Revenue Share (%), by Type of Product 2025 & 2033
- Figure 46: Asia Pacific Single Use Bioreactor Industry Volume Share (%), by Type of Product 2025 & 2033
- Figure 47: Asia Pacific Single Use Bioreactor Industry Revenue (Million), by Cell Type 2025 & 2033
- Figure 48: Asia Pacific Single Use Bioreactor Industry Volume (K Units), by Cell Type 2025 & 2033
- Figure 49: Asia Pacific Single Use Bioreactor Industry Revenue Share (%), by Cell Type 2025 & 2033
- Figure 50: Asia Pacific Single Use Bioreactor Industry Volume Share (%), by Cell Type 2025 & 2033
- Figure 51: Asia Pacific Single Use Bioreactor Industry Revenue (Million), by Molecule Type 2025 & 2033
- Figure 52: Asia Pacific Single Use Bioreactor Industry Volume (K Units), by Molecule Type 2025 & 2033
- Figure 53: Asia Pacific Single Use Bioreactor Industry Revenue Share (%), by Molecule Type 2025 & 2033
- Figure 54: Asia Pacific Single Use Bioreactor Industry Volume Share (%), by Molecule Type 2025 & 2033
- Figure 55: Asia Pacific Single Use Bioreactor Industry Revenue (Million), by End User 2025 & 2033
- Figure 56: Asia Pacific Single Use Bioreactor Industry Volume (K Units), by End User 2025 & 2033
- Figure 57: Asia Pacific Single Use Bioreactor Industry Revenue Share (%), by End User 2025 & 2033
- Figure 58: Asia Pacific Single Use Bioreactor Industry Volume Share (%), by End User 2025 & 2033
- Figure 59: Asia Pacific Single Use Bioreactor Industry Revenue (Million), by Country 2025 & 2033
- Figure 60: Asia Pacific Single Use Bioreactor Industry Volume (K Units), by Country 2025 & 2033
- Figure 61: Asia Pacific Single Use Bioreactor Industry Revenue Share (%), by Country 2025 & 2033
- Figure 62: Asia Pacific Single Use Bioreactor Industry Volume Share (%), by Country 2025 & 2033
- Figure 63: Middle East and Africa Single Use Bioreactor Industry Revenue (Million), by Type of Product 2025 & 2033
- Figure 64: Middle East and Africa Single Use Bioreactor Industry Volume (K Units), by Type of Product 2025 & 2033
- Figure 65: Middle East and Africa Single Use Bioreactor Industry Revenue Share (%), by Type of Product 2025 & 2033
- Figure 66: Middle East and Africa Single Use Bioreactor Industry Volume Share (%), by Type of Product 2025 & 2033
- Figure 67: Middle East and Africa Single Use Bioreactor Industry Revenue (Million), by Cell Type 2025 & 2033
- Figure 68: Middle East and Africa Single Use Bioreactor Industry Volume (K Units), by Cell Type 2025 & 2033
- Figure 69: Middle East and Africa Single Use Bioreactor Industry Revenue Share (%), by Cell Type 2025 & 2033
- Figure 70: Middle East and Africa Single Use Bioreactor Industry Volume Share (%), by Cell Type 2025 & 2033
- Figure 71: Middle East and Africa Single Use Bioreactor Industry Revenue (Million), by Molecule Type 2025 & 2033
- Figure 72: Middle East and Africa Single Use Bioreactor Industry Volume (K Units), by Molecule Type 2025 & 2033
- Figure 73: Middle East and Africa Single Use Bioreactor Industry Revenue Share (%), by Molecule Type 2025 & 2033
- Figure 74: Middle East and Africa Single Use Bioreactor Industry Volume Share (%), by Molecule Type 2025 & 2033
- Figure 75: Middle East and Africa Single Use Bioreactor Industry Revenue (Million), by End User 2025 & 2033
- Figure 76: Middle East and Africa Single Use Bioreactor Industry Volume (K Units), by End User 2025 & 2033
- Figure 77: Middle East and Africa Single Use Bioreactor Industry Revenue Share (%), by End User 2025 & 2033
- Figure 78: Middle East and Africa Single Use Bioreactor Industry Volume Share (%), by End User 2025 & 2033
- Figure 79: Middle East and Africa Single Use Bioreactor Industry Revenue (Million), by Country 2025 & 2033
- Figure 80: Middle East and Africa Single Use Bioreactor Industry Volume (K Units), by Country 2025 & 2033
- Figure 81: Middle East and Africa Single Use Bioreactor Industry Revenue Share (%), by Country 2025 & 2033
- Figure 82: Middle East and Africa Single Use Bioreactor Industry Volume Share (%), by Country 2025 & 2033
- Figure 83: South America Single Use Bioreactor Industry Revenue (Million), by Type of Product 2025 & 2033
- Figure 84: South America Single Use Bioreactor Industry Volume (K Units), by Type of Product 2025 & 2033
- Figure 85: South America Single Use Bioreactor Industry Revenue Share (%), by Type of Product 2025 & 2033
- Figure 86: South America Single Use Bioreactor Industry Volume Share (%), by Type of Product 2025 & 2033
- Figure 87: South America Single Use Bioreactor Industry Revenue (Million), by Cell Type 2025 & 2033
- Figure 88: South America Single Use Bioreactor Industry Volume (K Units), by Cell Type 2025 & 2033
- Figure 89: South America Single Use Bioreactor Industry Revenue Share (%), by Cell Type 2025 & 2033
- Figure 90: South America Single Use Bioreactor Industry Volume Share (%), by Cell Type 2025 & 2033
- Figure 91: South America Single Use Bioreactor Industry Revenue (Million), by Molecule Type 2025 & 2033
- Figure 92: South America Single Use Bioreactor Industry Volume (K Units), by Molecule Type 2025 & 2033
- Figure 93: South America Single Use Bioreactor Industry Revenue Share (%), by Molecule Type 2025 & 2033
- Figure 94: South America Single Use Bioreactor Industry Volume Share (%), by Molecule Type 2025 & 2033
- Figure 95: South America Single Use Bioreactor Industry Revenue (Million), by End User 2025 & 2033
- Figure 96: South America Single Use Bioreactor Industry Volume (K Units), by End User 2025 & 2033
- Figure 97: South America Single Use Bioreactor Industry Revenue Share (%), by End User 2025 & 2033
- Figure 98: South America Single Use Bioreactor Industry Volume Share (%), by End User 2025 & 2033
- Figure 99: South America Single Use Bioreactor Industry Revenue (Million), by Country 2025 & 2033
- Figure 100: South America Single Use Bioreactor Industry Volume (K Units), by Country 2025 & 2033
- Figure 101: South America Single Use Bioreactor Industry Revenue Share (%), by Country 2025 & 2033
- Figure 102: South America Single Use Bioreactor Industry Volume Share (%), by Country 2025 & 2033
List of Tables
- Table 1: Global Single Use Bioreactor Industry Revenue Million Forecast, by Type of Product 2020 & 2033
- Table 2: Global Single Use Bioreactor Industry Volume K Units Forecast, by Type of Product 2020 & 2033
- Table 3: Global Single Use Bioreactor Industry Revenue Million Forecast, by Cell Type 2020 & 2033
- Table 4: Global Single Use Bioreactor Industry Volume K Units Forecast, by Cell Type 2020 & 2033
- Table 5: Global Single Use Bioreactor Industry Revenue Million Forecast, by Molecule Type 2020 & 2033
- Table 6: Global Single Use Bioreactor Industry Volume K Units Forecast, by Molecule Type 2020 & 2033
- Table 7: Global Single Use Bioreactor Industry Revenue Million Forecast, by End User 2020 & 2033
- Table 8: Global Single Use Bioreactor Industry Volume K Units Forecast, by End User 2020 & 2033
- Table 9: Global Single Use Bioreactor Industry Revenue Million Forecast, by Region 2020 & 2033
- Table 10: Global Single Use Bioreactor Industry Volume K Units Forecast, by Region 2020 & 2033
- Table 11: Global Single Use Bioreactor Industry Revenue Million Forecast, by Type of Product 2020 & 2033
- Table 12: Global Single Use Bioreactor Industry Volume K Units Forecast, by Type of Product 2020 & 2033
- Table 13: Global Single Use Bioreactor Industry Revenue Million Forecast, by Cell Type 2020 & 2033
- Table 14: Global Single Use Bioreactor Industry Volume K Units Forecast, by Cell Type 2020 & 2033
- Table 15: Global Single Use Bioreactor Industry Revenue Million Forecast, by Molecule Type 2020 & 2033
- Table 16: Global Single Use Bioreactor Industry Volume K Units Forecast, by Molecule Type 2020 & 2033
- Table 17: Global Single Use Bioreactor Industry Revenue Million Forecast, by End User 2020 & 2033
- Table 18: Global Single Use Bioreactor Industry Volume K Units Forecast, by End User 2020 & 2033
- Table 19: Global Single Use Bioreactor Industry Revenue Million Forecast, by Country 2020 & 2033
- Table 20: Global Single Use Bioreactor Industry Volume K Units Forecast, by Country 2020 & 2033
- Table 21: United States Single Use Bioreactor Industry Revenue (Million) Forecast, by Application 2020 & 2033
- Table 22: United States Single Use Bioreactor Industry Volume (K Units) Forecast, by Application 2020 & 2033
- Table 23: Canada Single Use Bioreactor Industry Revenue (Million) Forecast, by Application 2020 & 2033
- Table 24: Canada Single Use Bioreactor Industry Volume (K Units) Forecast, by Application 2020 & 2033
- Table 25: Mexico Single Use Bioreactor Industry Revenue (Million) Forecast, by Application 2020 & 2033
- Table 26: Mexico Single Use Bioreactor Industry Volume (K Units) Forecast, by Application 2020 & 2033
- Table 27: Global Single Use Bioreactor Industry Revenue Million Forecast, by Type of Product 2020 & 2033
- Table 28: Global Single Use Bioreactor Industry Volume K Units Forecast, by Type of Product 2020 & 2033
- Table 29: Global Single Use Bioreactor Industry Revenue Million Forecast, by Cell Type 2020 & 2033
- Table 30: Global Single Use Bioreactor Industry Volume K Units Forecast, by Cell Type 2020 & 2033
- Table 31: Global Single Use Bioreactor Industry Revenue Million Forecast, by Molecule Type 2020 & 2033
- Table 32: Global Single Use Bioreactor Industry Volume K Units Forecast, by Molecule Type 2020 & 2033
- Table 33: Global Single Use Bioreactor Industry Revenue Million Forecast, by End User 2020 & 2033
- Table 34: Global Single Use Bioreactor Industry Volume K Units Forecast, by End User 2020 & 2033
- Table 35: Global Single Use Bioreactor Industry Revenue Million Forecast, by Country 2020 & 2033
- Table 36: Global Single Use Bioreactor Industry Volume K Units Forecast, by Country 2020 & 2033
- Table 37: Germany Single Use Bioreactor Industry Revenue (Million) Forecast, by Application 2020 & 2033
- Table 38: Germany Single Use Bioreactor Industry Volume (K Units) Forecast, by Application 2020 & 2033
- Table 39: United Kingdom Single Use Bioreactor Industry Revenue (Million) Forecast, by Application 2020 & 2033
- Table 40: United Kingdom Single Use Bioreactor Industry Volume (K Units) Forecast, by Application 2020 & 2033
- Table 41: France Single Use Bioreactor Industry Revenue (Million) Forecast, by Application 2020 & 2033
- Table 42: France Single Use Bioreactor Industry Volume (K Units) Forecast, by Application 2020 & 2033
- Table 43: Italy Single Use Bioreactor Industry Revenue (Million) Forecast, by Application 2020 & 2033
- Table 44: Italy Single Use Bioreactor Industry Volume (K Units) Forecast, by Application 2020 & 2033
- Table 45: Spain Single Use Bioreactor Industry Revenue (Million) Forecast, by Application 2020 & 2033
- Table 46: Spain Single Use Bioreactor Industry Volume (K Units) Forecast, by Application 2020 & 2033
- Table 47: Rest of Europe Single Use Bioreactor Industry Revenue (Million) Forecast, by Application 2020 & 2033
- Table 48: Rest of Europe Single Use Bioreactor Industry Volume (K Units) Forecast, by Application 2020 & 2033
- Table 49: Global Single Use Bioreactor Industry Revenue Million Forecast, by Type of Product 2020 & 2033
- Table 50: Global Single Use Bioreactor Industry Volume K Units Forecast, by Type of Product 2020 & 2033
- Table 51: Global Single Use Bioreactor Industry Revenue Million Forecast, by Cell Type 2020 & 2033
- Table 52: Global Single Use Bioreactor Industry Volume K Units Forecast, by Cell Type 2020 & 2033
- Table 53: Global Single Use Bioreactor Industry Revenue Million Forecast, by Molecule Type 2020 & 2033
- Table 54: Global Single Use Bioreactor Industry Volume K Units Forecast, by Molecule Type 2020 & 2033
- Table 55: Global Single Use Bioreactor Industry Revenue Million Forecast, by End User 2020 & 2033
- Table 56: Global Single Use Bioreactor Industry Volume K Units Forecast, by End User 2020 & 2033
- Table 57: Global Single Use Bioreactor Industry Revenue Million Forecast, by Country 2020 & 2033
- Table 58: Global Single Use Bioreactor Industry Volume K Units Forecast, by Country 2020 & 2033
- Table 59: China Single Use Bioreactor Industry Revenue (Million) Forecast, by Application 2020 & 2033
- Table 60: China Single Use Bioreactor Industry Volume (K Units) Forecast, by Application 2020 & 2033
- Table 61: Japan Single Use Bioreactor Industry Revenue (Million) Forecast, by Application 2020 & 2033
- Table 62: Japan Single Use Bioreactor Industry Volume (K Units) Forecast, by Application 2020 & 2033
- Table 63: India Single Use Bioreactor Industry Revenue (Million) Forecast, by Application 2020 & 2033
- Table 64: India Single Use Bioreactor Industry Volume (K Units) Forecast, by Application 2020 & 2033
- Table 65: Australia Single Use Bioreactor Industry Revenue (Million) Forecast, by Application 2020 & 2033
- Table 66: Australia Single Use Bioreactor Industry Volume (K Units) Forecast, by Application 2020 & 2033
- Table 67: South Korea Single Use Bioreactor Industry Revenue (Million) Forecast, by Application 2020 & 2033
- Table 68: South Korea Single Use Bioreactor Industry Volume (K Units) Forecast, by Application 2020 & 2033
- Table 69: Rest of Asia Pacific Single Use Bioreactor Industry Revenue (Million) Forecast, by Application 2020 & 2033
- Table 70: Rest of Asia Pacific Single Use Bioreactor Industry Volume (K Units) Forecast, by Application 2020 & 2033
- Table 71: Global Single Use Bioreactor Industry Revenue Million Forecast, by Type of Product 2020 & 2033
- Table 72: Global Single Use Bioreactor Industry Volume K Units Forecast, by Type of Product 2020 & 2033
- Table 73: Global Single Use Bioreactor Industry Revenue Million Forecast, by Cell Type 2020 & 2033
- Table 74: Global Single Use Bioreactor Industry Volume K Units Forecast, by Cell Type 2020 & 2033
- Table 75: Global Single Use Bioreactor Industry Revenue Million Forecast, by Molecule Type 2020 & 2033
- Table 76: Global Single Use Bioreactor Industry Volume K Units Forecast, by Molecule Type 2020 & 2033
- Table 77: Global Single Use Bioreactor Industry Revenue Million Forecast, by End User 2020 & 2033
- Table 78: Global Single Use Bioreactor Industry Volume K Units Forecast, by End User 2020 & 2033
- Table 79: Global Single Use Bioreactor Industry Revenue Million Forecast, by Country 2020 & 2033
- Table 80: Global Single Use Bioreactor Industry Volume K Units Forecast, by Country 2020 & 2033
- Table 81: GCC Single Use Bioreactor Industry Revenue (Million) Forecast, by Application 2020 & 2033
- Table 82: GCC Single Use Bioreactor Industry Volume (K Units) Forecast, by Application 2020 & 2033
- Table 83: South Africa Single Use Bioreactor Industry Revenue (Million) Forecast, by Application 2020 & 2033
- Table 84: South Africa Single Use Bioreactor Industry Volume (K Units) Forecast, by Application 2020 & 2033
- Table 85: Rest of Middle East and Africa Single Use Bioreactor Industry Revenue (Million) Forecast, by Application 2020 & 2033
- Table 86: Rest of Middle East and Africa Single Use Bioreactor Industry Volume (K Units) Forecast, by Application 2020 & 2033
- Table 87: Global Single Use Bioreactor Industry Revenue Million Forecast, by Type of Product 2020 & 2033
- Table 88: Global Single Use Bioreactor Industry Volume K Units Forecast, by Type of Product 2020 & 2033
- Table 89: Global Single Use Bioreactor Industry Revenue Million Forecast, by Cell Type 2020 & 2033
- Table 90: Global Single Use Bioreactor Industry Volume K Units Forecast, by Cell Type 2020 & 2033
- Table 91: Global Single Use Bioreactor Industry Revenue Million Forecast, by Molecule Type 2020 & 2033
- Table 92: Global Single Use Bioreactor Industry Volume K Units Forecast, by Molecule Type 2020 & 2033
- Table 93: Global Single Use Bioreactor Industry Revenue Million Forecast, by End User 2020 & 2033
- Table 94: Global Single Use Bioreactor Industry Volume K Units Forecast, by End User 2020 & 2033
- Table 95: Global Single Use Bioreactor Industry Revenue Million Forecast, by Country 2020 & 2033
- Table 96: Global Single Use Bioreactor Industry Volume K Units Forecast, by Country 2020 & 2033
- Table 97: Brazil Single Use Bioreactor Industry Revenue (Million) Forecast, by Application 2020 & 2033
- Table 98: Brazil Single Use Bioreactor Industry Volume (K Units) Forecast, by Application 2020 & 2033
- Table 99: Argentina Single Use Bioreactor Industry Revenue (Million) Forecast, by Application 2020 & 2033
- Table 100: Argentina Single Use Bioreactor Industry Volume (K Units) Forecast, by Application 2020 & 2033
- Table 101: Rest of South America Single Use Bioreactor Industry Revenue (Million) Forecast, by Application 2020 & 2033
- Table 102: Rest of South America Single Use Bioreactor Industry Volume (K Units) Forecast, by Application 2020 & 2033
Frequently Asked Questions
1. What is the projected Compound Annual Growth Rate (CAGR) of the Single Use Bioreactor Industry?
The projected CAGR is approximately 9.70%.
2. Which companies are prominent players in the Single Use Bioreactor Industry?
Key companies in the market include Danaher (Cytiva), Merck KGaA, Distek Inc, Celltainer, Pall Corporation, Eppendorf SE, Sartorius AG, Thermo Fisher Scientific, OmniBRx Biotechnologies, ABEC.
3. What are the main segments of the Single Use Bioreactor Industry?
The market segments include Type of Product, Cell Type, Molecule Type, End User.
4. Can you provide details about the market size?
The market size is estimated to be USD 1.47 Million as of 2022.
5. What are some drivers contributing to market growth?
Rapid Adoption of Single-use Technologies (SUTs) by the Industry; Cost Effectiveness and Lower Downtime; New Product Launches.
6. What are the notable trends driving market growth?
Monoclonal Antibodies Segment is Anticipated to Witness Growth.
7. Are there any restraints impacting market growth?
High Regular Recurring Expenses; Issues with Meeting the Standards of Good Manufacturing Practices.
8. Can you provide examples of recent developments in the market?
In June 2022, mAbxience equipped their cGMP (Current Good Manufacturing Practice) facility in León, Spain with an additional ABEC 4,000L CSR bioreactor, following the successful delivery of the first 4,000L CSR bioreactor in 2021. mAbxience selected ABEC's single-use technology to increase its CDMO (contract development and manufacturing organization) business and capacity.
9. What pricing options are available for accessing the report?
Pricing options include single-user, multi-user, and enterprise licenses priced at USD 4750, USD 5250, and USD 8750 respectively.
10. Is the market size provided in terms of value or volume?
The market size is provided in terms of value, measured in Million and volume, measured in K Units.
11. Are there any specific market keywords associated with the report?
Yes, the market keyword associated with the report is "Single Use Bioreactor Industry," which aids in identifying and referencing the specific market segment covered.
12. How do I determine which pricing option suits my needs best?
The pricing options vary based on user requirements and access needs. Individual users may opt for single-user licenses, while businesses requiring broader access may choose multi-user or enterprise licenses for cost-effective access to the report.
13. Are there any additional resources or data provided in the Single Use Bioreactor Industry report?
While the report offers comprehensive insights, it's advisable to review the specific contents or supplementary materials provided to ascertain if additional resources or data are available.
14. How can I stay updated on further developments or reports in the Single Use Bioreactor Industry?
To stay informed about further developments, trends, and reports in the Single Use Bioreactor Industry, consider subscribing to industry newsletters, following relevant companies and organizations, or regularly checking reputable industry news sources and publications.
Methodology
Step 1 - Identification of Relevant Samples Size from Population Database


Step 2 - Approaches for Defining Global Market Size (Value, Volume* & Price*)

Note*: In applicable scenarios
Step 3 - Data Sources
Primary Research
- Web Analytics
- Survey Reports
- Research Institute
- Latest Research Reports
- Opinion Leaders
Secondary Research
- Annual Reports
- White Paper
- Latest Press Release
- Industry Association
- Paid Database
- Investor Presentations

Step 4 - Data Triangulation
Involves using different sources of information in order to increase the validity of a study
These sources are likely to be stakeholders in a program - participants, other researchers, program staff, other community members, and so on.
Then we put all data in single framework & apply various statistical tools to find out the dynamic on the market.
During the analysis stage, feedback from the stakeholder groups would be compared to determine areas of agreement as well as areas of divergence