

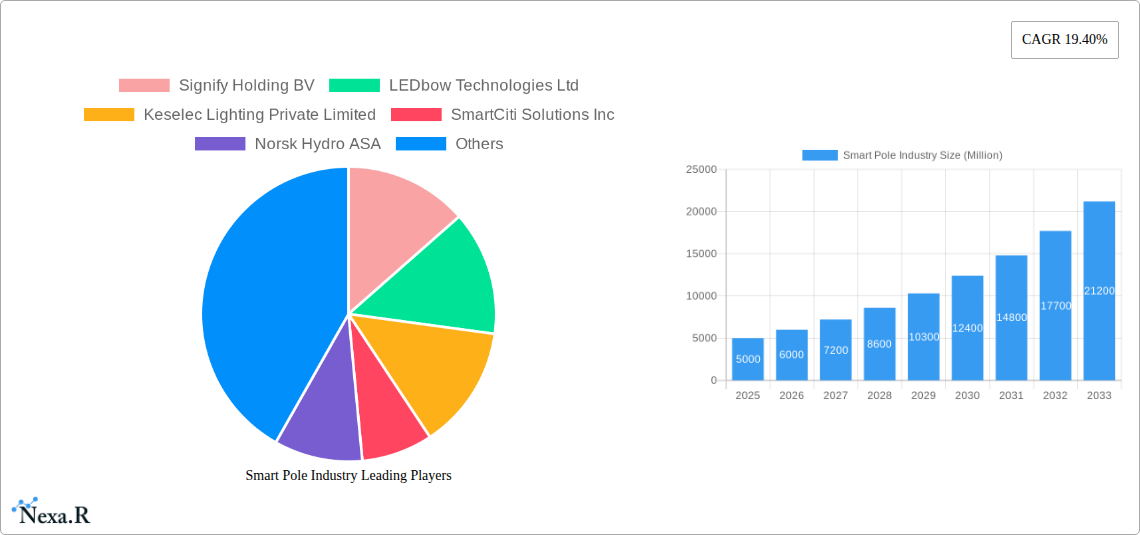
Key Insights
The smart pole market is experiencing robust growth, driven by the increasing need for efficient urban infrastructure and smart city initiatives globally. A 19.40% CAGR indicates a significant expansion from 2019 to 2033, projected to reach substantial value by 2033. While the exact 2025 market size (XX) is unspecified, considering the CAGR and assuming a reasonable base year value, we can infer significant market volume. Key drivers include the rising adoption of smart city projects, the demand for improved public safety and traffic management, and the increasing integration of IoT devices for data collection and analysis. The market is segmented by product type (lighting, connectivity, sensors, data analytics), application (smart lighting, traffic management, surveillance, environmental sensing), and end-user (municipalities, governments, commercial entities). North America and Europe currently hold significant market share, driven by early adoption and well-developed infrastructure. However, the Asia-Pacific region shows immense growth potential due to rapid urbanization and government investments in smart city development. Competitive pressures exist among established players like Signify Holding BV and emerging companies focusing on innovative solutions. While data constraints restrict precise numerical projections, the overall market trajectory suggests continued and accelerated expansion in the coming years, fuelled by technological advancements and increasing demand.
The restraints to market growth include high initial investment costs associated with smart pole deployment and integration, concerns regarding data privacy and security, and the need for standardized interoperability protocols across different smart city systems. However, these challenges are being addressed through technological advancements, cost reductions in hardware and software, and increased collaboration among stakeholders to establish industry standards. The ongoing evolution of 5G networks and advancements in sensor technologies are expected to significantly propel the growth of the smart pole market, unlocking new possibilities for data-driven decision making in urban planning and management. The focus is shifting towards incorporating more sophisticated data analytics capabilities into smart poles to extract actionable insights from collected data and enhance operational efficiency.
This comprehensive report provides a detailed analysis of the Smart Pole industry, encompassing market dynamics, growth trends, regional insights, and competitive landscapes from 2019 to 2033. The report covers the parent market of Smart City Infrastructure and the child market of Smart Poles, providing a granular understanding of this rapidly evolving sector. With a base year of 2025 and a forecast period extending to 2033, this report is an invaluable resource for industry professionals, investors, and strategic planners. The total market size in 2025 is estimated at xx Million and is projected to reach xx Million by 2033.
Smart Pole Industry Market Dynamics & Structure
The Smart Pole market, a key component of smart city infrastructure, is experiencing dynamic growth fueled by technological advancements and increasing urbanization. Market concentration is currently moderate, with several key players vying for market share. Technological innovation, particularly in areas like 5G connectivity, sensor integration, and data analytics, is a major driver. Regulatory frameworks, while still evolving, are increasingly supportive of smart city initiatives, further accelerating adoption. Competitive substitutes are limited, with traditional lighting poles offering far fewer functionalities.
- Market Concentration: Moderately concentrated, with top 5 players holding an estimated xx% market share in 2025.
- Technological Innovation: Rapid advancements in IoT, 5G, AI, and edge computing are driving product innovation and improved data capabilities.
- Regulatory Landscape: Supportive government policies and smart city initiatives are boosting market growth in key regions.
- Competitive Substitutes: Limited, with traditional lighting poles unable to match the functionality of smart poles.
- M&A Activity: A moderate number of M&A deals (xx in 2024) suggest consolidation within the industry, with larger players acquiring smaller companies to expand their product portfolios and geographic reach.
- End-User Demographics: Municipalities and governments are the primary end-users, but commercial entities and private industries are showing increasing adoption.
Smart Pole Industry Growth Trends & Insights
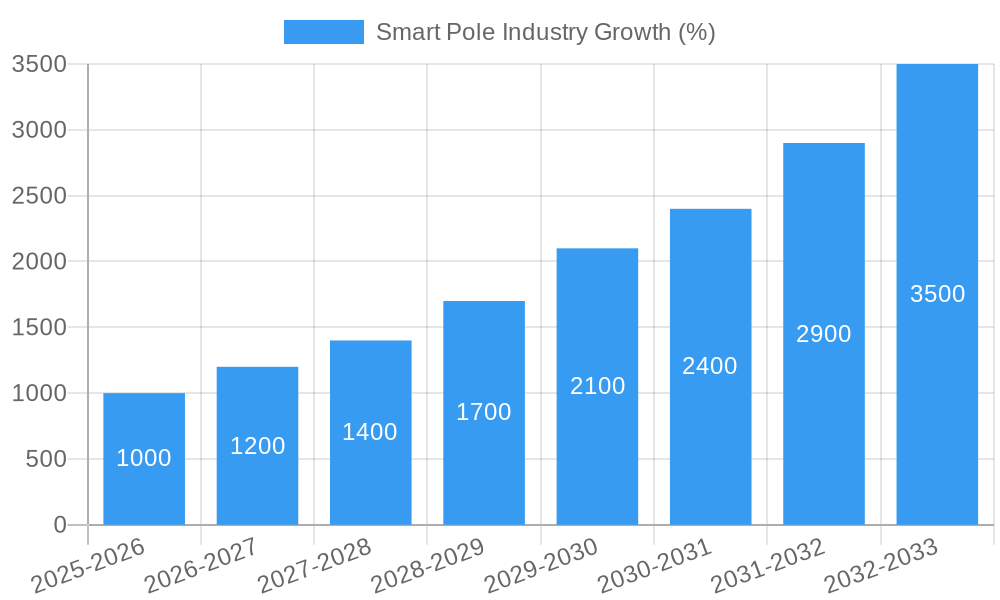
The global smart pole market is exhibiting robust growth, driven by the increasing demand for efficient and sustainable infrastructure solutions in urban areas. The market size has grown significantly from xx Million in 2019 to an estimated xx Million in 2025. This trend is expected to continue, with a projected Compound Annual Growth Rate (CAGR) of xx% during the forecast period (2025-2033). Market penetration is currently at xx% in developed nations and is expected to increase significantly in developing economies as smart city initiatives gain momentum. Technological disruptions, including the integration of 5G technology and advanced sensor capabilities, are fueling this expansion. Consumer behavior shifts towards sustainability and smart city solutions further contribute to the growth trajectory.
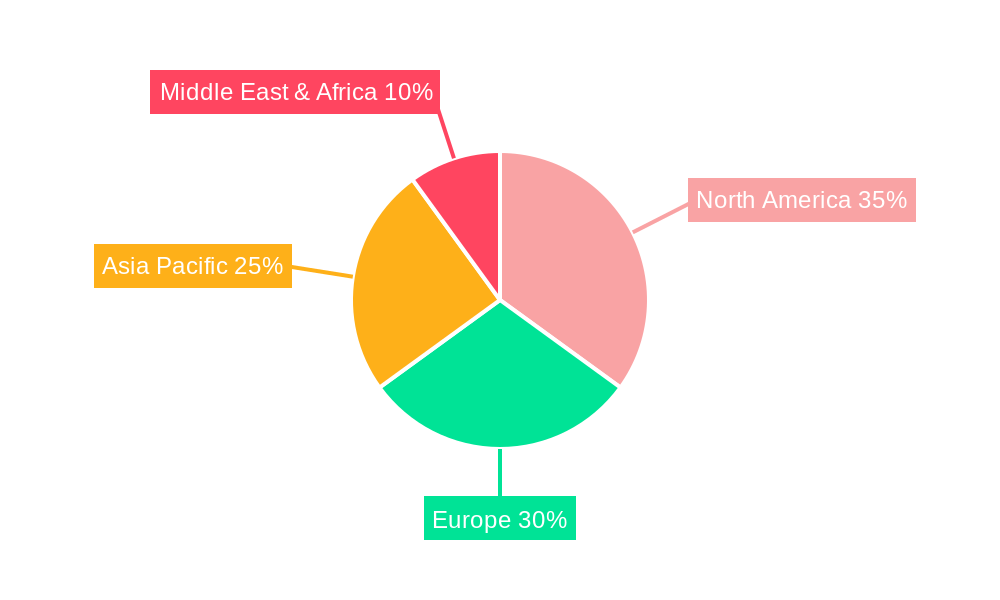
Dominant Regions, Countries, or Segments in Smart Pole Industry
North America and Europe currently dominate the smart pole market, owing to early adoption of smart city technologies and robust government support. However, Asia-Pacific is witnessing the fastest growth, driven by rapid urbanization and increasing investments in smart city infrastructure. Within the segment breakdown:
By Product Type:
- Lighting: Remains the largest segment, with a market share of xx% in 2025, driven by the replacement of traditional lighting with energy-efficient LED smart poles.
- Connectivity: Growing rapidly (xx% CAGR) due to increased demand for high-speed internet access and 5G network deployment.
- Sensors: Significant growth potential, as sensor integration expands beyond basic environmental monitoring to encompass traffic management, security, and air quality monitoring.
- Data Analytics: Rapidly emerging segment, offering valuable insights from collected data for improved urban planning and resource management.
By Application:
- Smart Lighting: Largest application segment, accounting for xx% of the market in 2025.
- Traffic Management: High growth potential due to the increasing need for intelligent transportation systems.
- Surveillance: Significant market share, driven by increasing security concerns in urban areas.
- Environmental Sensing: Growing steadily as municipalities prioritize environmental monitoring and sustainability.
By End User:
- Municipalities & Governments: Largest end-user segment, driven by government initiatives and funding for smart city projects.
Smart Pole Industry Product Landscape
Smart poles are evolving beyond simple lighting fixtures, integrating advanced technologies such as 5G connectivity, various sensors (environmental, traffic, security), and data analytics platforms. Key innovations include self-powered poles, improved energy efficiency, advanced lighting control systems, and integrated security cameras. Unique selling propositions focus on customized solutions, ease of deployment, and seamless data integration with existing city infrastructure. These advancements significantly improve efficiency, reduce operational costs, and enhance safety and security in urban environments.
Key Drivers, Barriers & Challenges in Smart Pole Industry
Key Drivers:
- Increasing urbanization and need for efficient urban management.
- Government initiatives promoting smart city development.
- Technological advancements in IoT, 5G, and data analytics.
- Growing demand for sustainable and energy-efficient infrastructure.
Challenges & Restraints:
- High initial investment costs can be a barrier for smaller municipalities.
- Concerns around data privacy and security are significant.
- Supply chain disruptions and component shortages can impact deployment.
- Lack of standardization and interoperability across different smart pole systems.
Emerging Opportunities in Smart Pole Industry
Untapped markets in developing economies present significant opportunities for growth. Integration of new sensor technologies (e.g., air quality monitoring, noise pollution detection) and advanced analytics capabilities offer promising avenues for innovation. Expanding into niche applications, such as electric vehicle charging stations or smart waste management systems, further enhances the market potential. The growing focus on sustainable urban development and environmental monitoring will continue to drive demand.
Growth Accelerators in the Smart Pole Industry Industry
Technological breakthroughs in areas such as energy harvesting, advanced materials, and AI-powered analytics will accelerate market growth. Strategic partnerships between technology providers, infrastructure developers, and municipalities are crucial for successful deployments. Expansion into new geographic markets, especially in developing countries with rapid urbanization, represents a significant opportunity. Furthermore, improved standardization and interoperability of smart pole systems will facilitate wider adoption.
Key Players Shaping the Smart Pole Industry Market
- Signify Holding BV
- LEDbow Technologies Ltd
- Keselec Lighting Private Limited
- SmartCiti Solutions Inc
- Norsk Hydro ASA
- HUB Group
- Lumca Inc
- Efftronics Systems Pvt Ltd
- Shanghai Sansi Electronic Engineering Co Ltd
- American Tower Corporation
- ELKO EP
- Energasia Smart Poles
- Valmont Structures Pvt Ltd
- ENE HUB Pty Ltd
- Streetscape International
- Iram Technologies Pvt Ltd
Notable Milestones in Smart Pole Industry Sector
- July 2022: ComptekTechnologies collaborates with ZenFiNetworks, CityBridge Consortium, and Antenna Design to develop Link5G smart poles, boosting 5G infrastructure deployment and driving market growth.
- July 2021: Johnson City Commission installs smart poles funded by a USD 335,000 TVA grant, demonstrating successful public-private partnerships and showcasing the versatility of smart pole applications.
In-Depth Smart Pole Industry Market Outlook
The future of the smart pole market is bright, driven by continued technological advancements, increasing urbanization, and supportive government policies. Strategic partnerships and innovative applications will be critical for success. The market is poised for substantial expansion, with significant opportunities for companies to capitalize on the growing demand for sustainable, efficient, and data-driven urban infrastructure. The focus on smart city initiatives globally guarantees long-term growth and strong market potential.
Smart Pole Industry Segmentation
- 1. Production Analysis
- 2. Consumption Analysis
- 3. Import Market Analysis (Value & Volume)
- 4. Export Market Analysis (Value & Volume)
- 5. Price Trend Analysis
Smart Pole Industry Segmentation By Geography
- 1. North America
- 2. Europe
- 3. Asia Pacific
- 4. Rest of the World
Smart Pole Industry REPORT HIGHLIGHTS
| Aspects | Details |
|---|---|
| Study Period | 2019-2033 |
| Base Year | 2024 |
| Estimated Year | 2025 |
| Forecast Period | 2025-2033 |
| Historical Period | 2019-2024 |
| Growth Rate | CAGR of 19.40% from 2019-2033 |
| Segmentation |
|
Table of Contents
- 1. Introduction
- 1.1. Research Scope
- 1.2. Market Segmentation
- 1.3. Research Methodology
- 1.4. Definitions and Assumptions
- 2. Executive Summary
- 2.1. Introduction
- 3. Market Dynamics
- 3.1. Introduction
- 3.2. Market Drivers
- 3.2.1. Increasing Need for Reducing Traffic Jams and Preventing Accidents; Growing Initiative by Various Government for Smart Cities
- 3.3. Market Restrains
- 3.3.1. Rising Complexities to Implement Transition from Manual to Software Testing Process
- 3.4. Market Trends
- 3.4.1. Growing Smart City Initiatives by Various Governments
- 4. Market Factor Analysis
- 4.1. Porters Five Forces
- 4.2. Supply/Value Chain
- 4.3. PESTEL analysis
- 4.4. Market Entropy
- 4.5. Patent/Trademark Analysis
- 5. Global Smart Pole Industry Analysis, Insights and Forecast, 2019-2031
- 5.1. Market Analysis, Insights and Forecast - by Production Analysis
- 5.2. Market Analysis, Insights and Forecast - by Consumption Analysis
- 5.3. Market Analysis, Insights and Forecast - by Import Market Analysis (Value & Volume)
- 5.4. Market Analysis, Insights and Forecast - by Export Market Analysis (Value & Volume)
- 5.5. Market Analysis, Insights and Forecast - by Price Trend Analysis
- 5.6. Market Analysis, Insights and Forecast - by Region
- 5.6.1. North America
- 5.6.2. Europe
- 5.6.3. Asia Pacific
- 5.6.4. Rest of the World
- 5.1. Market Analysis, Insights and Forecast - by Production Analysis
- 6. North America Smart Pole Industry Analysis, Insights and Forecast, 2019-2031
- 6.1. Market Analysis, Insights and Forecast - by Production Analysis
- 6.2. Market Analysis, Insights and Forecast - by Consumption Analysis
- 6.3. Market Analysis, Insights and Forecast - by Import Market Analysis (Value & Volume)
- 6.4. Market Analysis, Insights and Forecast - by Export Market Analysis (Value & Volume)
- 6.5. Market Analysis, Insights and Forecast - by Price Trend Analysis
- 6.1. Market Analysis, Insights and Forecast - by Production Analysis
- 7. Europe Smart Pole Industry Analysis, Insights and Forecast, 2019-2031
- 7.1. Market Analysis, Insights and Forecast - by Production Analysis
- 7.2. Market Analysis, Insights and Forecast - by Consumption Analysis
- 7.3. Market Analysis, Insights and Forecast - by Import Market Analysis (Value & Volume)
- 7.4. Market Analysis, Insights and Forecast - by Export Market Analysis (Value & Volume)
- 7.5. Market Analysis, Insights and Forecast - by Price Trend Analysis
- 7.1. Market Analysis, Insights and Forecast - by Production Analysis
- 8. Asia Pacific Smart Pole Industry Analysis, Insights and Forecast, 2019-2031
- 8.1. Market Analysis, Insights and Forecast - by Production Analysis
- 8.2. Market Analysis, Insights and Forecast - by Consumption Analysis
- 8.3. Market Analysis, Insights and Forecast - by Import Market Analysis (Value & Volume)
- 8.4. Market Analysis, Insights and Forecast - by Export Market Analysis (Value & Volume)
- 8.5. Market Analysis, Insights and Forecast - by Price Trend Analysis
- 8.1. Market Analysis, Insights and Forecast - by Production Analysis
- 9. Rest of the World Smart Pole Industry Analysis, Insights and Forecast, 2019-2031
- 9.1. Market Analysis, Insights and Forecast - by Production Analysis
- 9.2. Market Analysis, Insights and Forecast - by Consumption Analysis
- 9.3. Market Analysis, Insights and Forecast - by Import Market Analysis (Value & Volume)
- 9.4. Market Analysis, Insights and Forecast - by Export Market Analysis (Value & Volume)
- 9.5. Market Analysis, Insights and Forecast - by Price Trend Analysis
- 9.1. Market Analysis, Insights and Forecast - by Production Analysis
- 10. North America Smart Pole Industry Analysis, Insights and Forecast, 2019-2031
- 10.1. Market Analysis, Insights and Forecast - By Country/Sub-region
- 10.1.1 United States
- 10.1.2 Canada
- 11. Europe Smart Pole Industry Analysis, Insights and Forecast, 2019-2031
- 11.1. Market Analysis, Insights and Forecast - By Country/Sub-region
- 11.1.1 United Kingdom
- 11.1.2 Germany
- 11.1.3 France
- 11.1.4 Italy
- 11.1.5 Netherlands
- 11.1.6 Rest of Europe
- 12. Asia Pacific Smart Pole Industry Analysis, Insights and Forecast, 2019-2031
- 12.1. Market Analysis, Insights and Forecast - By Country/Sub-region
- 12.1.1 India
- 12.1.2 China
- 12.1.3 Japan
- 12.1.4 South Korea
- 12.1.5 Rest of Asia Pacific
- 13. Asia Pacific Smart Pole Industry Analysis, Insights and Forecast, 2019-2031
- 13.1. Market Analysis, Insights and Forecast - By Country/Sub-region
- 13.1.1 China
- 13.1.2 India
- 13.1.3 Japan
- 13.1.4 Australia
- 13.1.5 Rest of Asia Pacific
- 14. Middle East & Africa Smart Pole Industry Analysis, Insights and Forecast, 2019-2031
- 14.1. Market Analysis, Insights and Forecast - By Country/Sub-region
- 14.1.1 UAE
- 14.1.2 South Africa
- 14.1.3 Saudi Arabia
- 14.1.4 Rest of MEA
- 15. Competitive Analysis
- 15.1. Global Market Share Analysis 2024
- 15.2. Company Profiles
- 15.2.1 Signify Holding BV
- 15.2.1.1. Overview
- 15.2.1.2. Products
- 15.2.1.3. SWOT Analysis
- 15.2.1.4. Recent Developments
- 15.2.1.5. Financials (Based on Availability)
- 15.2.2 LEDbow Technologies Ltd
- 15.2.2.1. Overview
- 15.2.2.2. Products
- 15.2.2.3. SWOT Analysis
- 15.2.2.4. Recent Developments
- 15.2.2.5. Financials (Based on Availability)
- 15.2.3 Keselec Lighting Private Limited
- 15.2.3.1. Overview
- 15.2.3.2. Products
- 15.2.3.3. SWOT Analysis
- 15.2.3.4. Recent Developments
- 15.2.3.5. Financials (Based on Availability)
- 15.2.4 SmartCiti Solutions Inc
- 15.2.4.1. Overview
- 15.2.4.2. Products
- 15.2.4.3. SWOT Analysis
- 15.2.4.4. Recent Developments
- 15.2.4.5. Financials (Based on Availability)
- 15.2.5 Norsk Hydro ASA
- 15.2.5.1. Overview
- 15.2.5.2. Products
- 15.2.5.3. SWOT Analysis
- 15.2.5.4. Recent Developments
- 15.2.5.5. Financials (Based on Availability)
- 15.2.6 HUB Group
- 15.2.6.1. Overview
- 15.2.6.2. Products
- 15.2.6.3. SWOT Analysis
- 15.2.6.4. Recent Developments
- 15.2.6.5. Financials (Based on Availability)
- 15.2.7 Lumca Inc
- 15.2.7.1. Overview
- 15.2.7.2. Products
- 15.2.7.3. SWOT Analysis
- 15.2.7.4. Recent Developments
- 15.2.7.5. Financials (Based on Availability)
- 15.2.8 Efftronics Systems Pvt Ltd
- 15.2.8.1. Overview
- 15.2.8.2. Products
- 15.2.8.3. SWOT Analysis
- 15.2.8.4. Recent Developments
- 15.2.8.5. Financials (Based on Availability)
- 15.2.9 Shanghai Sansi Electronic Engineering Co Ltd
- 15.2.9.1. Overview
- 15.2.9.2. Products
- 15.2.9.3. SWOT Analysis
- 15.2.9.4. Recent Developments
- 15.2.9.5. Financials (Based on Availability)
- 15.2.10 American Tower Corporation
- 15.2.10.1. Overview
- 15.2.10.2. Products
- 15.2.10.3. SWOT Analysis
- 15.2.10.4. Recent Developments
- 15.2.10.5. Financials (Based on Availability)
- 15.2.11 ELKO EP
- 15.2.11.1. Overview
- 15.2.11.2. Products
- 15.2.11.3. SWOT Analysis
- 15.2.11.4. Recent Developments
- 15.2.11.5. Financials (Based on Availability)
- 15.2.12 Energasia Smart Poles
- 15.2.12.1. Overview
- 15.2.12.2. Products
- 15.2.12.3. SWOT Analysis
- 15.2.12.4. Recent Developments
- 15.2.12.5. Financials (Based on Availability)
- 15.2.13 Valmont Structures Pvt Ltd
- 15.2.13.1. Overview
- 15.2.13.2. Products
- 15.2.13.3. SWOT Analysis
- 15.2.13.4. Recent Developments
- 15.2.13.5. Financials (Based on Availability)
- 15.2.14 ENE HUB Pty Ltd*List Not Exhaustive
- 15.2.14.1. Overview
- 15.2.14.2. Products
- 15.2.14.3. SWOT Analysis
- 15.2.14.4. Recent Developments
- 15.2.14.5. Financials (Based on Availability)
- 15.2.15 Streetscape International
- 15.2.15.1. Overview
- 15.2.15.2. Products
- 15.2.15.3. SWOT Analysis
- 15.2.15.4. Recent Developments
- 15.2.15.5. Financials (Based on Availability)
- 15.2.16 Iram Technologies Pvt Ltd
- 15.2.16.1. Overview
- 15.2.16.2. Products
- 15.2.16.3. SWOT Analysis
- 15.2.16.4. Recent Developments
- 15.2.16.5. Financials (Based on Availability)
- 15.2.1 Signify Holding BV
List of Figures
- Figure 1: Global Smart Pole Industry Revenue Breakdown (Million, %) by Region 2024 & 2032
- Figure 2: North America Smart Pole Industry Revenue (Million), by Country 2024 & 2032
- Figure 3: North America Smart Pole Industry Revenue Share (%), by Country 2024 & 2032
- Figure 4: Europe Smart Pole Industry Revenue (Million), by Country 2024 & 2032
- Figure 5: Europe Smart Pole Industry Revenue Share (%), by Country 2024 & 2032
- Figure 6: Asia Pacific Smart Pole Industry Revenue (Million), by Country 2024 & 2032
- Figure 7: Asia Pacific Smart Pole Industry Revenue Share (%), by Country 2024 & 2032
- Figure 8: Asia Pacific Smart Pole Industry Revenue (Million), by Country 2024 & 2032
- Figure 9: Asia Pacific Smart Pole Industry Revenue Share (%), by Country 2024 & 2032
- Figure 10: Middle East & Africa Smart Pole Industry Revenue (Million), by Country 2024 & 2032
- Figure 11: Middle East & Africa Smart Pole Industry Revenue Share (%), by Country 2024 & 2032
- Figure 12: North America Smart Pole Industry Revenue (Million), by Production Analysis 2024 & 2032
- Figure 13: North America Smart Pole Industry Revenue Share (%), by Production Analysis 2024 & 2032
- Figure 14: North America Smart Pole Industry Revenue (Million), by Consumption Analysis 2024 & 2032
- Figure 15: North America Smart Pole Industry Revenue Share (%), by Consumption Analysis 2024 & 2032
- Figure 16: North America Smart Pole Industry Revenue (Million), by Import Market Analysis (Value & Volume) 2024 & 2032
- Figure 17: North America Smart Pole Industry Revenue Share (%), by Import Market Analysis (Value & Volume) 2024 & 2032
- Figure 18: North America Smart Pole Industry Revenue (Million), by Export Market Analysis (Value & Volume) 2024 & 2032
- Figure 19: North America Smart Pole Industry Revenue Share (%), by Export Market Analysis (Value & Volume) 2024 & 2032
- Figure 20: North America Smart Pole Industry Revenue (Million), by Price Trend Analysis 2024 & 2032
- Figure 21: North America Smart Pole Industry Revenue Share (%), by Price Trend Analysis 2024 & 2032
- Figure 22: North America Smart Pole Industry Revenue (Million), by Country 2024 & 2032
- Figure 23: North America Smart Pole Industry Revenue Share (%), by Country 2024 & 2032
- Figure 24: Europe Smart Pole Industry Revenue (Million), by Production Analysis 2024 & 2032
- Figure 25: Europe Smart Pole Industry Revenue Share (%), by Production Analysis 2024 & 2032
- Figure 26: Europe Smart Pole Industry Revenue (Million), by Consumption Analysis 2024 & 2032
- Figure 27: Europe Smart Pole Industry Revenue Share (%), by Consumption Analysis 2024 & 2032
- Figure 28: Europe Smart Pole Industry Revenue (Million), by Import Market Analysis (Value & Volume) 2024 & 2032
- Figure 29: Europe Smart Pole Industry Revenue Share (%), by Import Market Analysis (Value & Volume) 2024 & 2032
- Figure 30: Europe Smart Pole Industry Revenue (Million), by Export Market Analysis (Value & Volume) 2024 & 2032
- Figure 31: Europe Smart Pole Industry Revenue Share (%), by Export Market Analysis (Value & Volume) 2024 & 2032
- Figure 32: Europe Smart Pole Industry Revenue (Million), by Price Trend Analysis 2024 & 2032
- Figure 33: Europe Smart Pole Industry Revenue Share (%), by Price Trend Analysis 2024 & 2032
- Figure 34: Europe Smart Pole Industry Revenue (Million), by Country 2024 & 2032
- Figure 35: Europe Smart Pole Industry Revenue Share (%), by Country 2024 & 2032
- Figure 36: Asia Pacific Smart Pole Industry Revenue (Million), by Production Analysis 2024 & 2032
- Figure 37: Asia Pacific Smart Pole Industry Revenue Share (%), by Production Analysis 2024 & 2032
- Figure 38: Asia Pacific Smart Pole Industry Revenue (Million), by Consumption Analysis 2024 & 2032
- Figure 39: Asia Pacific Smart Pole Industry Revenue Share (%), by Consumption Analysis 2024 & 2032
- Figure 40: Asia Pacific Smart Pole Industry Revenue (Million), by Import Market Analysis (Value & Volume) 2024 & 2032
- Figure 41: Asia Pacific Smart Pole Industry Revenue Share (%), by Import Market Analysis (Value & Volume) 2024 & 2032
- Figure 42: Asia Pacific Smart Pole Industry Revenue (Million), by Export Market Analysis (Value & Volume) 2024 & 2032
- Figure 43: Asia Pacific Smart Pole Industry Revenue Share (%), by Export Market Analysis (Value & Volume) 2024 & 2032
- Figure 44: Asia Pacific Smart Pole Industry Revenue (Million), by Price Trend Analysis 2024 & 2032
- Figure 45: Asia Pacific Smart Pole Industry Revenue Share (%), by Price Trend Analysis 2024 & 2032
- Figure 46: Asia Pacific Smart Pole Industry Revenue (Million), by Country 2024 & 2032
- Figure 47: Asia Pacific Smart Pole Industry Revenue Share (%), by Country 2024 & 2032
- Figure 48: Rest of the World Smart Pole Industry Revenue (Million), by Production Analysis 2024 & 2032
- Figure 49: Rest of the World Smart Pole Industry Revenue Share (%), by Production Analysis 2024 & 2032
- Figure 50: Rest of the World Smart Pole Industry Revenue (Million), by Consumption Analysis 2024 & 2032
- Figure 51: Rest of the World Smart Pole Industry Revenue Share (%), by Consumption Analysis 2024 & 2032
- Figure 52: Rest of the World Smart Pole Industry Revenue (Million), by Import Market Analysis (Value & Volume) 2024 & 2032
- Figure 53: Rest of the World Smart Pole Industry Revenue Share (%), by Import Market Analysis (Value & Volume) 2024 & 2032
- Figure 54: Rest of the World Smart Pole Industry Revenue (Million), by Export Market Analysis (Value & Volume) 2024 & 2032
- Figure 55: Rest of the World Smart Pole Industry Revenue Share (%), by Export Market Analysis (Value & Volume) 2024 & 2032
- Figure 56: Rest of the World Smart Pole Industry Revenue (Million), by Price Trend Analysis 2024 & 2032
- Figure 57: Rest of the World Smart Pole Industry Revenue Share (%), by Price Trend Analysis 2024 & 2032
- Figure 58: Rest of the World Smart Pole Industry Revenue (Million), by Country 2024 & 2032
- Figure 59: Rest of the World Smart Pole Industry Revenue Share (%), by Country 2024 & 2032
List of Tables
- Table 1: Global Smart Pole Industry Revenue Million Forecast, by Region 2019 & 2032
- Table 2: Global Smart Pole Industry Revenue Million Forecast, by Production Analysis 2019 & 2032
- Table 3: Global Smart Pole Industry Revenue Million Forecast, by Consumption Analysis 2019 & 2032
- Table 4: Global Smart Pole Industry Revenue Million Forecast, by Import Market Analysis (Value & Volume) 2019 & 2032
- Table 5: Global Smart Pole Industry Revenue Million Forecast, by Export Market Analysis (Value & Volume) 2019 & 2032
- Table 6: Global Smart Pole Industry Revenue Million Forecast, by Price Trend Analysis 2019 & 2032
- Table 7: Global Smart Pole Industry Revenue Million Forecast, by Region 2019 & 2032
- Table 8: Global Smart Pole Industry Revenue Million Forecast, by Country 2019 & 2032
- Table 9: United States Smart Pole Industry Revenue (Million) Forecast, by Application 2019 & 2032
- Table 10: Canada Smart Pole Industry Revenue (Million) Forecast, by Application 2019 & 2032
- Table 11: Global Smart Pole Industry Revenue Million Forecast, by Country 2019 & 2032
- Table 12: United Kingdom Smart Pole Industry Revenue (Million) Forecast, by Application 2019 & 2032
- Table 13: Germany Smart Pole Industry Revenue (Million) Forecast, by Application 2019 & 2032
- Table 14: France Smart Pole Industry Revenue (Million) Forecast, by Application 2019 & 2032
- Table 15: Italy Smart Pole Industry Revenue (Million) Forecast, by Application 2019 & 2032
- Table 16: Netherlands Smart Pole Industry Revenue (Million) Forecast, by Application 2019 & 2032
- Table 17: Rest of Europe Smart Pole Industry Revenue (Million) Forecast, by Application 2019 & 2032
- Table 18: Global Smart Pole Industry Revenue Million Forecast, by Country 2019 & 2032
- Table 19: India Smart Pole Industry Revenue (Million) Forecast, by Application 2019 & 2032
- Table 20: China Smart Pole Industry Revenue (Million) Forecast, by Application 2019 & 2032
- Table 21: Japan Smart Pole Industry Revenue (Million) Forecast, by Application 2019 & 2032
- Table 22: South Korea Smart Pole Industry Revenue (Million) Forecast, by Application 2019 & 2032
- Table 23: Rest of Asia Pacific Smart Pole Industry Revenue (Million) Forecast, by Application 2019 & 2032
- Table 24: Global Smart Pole Industry Revenue Million Forecast, by Country 2019 & 2032
- Table 25: China Smart Pole Industry Revenue (Million) Forecast, by Application 2019 & 2032
- Table 26: India Smart Pole Industry Revenue (Million) Forecast, by Application 2019 & 2032
- Table 27: Japan Smart Pole Industry Revenue (Million) Forecast, by Application 2019 & 2032
- Table 28: Australia Smart Pole Industry Revenue (Million) Forecast, by Application 2019 & 2032
- Table 29: Rest of Asia Pacific Smart Pole Industry Revenue (Million) Forecast, by Application 2019 & 2032
- Table 30: Global Smart Pole Industry Revenue Million Forecast, by Country 2019 & 2032
- Table 31: UAE Smart Pole Industry Revenue (Million) Forecast, by Application 2019 & 2032
- Table 32: South Africa Smart Pole Industry Revenue (Million) Forecast, by Application 2019 & 2032
- Table 33: Saudi Arabia Smart Pole Industry Revenue (Million) Forecast, by Application 2019 & 2032
- Table 34: Rest of MEA Smart Pole Industry Revenue (Million) Forecast, by Application 2019 & 2032
- Table 35: Global Smart Pole Industry Revenue Million Forecast, by Production Analysis 2019 & 2032
- Table 36: Global Smart Pole Industry Revenue Million Forecast, by Consumption Analysis 2019 & 2032
- Table 37: Global Smart Pole Industry Revenue Million Forecast, by Import Market Analysis (Value & Volume) 2019 & 2032
- Table 38: Global Smart Pole Industry Revenue Million Forecast, by Export Market Analysis (Value & Volume) 2019 & 2032
- Table 39: Global Smart Pole Industry Revenue Million Forecast, by Price Trend Analysis 2019 & 2032
- Table 40: Global Smart Pole Industry Revenue Million Forecast, by Country 2019 & 2032
- Table 41: Global Smart Pole Industry Revenue Million Forecast, by Production Analysis 2019 & 2032
- Table 42: Global Smart Pole Industry Revenue Million Forecast, by Consumption Analysis 2019 & 2032
- Table 43: Global Smart Pole Industry Revenue Million Forecast, by Import Market Analysis (Value & Volume) 2019 & 2032
- Table 44: Global Smart Pole Industry Revenue Million Forecast, by Export Market Analysis (Value & Volume) 2019 & 2032
- Table 45: Global Smart Pole Industry Revenue Million Forecast, by Price Trend Analysis 2019 & 2032
- Table 46: Global Smart Pole Industry Revenue Million Forecast, by Country 2019 & 2032
- Table 47: Global Smart Pole Industry Revenue Million Forecast, by Production Analysis 2019 & 2032
- Table 48: Global Smart Pole Industry Revenue Million Forecast, by Consumption Analysis 2019 & 2032
- Table 49: Global Smart Pole Industry Revenue Million Forecast, by Import Market Analysis (Value & Volume) 2019 & 2032
- Table 50: Global Smart Pole Industry Revenue Million Forecast, by Export Market Analysis (Value & Volume) 2019 & 2032
- Table 51: Global Smart Pole Industry Revenue Million Forecast, by Price Trend Analysis 2019 & 2032
- Table 52: Global Smart Pole Industry Revenue Million Forecast, by Country 2019 & 2032
- Table 53: Global Smart Pole Industry Revenue Million Forecast, by Production Analysis 2019 & 2032
- Table 54: Global Smart Pole Industry Revenue Million Forecast, by Consumption Analysis 2019 & 2032
- Table 55: Global Smart Pole Industry Revenue Million Forecast, by Import Market Analysis (Value & Volume) 2019 & 2032
- Table 56: Global Smart Pole Industry Revenue Million Forecast, by Export Market Analysis (Value & Volume) 2019 & 2032
- Table 57: Global Smart Pole Industry Revenue Million Forecast, by Price Trend Analysis 2019 & 2032
- Table 58: Global Smart Pole Industry Revenue Million Forecast, by Country 2019 & 2032
Frequently Asked Questions
1. What is the projected Compound Annual Growth Rate (CAGR) of the Smart Pole Industry?
The projected CAGR is approximately 19.40%.
2. Which companies are prominent players in the Smart Pole Industry?
Key companies in the market include Signify Holding BV, LEDbow Technologies Ltd, Keselec Lighting Private Limited, SmartCiti Solutions Inc, Norsk Hydro ASA, HUB Group, Lumca Inc, Efftronics Systems Pvt Ltd, Shanghai Sansi Electronic Engineering Co Ltd, American Tower Corporation, ELKO EP, Energasia Smart Poles, Valmont Structures Pvt Ltd, ENE HUB Pty Ltd*List Not Exhaustive, Streetscape International, Iram Technologies Pvt Ltd.
3. What are the main segments of the Smart Pole Industry?
The market segments include Production Analysis, Consumption Analysis, Import Market Analysis (Value & Volume), Export Market Analysis (Value & Volume), Price Trend Analysis.
4. Can you provide details about the market size?
The market size is estimated to be USD XX Million as of 2022.
5. What are some drivers contributing to market growth?
Increasing Need for Reducing Traffic Jams and Preventing Accidents; Growing Initiative by Various Government for Smart Cities.
6. What are the notable trends driving market growth?
Growing Smart City Initiatives by Various Governments.
7. Are there any restraints impacting market growth?
Rising Complexities to Implement Transition from Manual to Software Testing Process.
8. Can you provide examples of recent developments in the market?
July 2022 - ComptekTechnologies (Comptek), an Aero Wireless Group Company, collaborated with ZenFiNetworks, the CityBridgeConsortium, and Antenna Design to develop Link5G smart poles. In line with this initiative, the company aims to support the smart city initiative by deploying its infrastructure products and services in the region. Such initiatives by the companies are expected to drive the smart pole market during the study period.
9. What pricing options are available for accessing the report?
Pricing options include single-user, multi-user, and enterprise licenses priced at USD 4750, USD 5250, and USD 8750 respectively.
10. Is the market size provided in terms of value or volume?
The market size is provided in terms of value, measured in Million.
11. Are there any specific market keywords associated with the report?
Yes, the market keyword associated with the report is "Smart Pole Industry," which aids in identifying and referencing the specific market segment covered.
12. How do I determine which pricing option suits my needs best?
The pricing options vary based on user requirements and access needs. Individual users may opt for single-user licenses, while businesses requiring broader access may choose multi-user or enterprise licenses for cost-effective access to the report.
13. Are there any additional resources or data provided in the Smart Pole Industry report?
While the report offers comprehensive insights, it's advisable to review the specific contents or supplementary materials provided to ascertain if additional resources or data are available.
14. How can I stay updated on further developments or reports in the Smart Pole Industry?
To stay informed about further developments, trends, and reports in the Smart Pole Industry, consider subscribing to industry newsletters, following relevant companies and organizations, or regularly checking reputable industry news sources and publications.
Methodology
Step 1 - Identification of Relevant Samples Size from Population Database


Step 2 - Approaches for Defining Global Market Size (Value, Volume* & Price*)

Note*: In applicable scenarios
Step 3 - Data Sources
Primary Research
- Web Analytics
- Survey Reports
- Research Institute
- Latest Research Reports
- Opinion Leaders
Secondary Research
- Annual Reports
- White Paper
- Latest Press Release
- Industry Association
- Paid Database
- Investor Presentations

Step 4 - Data Triangulation
Involves using different sources of information in order to increase the validity of a study
These sources are likely to be stakeholders in a program - participants, other researchers, program staff, other community members, and so on.
Then we put all data in single framework & apply various statistical tools to find out the dynamic on the market.
During the analysis stage, feedback from the stakeholder groups would be compared to determine areas of agreement as well as areas of divergence
