

Key Insights
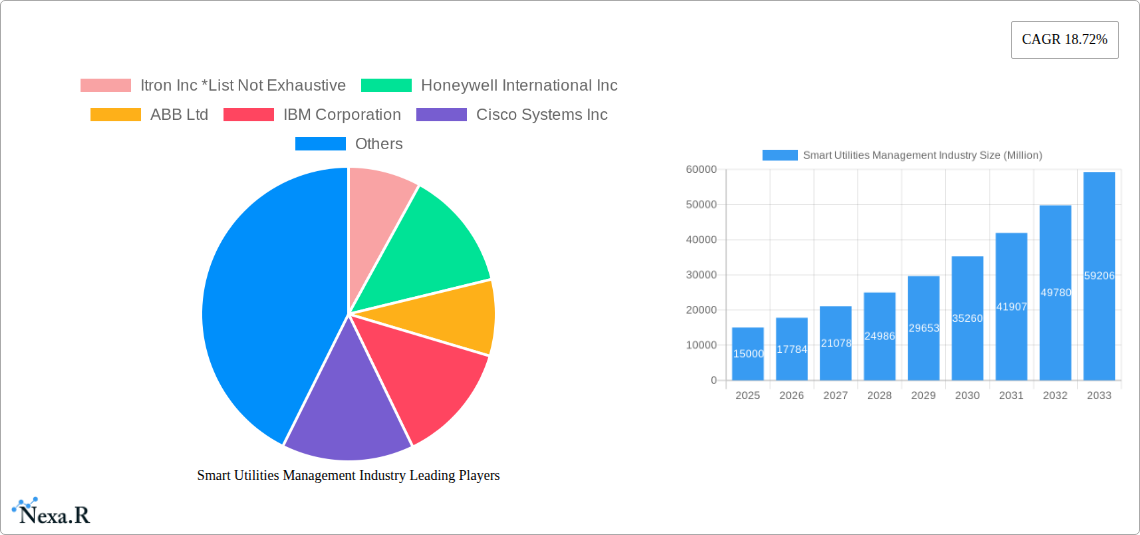
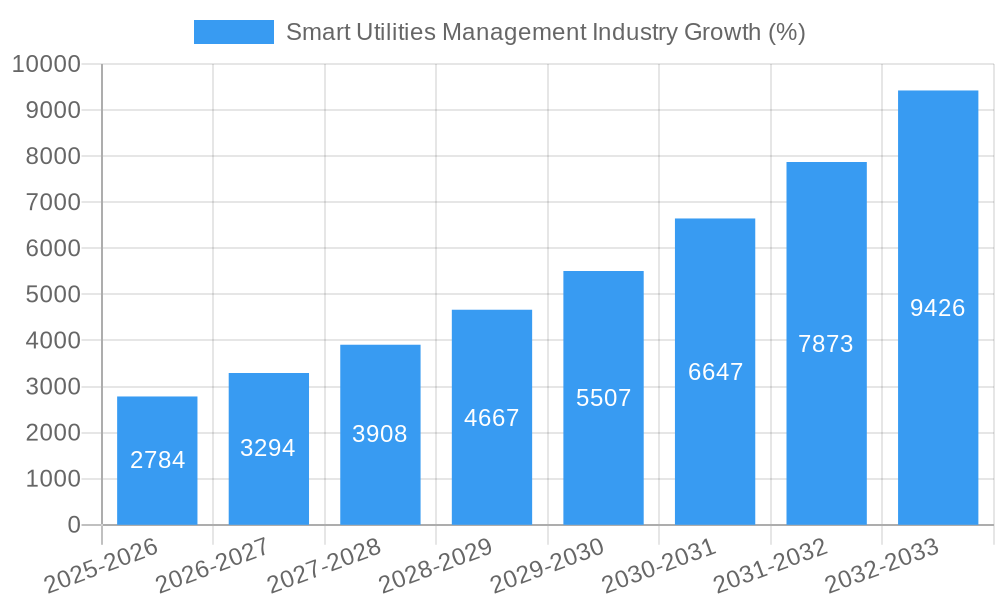
The Smart Utilities Management market is experiencing robust growth, projected to reach a significant size driven by increasing urbanization, the rising adoption of renewable energy sources, and the imperative for enhanced grid efficiency and resilience. A compound annual growth rate (CAGR) of 18.72% from 2019 to 2024 indicates a rapidly expanding market, with substantial growth anticipated throughout the forecast period (2025-2033). Key market drivers include the need for improved energy distribution, reduced operational costs through automation and predictive maintenance, and the increasing demand for real-time data analytics to optimize energy consumption and grid performance. The integration of smart meters, advanced metering infrastructure (AMI), and energy management systems is fundamentally transforming utility operations, enabling proactive grid management and improved customer engagement. Market segmentation reveals strong growth across all segments: Meter Data Management Systems, Energy Monitoring/Management, and Smart Distribution Management, each contributing to the overall market expansion. Leading companies like Itron, Honeywell, ABB, IBM, Cisco, Siemens, Atos, and Tendrill are actively shaping market innovation through technological advancements and strategic partnerships. Regional analysis suggests strong growth across North America, Europe, and Asia Pacific, driven by varying levels of technological adoption and government initiatives promoting smart grid infrastructure.
The market's expansion is further fueled by the growing awareness of environmental sustainability and the need for reduced carbon emissions. Governments worldwide are increasingly investing in smart grid infrastructure projects, creating a favorable regulatory landscape for market growth. However, the high initial investment costs associated with implementing smart utility management solutions and cybersecurity concerns remain key restraining factors. Despite these challenges, the long-term benefits of improved efficiency, enhanced grid reliability, and reduced environmental impact are expected to drive sustained market expansion in the coming years. The focus on developing innovative solutions, such as AI-powered grid management and advanced analytics, will continue to be crucial for companies to compete effectively in this rapidly evolving market. Specific growth projections for future years can be derived from the 18.72% CAGR and extrapolated to provide a comprehensive market forecast.
Smart Utilities Management Industry Market Report: 2019-2033
This comprehensive report provides a detailed analysis of the Smart Utilities Management industry, encompassing market dynamics, growth trends, regional performance, product landscape, key players, and future outlook. The study period covers 2019-2033, with a base year of 2025 and a forecast period of 2025-2033. This report is invaluable for industry professionals, investors, and stakeholders seeking to understand and capitalize on opportunities within this rapidly evolving sector. The parent market is the broader Utilities sector, while the child markets are Meter Data Management, Energy Monitoring & Management and Smart Distribution Management. The total market size in 2025 is estimated at $xx Million.
Smart Utilities Management Industry Market Dynamics & Structure
The Smart Utilities Management market is characterized by moderate concentration, with key players like Itron Inc, Honeywell International Inc, ABB Ltd, IBM Corporation, Cisco Systems Inc, Siemens AG, Atos SE, and Tendrill Inc holding significant market share. However, the market also accommodates numerous smaller, specialized players. Technological innovation, driven by advancements in IoT, AI, and big data analytics, is a major growth driver. Stringent regulatory frameworks focusing on energy efficiency and grid modernization are shaping market dynamics. Competitive substitutes include traditional utility management systems, but their limitations in data analysis and efficiency are gradually diminishing their market presence. End-user demographics comprise primarily electricity, gas, and water utilities, with increasing adoption among municipalities and independent power producers. M&A activity is moderate, with approximately xx deals recorded between 2019 and 2024, indicating a consolidating market.
- Market Concentration: Moderately concentrated, with top 5 players holding approximately xx% market share in 2025.
- Technological Innovation: Significant advancements in IoT, AI, and big data analytics are primary drivers.
- Regulatory Framework: Stringent regulations on energy efficiency and grid modernization are shaping market growth.
- Competitive Substitutes: Traditional systems are being replaced by smart solutions due to limitations in data analysis and efficiency.
- M&A Activity: Approximately xx M&A deals were recorded between 2019 and 2024.
Smart Utilities Management Industry Growth Trends & Insights
The Smart Utilities Management market experienced robust growth during the historical period (2019-2024), with a CAGR of xx%. This growth is attributed to increasing awareness of energy efficiency, the need for grid modernization, and the rising adoption of smart meters and advanced analytics. The market is expected to maintain significant growth during the forecast period (2025-2033), driven by factors such as government initiatives promoting smart grid infrastructure, technological advancements offering enhanced functionalities, and growing consumer demand for reliable and efficient utility services. Market penetration of smart grid technologies is steadily increasing, expected to reach xx% by 2033. Technological disruptions, such as the integration of blockchain technology for secure data management and the development of advanced grid optimization algorithms, are further fueling market growth. Shifting consumer behavior towards sustainable energy solutions and increased demand for real-time energy monitoring are also contributing factors. The total market size is projected to reach $xx Million by 2033.
Dominant Regions, Countries, or Segments in Smart Utilities Management Industry
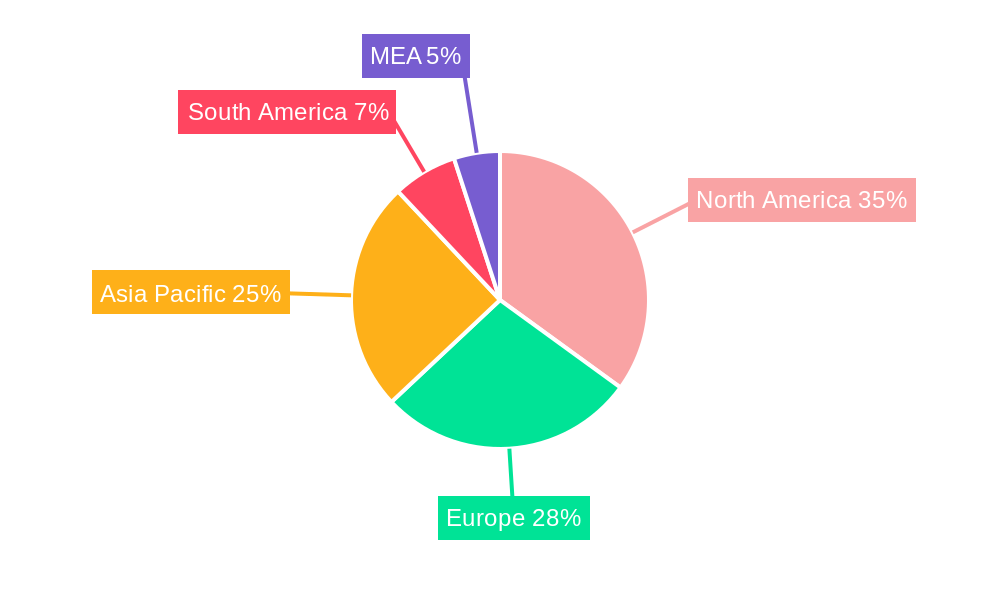
North America currently holds the largest market share in the Smart Utilities Management industry, driven by early adoption of smart grid technologies, robust government support, and a well-established utility infrastructure. Within the segments, the Meter Data Management System (MDMS) segment dominates, accounting for approximately xx% of the market in 2025. This is due to the widespread deployment of smart meters and the need for efficient data management solutions. However, the Energy Monitoring/Management segment is projected to exhibit the highest growth rate during the forecast period, driven by increasing demand for real-time energy usage data and energy optimization strategies.
- North America: Strong government support, well-established infrastructure, and early adoption of smart grid technologies.
- Europe: Growing focus on renewable energy integration and energy efficiency initiatives.
- Asia-Pacific: Rapid urbanization and industrialization driving demand for advanced utility solutions.
- Meter Data Management System (MDMS): Largest market share due to widespread smart meter deployments.
- Energy Monitoring/Management: Highest projected growth rate driven by demand for real-time data and optimization.
- Smart Distribution Management: Significant growth potential due to the need for enhanced grid reliability and resilience.
Smart Utilities Management Industry Product Landscape
The Smart Utilities Management industry offers a diverse range of products, including advanced metering infrastructure (AMI), distribution management systems (DMS), energy storage systems (ESS), and smart grid analytics platforms. These products leverage cutting-edge technologies like IoT sensors, AI-powered algorithms, and cloud computing to enhance operational efficiency, improve grid reliability, and facilitate better customer service. Key features include real-time data acquisition, advanced analytics capabilities, predictive maintenance functionalities, and integration with various utility systems. Unique selling propositions often center around improved accuracy, reduced operational costs, enhanced grid stability, and advanced customer engagement tools.
Key Drivers, Barriers & Challenges in Smart Utilities Management Industry
Key Drivers:
- Government regulations & incentives: Policies promoting smart grid deployment and renewable energy integration.
- Technological advancements: IoT, AI, and big data analytics enabling efficient operations and enhanced customer service.
- Rising energy demand: Increased need for grid modernization and efficient energy management.
Challenges & Restraints:
- High initial investment costs: Significant capital expenditure required for infrastructure upgrades and technology implementation. This impacts smaller utilities disproportionately.
- Cybersecurity concerns: Vulnerability to cyberattacks necessitates robust security measures, adding cost and complexity.
- Data privacy regulations: Compliance with data privacy laws adds complexity and cost to data management practices. Estimated cost impact: xx Million annually for the industry.
Emerging Opportunities in Smart Utilities Management Industry
- Integration of renewable energy sources: Smart grid technologies are essential for effectively integrating renewable energy into the grid.
- Microgrids and distributed energy resources (DERs): Opportunities to develop and manage localized energy systems.
- Advanced analytics and predictive maintenance: Optimizing grid operations and reducing maintenance costs through data-driven insights.
- Customer engagement and energy efficiency programs: Improving customer service and promoting energy conservation.
Growth Accelerators in the Smart Utilities Management Industry
Long-term growth in the Smart Utilities Management industry will be fueled by technological breakthroughs, particularly in AI and machine learning for predictive analytics and grid optimization. Strategic partnerships between utilities and technology providers will drive innovation and accelerate adoption. Market expansion into developing countries, with their growing energy demands and limited existing infrastructure, offers significant growth potential.
Key Players Shaping the Smart Utilities Management Market
- Itron Inc
- Honeywell International Inc
- ABB Ltd
- IBM Corporation
- Cisco Systems Inc
- Siemens AG
- Atos SE
- Tendrill Inc
Notable Milestones in Smart Utilities Management Industry Sector
- 2020: Increased adoption of AMI systems across multiple regions.
- 2021: Launch of several AI-powered grid management platforms.
- 2022: Significant investments in cybersecurity solutions for smart grid infrastructure.
- 2023: Growing focus on integrating renewable energy sources into smart grids.
- 2024: Several key mergers and acquisitions in the sector.
In-Depth Smart Utilities Management Industry Market Outlook
The Smart Utilities Management market is poised for substantial growth over the next decade. Continued technological advancements, coupled with supportive government policies and increasing consumer demand for reliable and sustainable energy solutions, will drive market expansion. Strategic partnerships and investments in emerging technologies like AI, blockchain, and advanced analytics will further accelerate growth. Significant opportunities exist for companies that can offer innovative solutions to address the challenges of grid modernization, renewable energy integration, and cybersecurity.
Smart Utilities Management Industry Segmentation
-
1. Type
- 1.1. Meter Data Management System
- 1.2. Energy Monitoring/Management
- 1.3. Smart Distribution Management
Smart Utilities Management Industry Segmentation By Geography
- 1. North America
- 2. Europe
- 3. Asia Pacific
- 4. Latin America
- 5. Middle East
Smart Utilities Management Industry REPORT HIGHLIGHTS
| Aspects | Details |
|---|---|
| Study Period | 2019-2033 |
| Base Year | 2024 |
| Estimated Year | 2025 |
| Forecast Period | 2025-2033 |
| Historical Period | 2019-2024 |
| Growth Rate | CAGR of 18.72% from 2019-2033 |
| Segmentation |
|
Table of Contents
- 1. Introduction
- 1.1. Research Scope
- 1.2. Market Segmentation
- 1.3. Research Methodology
- 1.4. Definitions and Assumptions
- 2. Executive Summary
- 2.1. Introduction
- 3. Market Dynamics
- 3.1. Introduction
- 3.2. Market Drivers
- 3.2.1. ; Rise in Smart City Deployment; Improvements in Energy Efficiency
- 3.3. Market Restrains
- 3.3.1. ; High Cost and Security Concerns and Integration Challenges Associated with Smart Meters
- 3.4. Market Trends
- 3.4.1. Power Sector Hits Growth with Meter Data Management System
- 4. Market Factor Analysis
- 4.1. Porters Five Forces
- 4.2. Supply/Value Chain
- 4.3. PESTEL analysis
- 4.4. Market Entropy
- 4.5. Patent/Trademark Analysis
- 5. Global Smart Utilities Management Industry Analysis, Insights and Forecast, 2019-2031
- 5.1. Market Analysis, Insights and Forecast - by Type
- 5.1.1. Meter Data Management System
- 5.1.2. Energy Monitoring/Management
- 5.1.3. Smart Distribution Management
- 5.2. Market Analysis, Insights and Forecast - by Region
- 5.2.1. North America
- 5.2.2. Europe
- 5.2.3. Asia Pacific
- 5.2.4. Latin America
- 5.2.5. Middle East
- 5.1. Market Analysis, Insights and Forecast - by Type
- 6. North America Smart Utilities Management Industry Analysis, Insights and Forecast, 2019-2031
- 6.1. Market Analysis, Insights and Forecast - by Type
- 6.1.1. Meter Data Management System
- 6.1.2. Energy Monitoring/Management
- 6.1.3. Smart Distribution Management
- 6.1. Market Analysis, Insights and Forecast - by Type
- 7. Europe Smart Utilities Management Industry Analysis, Insights and Forecast, 2019-2031
- 7.1. Market Analysis, Insights and Forecast - by Type
- 7.1.1. Meter Data Management System
- 7.1.2. Energy Monitoring/Management
- 7.1.3. Smart Distribution Management
- 7.1. Market Analysis, Insights and Forecast - by Type
- 8. Asia Pacific Smart Utilities Management Industry Analysis, Insights and Forecast, 2019-2031
- 8.1. Market Analysis, Insights and Forecast - by Type
- 8.1.1. Meter Data Management System
- 8.1.2. Energy Monitoring/Management
- 8.1.3. Smart Distribution Management
- 8.1. Market Analysis, Insights and Forecast - by Type
- 9. Latin America Smart Utilities Management Industry Analysis, Insights and Forecast, 2019-2031
- 9.1. Market Analysis, Insights and Forecast - by Type
- 9.1.1. Meter Data Management System
- 9.1.2. Energy Monitoring/Management
- 9.1.3. Smart Distribution Management
- 9.1. Market Analysis, Insights and Forecast - by Type
- 10. Middle East Smart Utilities Management Industry Analysis, Insights and Forecast, 2019-2031
- 10.1. Market Analysis, Insights and Forecast - by Type
- 10.1.1. Meter Data Management System
- 10.1.2. Energy Monitoring/Management
- 10.1.3. Smart Distribution Management
- 10.1. Market Analysis, Insights and Forecast - by Type
- 11. North America Smart Utilities Management Industry Analysis, Insights and Forecast, 2019-2031
- 11.1. Market Analysis, Insights and Forecast - By Country/Sub-region
- 11.1.1 United States
- 11.1.2 Canada
- 11.1.3 Mexico
- 12. Europe Smart Utilities Management Industry Analysis, Insights and Forecast, 2019-2031
- 12.1. Market Analysis, Insights and Forecast - By Country/Sub-region
- 12.1.1 Germany
- 12.1.2 United Kingdom
- 12.1.3 France
- 12.1.4 Spain
- 12.1.5 Italy
- 12.1.6 Spain
- 12.1.7 Belgium
- 12.1.8 Netherland
- 12.1.9 Nordics
- 12.1.10 Rest of Europe
- 13. Asia Pacific Smart Utilities Management Industry Analysis, Insights and Forecast, 2019-2031
- 13.1. Market Analysis, Insights and Forecast - By Country/Sub-region
- 13.1.1 China
- 13.1.2 Japan
- 13.1.3 India
- 13.1.4 South Korea
- 13.1.5 Southeast Asia
- 13.1.6 Australia
- 13.1.7 Indonesia
- 13.1.8 Phillipes
- 13.1.9 Singapore
- 13.1.10 Thailandc
- 13.1.11 Rest of Asia Pacific
- 14. South America Smart Utilities Management Industry Analysis, Insights and Forecast, 2019-2031
- 14.1. Market Analysis, Insights and Forecast - By Country/Sub-region
- 14.1.1 Brazil
- 14.1.2 Argentina
- 14.1.3 Peru
- 14.1.4 Chile
- 14.1.5 Colombia
- 14.1.6 Ecuador
- 14.1.7 Venezuela
- 14.1.8 Rest of South America
- 15. North America Smart Utilities Management Industry Analysis, Insights and Forecast, 2019-2031
- 15.1. Market Analysis, Insights and Forecast - By Country/Sub-region
- 15.1.1 United States
- 15.1.2 Canada
- 15.1.3 Mexico
- 16. MEA Smart Utilities Management Industry Analysis, Insights and Forecast, 2019-2031
- 16.1. Market Analysis, Insights and Forecast - By Country/Sub-region
- 16.1.1 United Arab Emirates
- 16.1.2 Saudi Arabia
- 16.1.3 South Africa
- 16.1.4 Rest of Middle East and Africa
- 17. Competitive Analysis
- 17.1. Global Market Share Analysis 2024
- 17.2. Company Profiles
- 17.2.1 Itron Inc *List Not Exhaustive
- 17.2.1.1. Overview
- 17.2.1.2. Products
- 17.2.1.3. SWOT Analysis
- 17.2.1.4. Recent Developments
- 17.2.1.5. Financials (Based on Availability)
- 17.2.2 Honeywell International Inc
- 17.2.2.1. Overview
- 17.2.2.2. Products
- 17.2.2.3. SWOT Analysis
- 17.2.2.4. Recent Developments
- 17.2.2.5. Financials (Based on Availability)
- 17.2.3 ABB Ltd
- 17.2.3.1. Overview
- 17.2.3.2. Products
- 17.2.3.3. SWOT Analysis
- 17.2.3.4. Recent Developments
- 17.2.3.5. Financials (Based on Availability)
- 17.2.4 IBM Corporation
- 17.2.4.1. Overview
- 17.2.4.2. Products
- 17.2.4.3. SWOT Analysis
- 17.2.4.4. Recent Developments
- 17.2.4.5. Financials (Based on Availability)
- 17.2.5 Cisco Systems Inc
- 17.2.5.1. Overview
- 17.2.5.2. Products
- 17.2.5.3. SWOT Analysis
- 17.2.5.4. Recent Developments
- 17.2.5.5. Financials (Based on Availability)
- 17.2.6 Siemens AG
- 17.2.6.1. Overview
- 17.2.6.2. Products
- 17.2.6.3. SWOT Analysis
- 17.2.6.4. Recent Developments
- 17.2.6.5. Financials (Based on Availability)
- 17.2.7 Atos SE
- 17.2.7.1. Overview
- 17.2.7.2. Products
- 17.2.7.3. SWOT Analysis
- 17.2.7.4. Recent Developments
- 17.2.7.5. Financials (Based on Availability)
- 17.2.8 Tendrill Inc
- 17.2.8.1. Overview
- 17.2.8.2. Products
- 17.2.8.3. SWOT Analysis
- 17.2.8.4. Recent Developments
- 17.2.8.5. Financials (Based on Availability)
- 17.2.1 Itron Inc *List Not Exhaustive
List of Figures
- Figure 1: Global Smart Utilities Management Industry Revenue Breakdown (Million, %) by Region 2024 & 2032
- Figure 2: North America Smart Utilities Management Industry Revenue (Million), by Country 2024 & 2032
- Figure 3: North America Smart Utilities Management Industry Revenue Share (%), by Country 2024 & 2032
- Figure 4: Europe Smart Utilities Management Industry Revenue (Million), by Country 2024 & 2032
- Figure 5: Europe Smart Utilities Management Industry Revenue Share (%), by Country 2024 & 2032
- Figure 6: Asia Pacific Smart Utilities Management Industry Revenue (Million), by Country 2024 & 2032
- Figure 7: Asia Pacific Smart Utilities Management Industry Revenue Share (%), by Country 2024 & 2032
- Figure 8: South America Smart Utilities Management Industry Revenue (Million), by Country 2024 & 2032
- Figure 9: South America Smart Utilities Management Industry Revenue Share (%), by Country 2024 & 2032
- Figure 10: North America Smart Utilities Management Industry Revenue (Million), by Country 2024 & 2032
- Figure 11: North America Smart Utilities Management Industry Revenue Share (%), by Country 2024 & 2032
- Figure 12: MEA Smart Utilities Management Industry Revenue (Million), by Country 2024 & 2032
- Figure 13: MEA Smart Utilities Management Industry Revenue Share (%), by Country 2024 & 2032
- Figure 14: North America Smart Utilities Management Industry Revenue (Million), by Type 2024 & 2032
- Figure 15: North America Smart Utilities Management Industry Revenue Share (%), by Type 2024 & 2032
- Figure 16: North America Smart Utilities Management Industry Revenue (Million), by Country 2024 & 2032
- Figure 17: North America Smart Utilities Management Industry Revenue Share (%), by Country 2024 & 2032
- Figure 18: Europe Smart Utilities Management Industry Revenue (Million), by Type 2024 & 2032
- Figure 19: Europe Smart Utilities Management Industry Revenue Share (%), by Type 2024 & 2032
- Figure 20: Europe Smart Utilities Management Industry Revenue (Million), by Country 2024 & 2032
- Figure 21: Europe Smart Utilities Management Industry Revenue Share (%), by Country 2024 & 2032
- Figure 22: Asia Pacific Smart Utilities Management Industry Revenue (Million), by Type 2024 & 2032
- Figure 23: Asia Pacific Smart Utilities Management Industry Revenue Share (%), by Type 2024 & 2032
- Figure 24: Asia Pacific Smart Utilities Management Industry Revenue (Million), by Country 2024 & 2032
- Figure 25: Asia Pacific Smart Utilities Management Industry Revenue Share (%), by Country 2024 & 2032
- Figure 26: Latin America Smart Utilities Management Industry Revenue (Million), by Type 2024 & 2032
- Figure 27: Latin America Smart Utilities Management Industry Revenue Share (%), by Type 2024 & 2032
- Figure 28: Latin America Smart Utilities Management Industry Revenue (Million), by Country 2024 & 2032
- Figure 29: Latin America Smart Utilities Management Industry Revenue Share (%), by Country 2024 & 2032
- Figure 30: Middle East Smart Utilities Management Industry Revenue (Million), by Type 2024 & 2032
- Figure 31: Middle East Smart Utilities Management Industry Revenue Share (%), by Type 2024 & 2032
- Figure 32: Middle East Smart Utilities Management Industry Revenue (Million), by Country 2024 & 2032
- Figure 33: Middle East Smart Utilities Management Industry Revenue Share (%), by Country 2024 & 2032
List of Tables
- Table 1: Global Smart Utilities Management Industry Revenue Million Forecast, by Region 2019 & 2032
- Table 2: Global Smart Utilities Management Industry Revenue Million Forecast, by Type 2019 & 2032
- Table 3: Global Smart Utilities Management Industry Revenue Million Forecast, by Region 2019 & 2032
- Table 4: Global Smart Utilities Management Industry Revenue Million Forecast, by Country 2019 & 2032
- Table 5: United States Smart Utilities Management Industry Revenue (Million) Forecast, by Application 2019 & 2032
- Table 6: Canada Smart Utilities Management Industry Revenue (Million) Forecast, by Application 2019 & 2032
- Table 7: Mexico Smart Utilities Management Industry Revenue (Million) Forecast, by Application 2019 & 2032
- Table 8: Global Smart Utilities Management Industry Revenue Million Forecast, by Country 2019 & 2032
- Table 9: Germany Smart Utilities Management Industry Revenue (Million) Forecast, by Application 2019 & 2032
- Table 10: United Kingdom Smart Utilities Management Industry Revenue (Million) Forecast, by Application 2019 & 2032
- Table 11: France Smart Utilities Management Industry Revenue (Million) Forecast, by Application 2019 & 2032
- Table 12: Spain Smart Utilities Management Industry Revenue (Million) Forecast, by Application 2019 & 2032
- Table 13: Italy Smart Utilities Management Industry Revenue (Million) Forecast, by Application 2019 & 2032
- Table 14: Spain Smart Utilities Management Industry Revenue (Million) Forecast, by Application 2019 & 2032
- Table 15: Belgium Smart Utilities Management Industry Revenue (Million) Forecast, by Application 2019 & 2032
- Table 16: Netherland Smart Utilities Management Industry Revenue (Million) Forecast, by Application 2019 & 2032
- Table 17: Nordics Smart Utilities Management Industry Revenue (Million) Forecast, by Application 2019 & 2032
- Table 18: Rest of Europe Smart Utilities Management Industry Revenue (Million) Forecast, by Application 2019 & 2032
- Table 19: Global Smart Utilities Management Industry Revenue Million Forecast, by Country 2019 & 2032
- Table 20: China Smart Utilities Management Industry Revenue (Million) Forecast, by Application 2019 & 2032
- Table 21: Japan Smart Utilities Management Industry Revenue (Million) Forecast, by Application 2019 & 2032
- Table 22: India Smart Utilities Management Industry Revenue (Million) Forecast, by Application 2019 & 2032
- Table 23: South Korea Smart Utilities Management Industry Revenue (Million) Forecast, by Application 2019 & 2032
- Table 24: Southeast Asia Smart Utilities Management Industry Revenue (Million) Forecast, by Application 2019 & 2032
- Table 25: Australia Smart Utilities Management Industry Revenue (Million) Forecast, by Application 2019 & 2032
- Table 26: Indonesia Smart Utilities Management Industry Revenue (Million) Forecast, by Application 2019 & 2032
- Table 27: Phillipes Smart Utilities Management Industry Revenue (Million) Forecast, by Application 2019 & 2032
- Table 28: Singapore Smart Utilities Management Industry Revenue (Million) Forecast, by Application 2019 & 2032
- Table 29: Thailandc Smart Utilities Management Industry Revenue (Million) Forecast, by Application 2019 & 2032
- Table 30: Rest of Asia Pacific Smart Utilities Management Industry Revenue (Million) Forecast, by Application 2019 & 2032
- Table 31: Global Smart Utilities Management Industry Revenue Million Forecast, by Country 2019 & 2032
- Table 32: Brazil Smart Utilities Management Industry Revenue (Million) Forecast, by Application 2019 & 2032
- Table 33: Argentina Smart Utilities Management Industry Revenue (Million) Forecast, by Application 2019 & 2032
- Table 34: Peru Smart Utilities Management Industry Revenue (Million) Forecast, by Application 2019 & 2032
- Table 35: Chile Smart Utilities Management Industry Revenue (Million) Forecast, by Application 2019 & 2032
- Table 36: Colombia Smart Utilities Management Industry Revenue (Million) Forecast, by Application 2019 & 2032
- Table 37: Ecuador Smart Utilities Management Industry Revenue (Million) Forecast, by Application 2019 & 2032
- Table 38: Venezuela Smart Utilities Management Industry Revenue (Million) Forecast, by Application 2019 & 2032
- Table 39: Rest of South America Smart Utilities Management Industry Revenue (Million) Forecast, by Application 2019 & 2032
- Table 40: Global Smart Utilities Management Industry Revenue Million Forecast, by Country 2019 & 2032
- Table 41: United States Smart Utilities Management Industry Revenue (Million) Forecast, by Application 2019 & 2032
- Table 42: Canada Smart Utilities Management Industry Revenue (Million) Forecast, by Application 2019 & 2032
- Table 43: Mexico Smart Utilities Management Industry Revenue (Million) Forecast, by Application 2019 & 2032
- Table 44: Global Smart Utilities Management Industry Revenue Million Forecast, by Country 2019 & 2032
- Table 45: United Arab Emirates Smart Utilities Management Industry Revenue (Million) Forecast, by Application 2019 & 2032
- Table 46: Saudi Arabia Smart Utilities Management Industry Revenue (Million) Forecast, by Application 2019 & 2032
- Table 47: South Africa Smart Utilities Management Industry Revenue (Million) Forecast, by Application 2019 & 2032
- Table 48: Rest of Middle East and Africa Smart Utilities Management Industry Revenue (Million) Forecast, by Application 2019 & 2032
- Table 49: Global Smart Utilities Management Industry Revenue Million Forecast, by Type 2019 & 2032
- Table 50: Global Smart Utilities Management Industry Revenue Million Forecast, by Country 2019 & 2032
- Table 51: Global Smart Utilities Management Industry Revenue Million Forecast, by Type 2019 & 2032
- Table 52: Global Smart Utilities Management Industry Revenue Million Forecast, by Country 2019 & 2032
- Table 53: Global Smart Utilities Management Industry Revenue Million Forecast, by Type 2019 & 2032
- Table 54: Global Smart Utilities Management Industry Revenue Million Forecast, by Country 2019 & 2032
- Table 55: Global Smart Utilities Management Industry Revenue Million Forecast, by Type 2019 & 2032
- Table 56: Global Smart Utilities Management Industry Revenue Million Forecast, by Country 2019 & 2032
- Table 57: Global Smart Utilities Management Industry Revenue Million Forecast, by Type 2019 & 2032
- Table 58: Global Smart Utilities Management Industry Revenue Million Forecast, by Country 2019 & 2032
Frequently Asked Questions
1. What is the projected Compound Annual Growth Rate (CAGR) of the Smart Utilities Management Industry?
The projected CAGR is approximately 18.72%.
2. Which companies are prominent players in the Smart Utilities Management Industry?
Key companies in the market include Itron Inc *List Not Exhaustive, Honeywell International Inc, ABB Ltd, IBM Corporation, Cisco Systems Inc, Siemens AG, Atos SE, Tendrill Inc.
3. What are the main segments of the Smart Utilities Management Industry?
The market segments include Type.
4. Can you provide details about the market size?
The market size is estimated to be USD XX Million as of 2022.
5. What are some drivers contributing to market growth?
; Rise in Smart City Deployment; Improvements in Energy Efficiency.
6. What are the notable trends driving market growth?
Power Sector Hits Growth with Meter Data Management System.
7. Are there any restraints impacting market growth?
; High Cost and Security Concerns and Integration Challenges Associated with Smart Meters.
8. Can you provide examples of recent developments in the market?
N/A
9. What pricing options are available for accessing the report?
Pricing options include single-user, multi-user, and enterprise licenses priced at USD 4750, USD 5250, and USD 8750 respectively.
10. Is the market size provided in terms of value or volume?
The market size is provided in terms of value, measured in Million.
11. Are there any specific market keywords associated with the report?
Yes, the market keyword associated with the report is "Smart Utilities Management Industry," which aids in identifying and referencing the specific market segment covered.
12. How do I determine which pricing option suits my needs best?
The pricing options vary based on user requirements and access needs. Individual users may opt for single-user licenses, while businesses requiring broader access may choose multi-user or enterprise licenses for cost-effective access to the report.
13. Are there any additional resources or data provided in the Smart Utilities Management Industry report?
While the report offers comprehensive insights, it's advisable to review the specific contents or supplementary materials provided to ascertain if additional resources or data are available.
14. How can I stay updated on further developments or reports in the Smart Utilities Management Industry?
To stay informed about further developments, trends, and reports in the Smart Utilities Management Industry, consider subscribing to industry newsletters, following relevant companies and organizations, or regularly checking reputable industry news sources and publications.
Methodology
Step 1 - Identification of Relevant Samples Size from Population Database


Step 2 - Approaches for Defining Global Market Size (Value, Volume* & Price*)

Note*: In applicable scenarios
Step 3 - Data Sources
Primary Research
- Web Analytics
- Survey Reports
- Research Institute
- Latest Research Reports
- Opinion Leaders
Secondary Research
- Annual Reports
- White Paper
- Latest Press Release
- Industry Association
- Paid Database
- Investor Presentations

Step 4 - Data Triangulation
Involves using different sources of information in order to increase the validity of a study
These sources are likely to be stakeholders in a program - participants, other researchers, program staff, other community members, and so on.
Then we put all data in single framework & apply various statistical tools to find out the dynamic on the market.
During the analysis stage, feedback from the stakeholder groups would be compared to determine areas of agreement as well as areas of divergence
