

Key Insights
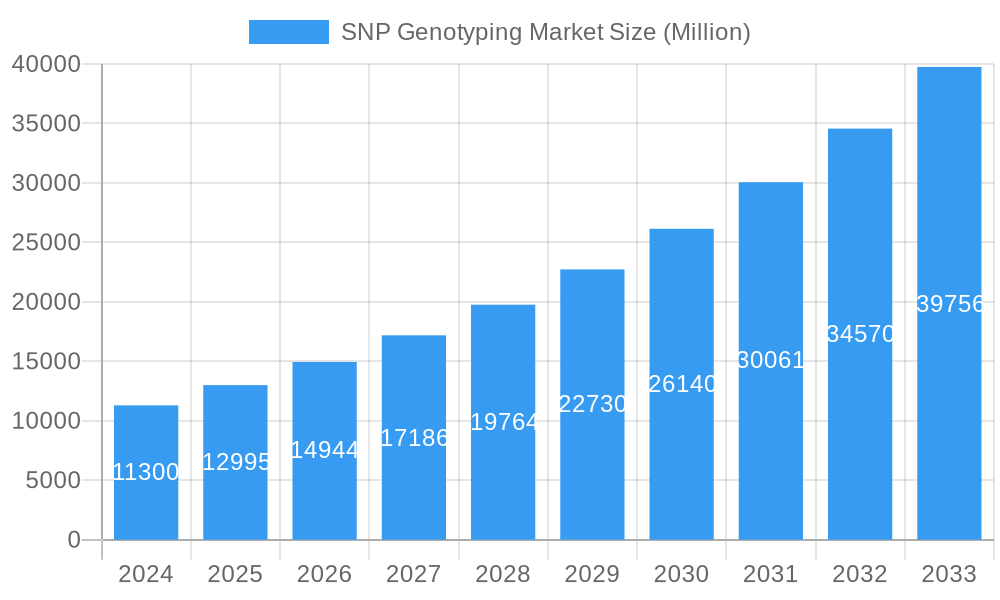
The global SNP Genotyping market is poised for substantial expansion, projected to reach an estimated $11.3 billion in 2024, driven by an impressive Compound Annual Growth Rate (CAGR) of 15% through the forecast period ending in 2033. This robust growth is underpinned by several key factors. The escalating demand for personalized medicine and pharmacogenomics, where SNP genotyping plays a crucial role in predicting drug response and optimizing treatment strategies, is a primary accelerator. Furthermore, the expanding applications of SNP genotyping in the diagnostic field, including the identification of genetic predispositions to diseases and the development of companion diagnostics, are significantly fueling market penetration. Advancements in genotyping technologies, leading to increased accuracy, speed, and cost-effectiveness, are also contributing to broader adoption across research and clinical settings. The increasing prevalence of chronic diseases and genetic disorders globally further necessitates advanced diagnostic tools, creating a fertile ground for SNP genotyping solutions.
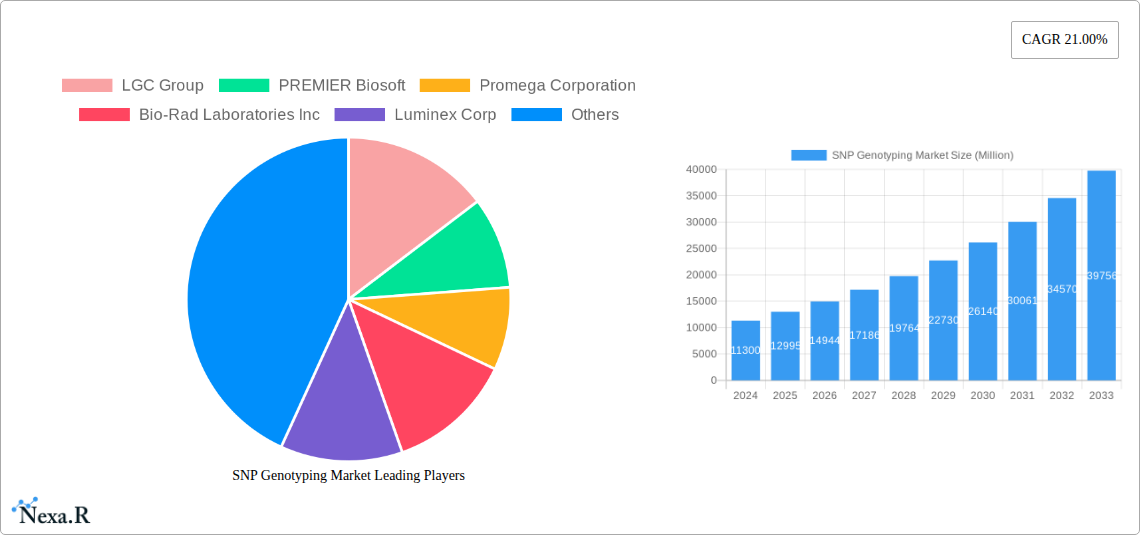
SNP Genotyping Market Market Size (In Billion)
While the market demonstrates strong upward momentum, certain restraints may influence its trajectory. The high initial investment required for advanced SNP genotyping platforms and infrastructure can be a barrier for smaller research institutions and developing economies. Stringent regulatory hurdles for the approval of new diagnostic tests utilizing SNP genotyping, though essential for patient safety, can also slow down market entry and adoption. However, these challenges are expected to be mitigated by ongoing technological innovations that are driving down costs and improving accessibility. The market is characterized by a competitive landscape with key players like Thermo Fisher Scientific Inc., Illumina Inc., and Agilent Technologies Inc. investing heavily in research and development to introduce novel solutions and expand their product portfolios, thereby catering to diverse end-user needs across pharmacogenomics and diagnostics. The market's segmentation by technology, including TaqMan SNP Genotyping and Massarray SNP Genotyping, and by end-user sectors, underscores the varied applications and the specialized demand within this dynamic market.
SNP Genotyping Market Company Market Share
This comprehensive report provides an in-depth analysis of the global SNP Genotyping Market, a critical component of precision medicine and advanced diagnostics. The market is poised for significant expansion, driven by escalating demand for personalized treatments, advancements in genetic research, and the burgeoning adoption of pharmacogenomics and diagnostics across healthcare. This report details market dynamics, growth trends, regional dominance, product landscape, key drivers, barriers, emerging opportunities, and the strategic insights necessary for stakeholders to navigate this evolving sector.
SNP Genotyping Market Market Dynamics & Structure
The SNP Genotyping Market exhibits a moderately concentrated structure, characterized by the presence of large, established players alongside a growing number of innovative niche providers. Technological innovation remains a paramount driver, with continuous advancements in genotyping platforms and methodologies enhancing accuracy, throughput, and cost-effectiveness. Stringent regulatory frameworks, particularly concerning genetic testing and data privacy, shape market entry and product development. Competitive product substitutes, while emerging, are yet to fully displace established genotyping technologies due to their proven reliability and extensive validation. End-user demographics are broadening, with increasing engagement from research institutions, pharmaceutical companies, contract research organizations (CROs), and clinical diagnostic laboratories. Mergers and acquisitions (M&A) activity is a significant trend, as larger corporations seek to consolidate market share, acquire novel technologies, and expand their service portfolios. For instance, the acquisition of smaller, specialized genotyping firms by larger life science corporations is a recurring strategy.
- Market Concentration: Moderately concentrated with key players holding significant market share.
- Technological Innovation Drivers: Development of higher-throughput, lower-cost, and more accurate genotyping platforms.
- Regulatory Frameworks: Stringent regulations for genetic testing and data privacy (e.g., CLIA, GDPR).
- Competitive Product Substitutes: Emerging technologies like next-generation sequencing (NGS) are influencing the market, but traditional SNP genotyping methods retain dominance due to cost and established protocols.
- End-User Demographics: Expansion across research, diagnostics, and pharmaceutical sectors.
- M&A Trends: Consolidation through strategic acquisitions to gain market share and technological capabilities. Anticipated M&A deal volumes in the forecast period are estimated at XX deals.
SNP Genotyping Market Growth Trends & Insights
The SNP Genotyping Market is experiencing robust growth, projected to reach an estimated XX billion USD by 2033. This expansion is fueled by a confluence of factors, including the increasing prevalence of chronic diseases necessitating personalized treatment approaches, the expanding applications of pharmacogenomics in tailoring drug efficacy and safety, and the continuous integration of SNP genotyping into routine diagnostic workflows. Adoption rates of advanced genotyping technologies are accelerating as they become more accessible and cost-effective. Technological disruptions, such as the refinement of PCR-based methods and the integration of AI in data analysis, are further propelling market penetration. Consumer behavior is shifting towards proactive health management, with individuals increasingly seeking genetic insights to understand their predisposition to certain conditions and optimize their wellness strategies. The market penetration for SNP genotyping in the diagnostic field is estimated to grow from XX% in 2024 to XX% by 2033. The Compound Annual Growth Rate (CAGR) for the SNP Genotyping Market over the forecast period (2025–2033) is projected to be XX%.
Dominant Regions, Countries, or Segments in SNP Genotyping Market
North America currently dominates the SNP Genotyping Market, driven by its strong research infrastructure, substantial healthcare expenditure, and a high adoption rate of advanced biotechnologies. The United States, in particular, is a leading contributor, owing to extensive government funding for genetic research, the presence of major pharmaceutical and biotechnology companies, and a well-established diagnostic landscape. The Diagnostic Field segment is a primary growth engine within this region, with SNP genotyping playing an integral role in disease predisposition testing, companion diagnostics, and infectious disease surveillance. In terms of technology, TaqMan SNP Genotyping remains a dominant force due to its established reliability, high throughput, and versatility in a wide range of applications.
- Dominant Region: North America, with the United States as a key country.
- Dominant Segment (End User): Diagnostic Field, with significant contributions from pharmacogenomics.
- Dominant Segment (Technology): TaqMan SNP Genotyping, owing to its widespread adoption and validation.
- Key Drivers in North America:
- Government initiatives supporting genomic research and personalized medicine.
- High prevalence of chronic diseases requiring targeted therapies.
- Presence of leading biotechnology and pharmaceutical companies.
- Robust reimbursement policies for genetic testing.
- Advanced healthcare infrastructure and accessibility.
- Market Share in Dominant Segment: The Diagnostic Field segment is estimated to hold XX% of the market share in 2025, with projected growth to XX% by 2033. TaqMan SNP Genotyping technology is expected to retain a XX% market share within its segment in 2025.
SNP Genotyping Market Product Landscape
The SNP Genotyping Market is characterized by a dynamic product landscape featuring continuous innovation in assay design, platform miniaturization, and data analysis software. Key product innovations include the development of multiplex genotyping assays capable of analyzing hundreds or thousands of SNPs simultaneously, significantly reducing turnaround times and costs. Applications range from academic research into genetic associations to clinical diagnostics for disease risk assessment, drug response prediction, and pathogen identification. Performance metrics such as assay sensitivity, specificity, and throughput are constantly being enhanced. Unique selling propositions often revolve around ease of use, cost-effectiveness, and compatibility with existing laboratory workflows. Recent technological advancements focus on improving the accuracy of low-frequency SNP detection and integrating real-time data analysis capabilities.
Key Drivers, Barriers & Challenges in SNP Genotyping Market
Key Drivers:
- Advancements in Personalized Medicine: The increasing demand for tailored treatments based on individual genetic profiles.
- Growing Applications in Diagnostics: Expansion of SNP genotyping for disease predisposition, carrier screening, and infectious disease variant detection.
- Technological Innovations: Development of more efficient, cost-effective, and high-throughput genotyping platforms.
- Increasing Investment in Genomics Research: Growing funding from government bodies and private organizations for genetic studies.
Barriers & Challenges:
- High Initial Investment Costs: The cost of advanced genotyping equipment and consumables can be a barrier for smaller laboratories.
- Data Interpretation Complexity: Analyzing and interpreting large genomic datasets requires specialized expertise and robust bioinformatics tools.
- Regulatory Hurdles: Navigating complex regulatory approvals for new diagnostic assays and genetic testing services.
- Ethical Considerations and Data Privacy: Concerns surrounding genetic data security and potential misuse.
- Supply Chain Disruptions: Potential for disruptions in the supply of reagents and consumables, impacting market stability. The impact of supply chain issues on market growth is estimated to be XX% reduction in expected CAGR.
Emerging Opportunities in SNP Genotyping Market
Emerging opportunities in the SNP Genotyping Market lie in the expanding applications of genotyping in areas such as liquid biopsies for cancer monitoring, the development of direct-to-consumer (DTC) genetic testing with enhanced clinical utility, and the integration of SNP data with other omics data for a more holistic understanding of biological systems. Untapped markets in developing economies present significant growth potential as healthcare infrastructure improves. Innovative applications in agriculture for crop and livestock improvement also represent a burgeoning area. Evolving consumer preferences towards proactive health management and a desire for greater genetic insights will continue to drive demand for accessible and user-friendly genotyping solutions.
Growth Accelerators in the SNP Genotyping Market Industry
Long-term growth in the SNP Genotyping Market will be significantly accelerated by continuous technological breakthroughs, including the development of ultra-low-cost genotyping technologies and AI-driven platforms for predictive analytics. Strategic partnerships between technology providers, diagnostic laboratories, and pharmaceutical companies will foster wider adoption and the development of integrated solutions. Market expansion strategies focusing on emerging economies, coupled with increasing public awareness and acceptance of genetic testing, will unlock new customer segments. The growing emphasis on real-world evidence generation using SNP data in clinical trials and post-market surveillance will also act as a substantial growth accelerator.
Key Players Shaping the SNP Genotyping Market Market
- LGC Group
- PREMIER Biosoft
- Promega Corporation
- Bio-Rad Laboratories Inc
- Luminex Corp
- Douglas Scientific LLC
- Danaher Corporation
- Agilent Technologies Inc
- Thermo Fischer Scientific Inc
- Life Technologies Corp
- Illumina Inc
- Sequenom
- Fluidigm Corporation
Notable Milestones in SNP Genotyping Market Sector
- Feb 2021: Novacyt launched its SNPsig portfolio of PCR genotyping assays, aiding the diagnosis of new variants of SARS-CoV-2.
- Aug 2021: Thermo Fisher Scientific expanded its production capability and updated its Applied Biosystems TaqMan SARS-CoV-2 mutation panel to diagnose Delta and Lambda strains, enabling laboratories to track known mutations.
In-Depth SNP Genotyping Market Market Outlook
The SNP Genotyping Market is set for substantial growth, driven by the burgeoning demand for precision medicine and advanced diagnostic solutions. Future market potential is immense, with an increasing focus on integrating genomic data into routine clinical practice. Strategic opportunities abound in the development of more accessible and affordable genotyping solutions, particularly for underserved populations and emerging markets. The continued evolution of assay technologies and bioinformatics platforms will enable deeper insights into disease mechanisms and treatment responses. Stakeholders who can effectively leverage technological advancements, navigate regulatory landscapes, and forge strong partnerships will be well-positioned to capitalize on the expansive opportunities within this dynamic market.
SNP Genotyping Market Segmentation
-
1. Technology
- 1.1. TaqMan SNP Genotyping
- 1.2. Massarray SNP Genotyping
- 1.3. SNP GeneChip Arrays
- 1.4. Other Technologies
-
2. End User
- 2.1. Pharmacogenomics
- 2.2. Diagnostic Field
SNP Genotyping Market Segmentation By Geography
-
1. North America
- 1.1. United States
- 1.2. Canada
- 1.3. Mexico
-
2. Europe
- 2.1. Germany
- 2.2. United Kingdom
- 2.3. France
- 2.4. Italy
- 2.5. Spain
- 2.6. Rest of Europe
-
3. Asia Pacific
- 3.1. China
- 3.2. Japan
- 3.3. India
- 3.4. Australia
- 3.5. South Korea
- 3.6. Rest of Asia Pacific
-
4. Middle East and Africa
- 4.1. GCC
- 4.2. South Africa
- 4.3. Rest of Middle East and Africa
-
5. South America
- 5.1. Brazil
- 5.2. Argentina
- 5.3. Rest of South America
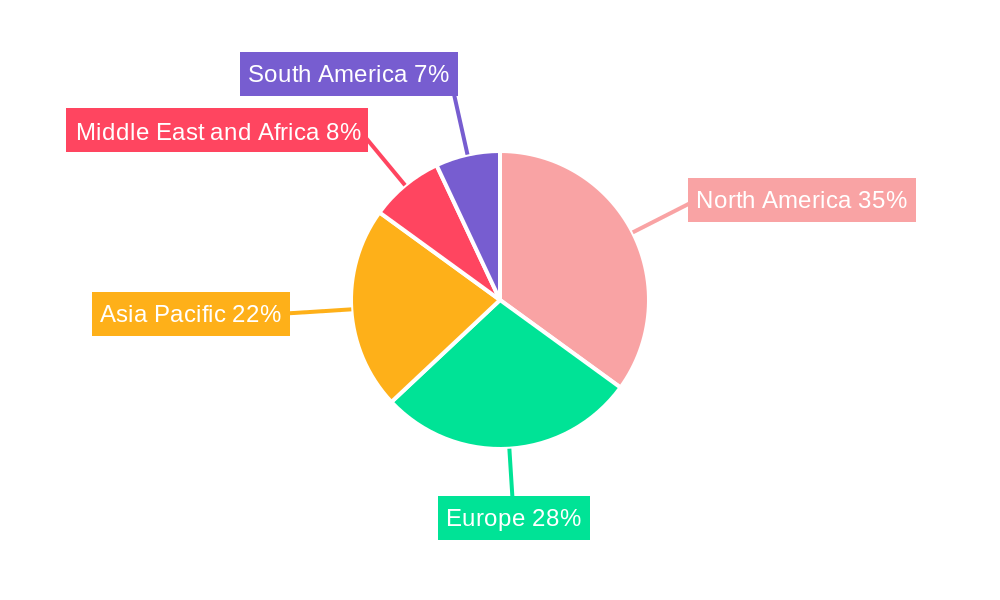
SNP Genotyping Market Regional Market Share
Geographic Coverage of SNP Genotyping Market
SNP Genotyping Market REPORT HIGHLIGHTS
| Aspects | Details |
|---|---|
| Study Period | 2020-2034 |
| Base Year | 2025 |
| Estimated Year | 2026 |
| Forecast Period | 2026-2034 |
| Historical Period | 2020-2025 |
| Growth Rate | CAGR of 3.52% from 2020-2034 |
| Segmentation |
|
Table of Contents
- 1. Introduction
- 1.1. Research Scope
- 1.2. Market Segmentation
- 1.3. Research Objective
- 1.4. Definitions and Assumptions
- 2. Executive Summary
- 2.1. Market Snapshot
- 3. Market Dynamics
- 3.1. Market Drivers
- 3.2. Market Restrains
- 3.3. Market Trends
- 3.4. Market Opportunities
- 4. Market Factor Analysis
- 4.1. Porters Five Forces
- 4.1.1. Bargaining Power of Suppliers
- 4.1.2. Bargaining Power of Buyers
- 4.1.3. Threat of New Entrants
- 4.1.4. Threat of Substitutes
- 4.1.5. Competitive Rivalry
- 4.2. PESTEL analysis
- 4.3. BCG Analysis
- 4.3.1. Stars (High Growth, High Market Share)
- 4.3.2. Cash Cows (Low Growth, High Market Share)
- 4.3.3. Question Mark (High Growth, Low Market Share)
- 4.3.4. Dogs (Low Growth, Low Market Share)
- 4.4. Ansoff Matrix Analysis
- 4.5. Supply Chain Analysis
- 4.6. Regulatory Landscape
- 4.7. Current Market Potential and Opportunity Assessment (TAM–SAM–SOM Framework)
- 4.8. NRP Analyst Note
- 4.1. Porters Five Forces
- 5. Market Analysis, Insights and Forecast 2021-2033
- 5.1. Market Analysis, Insights and Forecast - by Technology
- 5.1.1. TaqMan SNP Genotyping
- 5.1.2. Massarray SNP Genotyping
- 5.1.3. SNP GeneChip Arrays
- 5.1.4. Other Technologies
- 5.2. Market Analysis, Insights and Forecast - by End User
- 5.2.1. Pharmacogenomics
- 5.2.2. Diagnostic Field
- 5.3. Market Analysis, Insights and Forecast - by Region
- 5.3.1. North America
- 5.3.2. Europe
- 5.3.3. Asia Pacific
- 5.3.4. Middle East and Africa
- 5.3.5. South America
- 5.1. Market Analysis, Insights and Forecast - by Technology
- 6. Global SNP Genotyping Market Analysis, Insights and Forecast, 2021-2033
- 6.1. Market Analysis, Insights and Forecast - by Technology
- 6.1.1. TaqMan SNP Genotyping
- 6.1.2. Massarray SNP Genotyping
- 6.1.3. SNP GeneChip Arrays
- 6.1.4. Other Technologies
- 6.2. Market Analysis, Insights and Forecast - by End User
- 6.2.1. Pharmacogenomics
- 6.2.2. Diagnostic Field
- 6.1. Market Analysis, Insights and Forecast - by Technology
- 7. North America SNP Genotyping Market Analysis, Insights and Forecast, 2020-2032
- 7.1. Market Analysis, Insights and Forecast - by Technology
- 7.1.1. TaqMan SNP Genotyping
- 7.1.2. Massarray SNP Genotyping
- 7.1.3. SNP GeneChip Arrays
- 7.1.4. Other Technologies
- 7.2. Market Analysis, Insights and Forecast - by End User
- 7.2.1. Pharmacogenomics
- 7.2.2. Diagnostic Field
- 7.1. Market Analysis, Insights and Forecast - by Technology
- 8. Europe SNP Genotyping Market Analysis, Insights and Forecast, 2020-2032
- 8.1. Market Analysis, Insights and Forecast - by Technology
- 8.1.1. TaqMan SNP Genotyping
- 8.1.2. Massarray SNP Genotyping
- 8.1.3. SNP GeneChip Arrays
- 8.1.4. Other Technologies
- 8.2. Market Analysis, Insights and Forecast - by End User
- 8.2.1. Pharmacogenomics
- 8.2.2. Diagnostic Field
- 8.1. Market Analysis, Insights and Forecast - by Technology
- 9. Asia Pacific SNP Genotyping Market Analysis, Insights and Forecast, 2020-2032
- 9.1. Market Analysis, Insights and Forecast - by Technology
- 9.1.1. TaqMan SNP Genotyping
- 9.1.2. Massarray SNP Genotyping
- 9.1.3. SNP GeneChip Arrays
- 9.1.4. Other Technologies
- 9.2. Market Analysis, Insights and Forecast - by End User
- 9.2.1. Pharmacogenomics
- 9.2.2. Diagnostic Field
- 9.1. Market Analysis, Insights and Forecast - by Technology
- 10. Middle East and Africa SNP Genotyping Market Analysis, Insights and Forecast, 2020-2032
- 10.1. Market Analysis, Insights and Forecast - by Technology
- 10.1.1. TaqMan SNP Genotyping
- 10.1.2. Massarray SNP Genotyping
- 10.1.3. SNP GeneChip Arrays
- 10.1.4. Other Technologies
- 10.2. Market Analysis, Insights and Forecast - by End User
- 10.2.1. Pharmacogenomics
- 10.2.2. Diagnostic Field
- 10.1. Market Analysis, Insights and Forecast - by Technology
- 11. South America SNP Genotyping Market Analysis, Insights and Forecast, 2020-2032
- 11.1. Market Analysis, Insights and Forecast - by Technology
- 11.1.1. TaqMan SNP Genotyping
- 11.1.2. Massarray SNP Genotyping
- 11.1.3. SNP GeneChip Arrays
- 11.1.4. Other Technologies
- 11.2. Market Analysis, Insights and Forecast - by End User
- 11.2.1. Pharmacogenomics
- 11.2.2. Diagnostic Field
- 11.1. Market Analysis, Insights and Forecast - by Technology
- 12. Competitive Analysis
- 12.1. Company Profiles
- 12.1.1 LGC Group
- 12.1.1.1. Company Overview
- 12.1.1.2. Products
- 12.1.1.3. Company Financials
- 12.1.1.4. SWOT Analysis
- 12.1.2 PREMIER Biosoft
- 12.1.2.1. Company Overview
- 12.1.2.2. Products
- 12.1.2.3. Company Financials
- 12.1.2.4. SWOT Analysis
- 12.1.3 Promega Corporation
- 12.1.3.1. Company Overview
- 12.1.3.2. Products
- 12.1.3.3. Company Financials
- 12.1.3.4. SWOT Analysis
- 12.1.4 Bio-Rad Laboratories Inc
- 12.1.4.1. Company Overview
- 12.1.4.2. Products
- 12.1.4.3. Company Financials
- 12.1.4.4. SWOT Analysis
- 12.1.5 Luminex Corp
- 12.1.5.1. Company Overview
- 12.1.5.2. Products
- 12.1.5.3. Company Financials
- 12.1.5.4. SWOT Analysis
- 12.1.6 Douglas Scientific LLC
- 12.1.6.1. Company Overview
- 12.1.6.2. Products
- 12.1.6.3. Company Financials
- 12.1.6.4. SWOT Analysis
- 12.1.7 Danaher Corporation
- 12.1.7.1. Company Overview
- 12.1.7.2. Products
- 12.1.7.3. Company Financials
- 12.1.7.4. SWOT Analysis
- 12.1.8 Agilent Technologies Inc
- 12.1.8.1. Company Overview
- 12.1.8.2. Products
- 12.1.8.3. Company Financials
- 12.1.8.4. SWOT Analysis
- 12.1.9 Thermo Fischer Scientific Inc
- 12.1.9.1. Company Overview
- 12.1.9.2. Products
- 12.1.9.3. Company Financials
- 12.1.9.4. SWOT Analysis
- 12.1.10 Life Technologies Corp
- 12.1.10.1. Company Overview
- 12.1.10.2. Products
- 12.1.10.3. Company Financials
- 12.1.10.4. SWOT Analysis
- 12.1.11 Illumina Inc
- 12.1.11.1. Company Overview
- 12.1.11.2. Products
- 12.1.11.3. Company Financials
- 12.1.11.4. SWOT Analysis
- 12.1.12 Sequenom
- 12.1.12.1. Company Overview
- 12.1.12.2. Products
- 12.1.12.3. Company Financials
- 12.1.12.4. SWOT Analysis
- 12.1.13 Fluidigm Corporation
- 12.1.13.1. Company Overview
- 12.1.13.2. Products
- 12.1.13.3. Company Financials
- 12.1.13.4. SWOT Analysis
- 12.1.1 LGC Group
- 12.2. Market Entropy
- 12.2.1 Company's Key Areas Served
- 12.2.2 Recent Developments
- 12.3. Company Market Share Analysis 2025
- 12.3.1 Top 5 Companies Market Share Analysis
- 12.3.2 Top 3 Companies Market Share Analysis
- 12.4. List of Potential Customers
- 13. Research Methodology
List of Figures
- Figure 1: Global SNP Genotyping Market Revenue Breakdown (billion, %) by Region 2025 & 2033
- Figure 2: Global SNP Genotyping Market Volume Breakdown (K Unit, %) by Region 2025 & 2033
- Figure 3: North America SNP Genotyping Market Revenue (billion), by Technology 2025 & 2033
- Figure 4: North America SNP Genotyping Market Volume (K Unit), by Technology 2025 & 2033
- Figure 5: North America SNP Genotyping Market Revenue Share (%), by Technology 2025 & 2033
- Figure 6: North America SNP Genotyping Market Volume Share (%), by Technology 2025 & 2033
- Figure 7: North America SNP Genotyping Market Revenue (billion), by End User 2025 & 2033
- Figure 8: North America SNP Genotyping Market Volume (K Unit), by End User 2025 & 2033
- Figure 9: North America SNP Genotyping Market Revenue Share (%), by End User 2025 & 2033
- Figure 10: North America SNP Genotyping Market Volume Share (%), by End User 2025 & 2033
- Figure 11: North America SNP Genotyping Market Revenue (billion), by Country 2025 & 2033
- Figure 12: North America SNP Genotyping Market Volume (K Unit), by Country 2025 & 2033
- Figure 13: North America SNP Genotyping Market Revenue Share (%), by Country 2025 & 2033
- Figure 14: North America SNP Genotyping Market Volume Share (%), by Country 2025 & 2033
- Figure 15: Europe SNP Genotyping Market Revenue (billion), by Technology 2025 & 2033
- Figure 16: Europe SNP Genotyping Market Volume (K Unit), by Technology 2025 & 2033
- Figure 17: Europe SNP Genotyping Market Revenue Share (%), by Technology 2025 & 2033
- Figure 18: Europe SNP Genotyping Market Volume Share (%), by Technology 2025 & 2033
- Figure 19: Europe SNP Genotyping Market Revenue (billion), by End User 2025 & 2033
- Figure 20: Europe SNP Genotyping Market Volume (K Unit), by End User 2025 & 2033
- Figure 21: Europe SNP Genotyping Market Revenue Share (%), by End User 2025 & 2033
- Figure 22: Europe SNP Genotyping Market Volume Share (%), by End User 2025 & 2033
- Figure 23: Europe SNP Genotyping Market Revenue (billion), by Country 2025 & 2033
- Figure 24: Europe SNP Genotyping Market Volume (K Unit), by Country 2025 & 2033
- Figure 25: Europe SNP Genotyping Market Revenue Share (%), by Country 2025 & 2033
- Figure 26: Europe SNP Genotyping Market Volume Share (%), by Country 2025 & 2033
- Figure 27: Asia Pacific SNP Genotyping Market Revenue (billion), by Technology 2025 & 2033
- Figure 28: Asia Pacific SNP Genotyping Market Volume (K Unit), by Technology 2025 & 2033
- Figure 29: Asia Pacific SNP Genotyping Market Revenue Share (%), by Technology 2025 & 2033
- Figure 30: Asia Pacific SNP Genotyping Market Volume Share (%), by Technology 2025 & 2033
- Figure 31: Asia Pacific SNP Genotyping Market Revenue (billion), by End User 2025 & 2033
- Figure 32: Asia Pacific SNP Genotyping Market Volume (K Unit), by End User 2025 & 2033
- Figure 33: Asia Pacific SNP Genotyping Market Revenue Share (%), by End User 2025 & 2033
- Figure 34: Asia Pacific SNP Genotyping Market Volume Share (%), by End User 2025 & 2033
- Figure 35: Asia Pacific SNP Genotyping Market Revenue (billion), by Country 2025 & 2033
- Figure 36: Asia Pacific SNP Genotyping Market Volume (K Unit), by Country 2025 & 2033
- Figure 37: Asia Pacific SNP Genotyping Market Revenue Share (%), by Country 2025 & 2033
- Figure 38: Asia Pacific SNP Genotyping Market Volume Share (%), by Country 2025 & 2033
- Figure 39: Middle East and Africa SNP Genotyping Market Revenue (billion), by Technology 2025 & 2033
- Figure 40: Middle East and Africa SNP Genotyping Market Volume (K Unit), by Technology 2025 & 2033
- Figure 41: Middle East and Africa SNP Genotyping Market Revenue Share (%), by Technology 2025 & 2033
- Figure 42: Middle East and Africa SNP Genotyping Market Volume Share (%), by Technology 2025 & 2033
- Figure 43: Middle East and Africa SNP Genotyping Market Revenue (billion), by End User 2025 & 2033
- Figure 44: Middle East and Africa SNP Genotyping Market Volume (K Unit), by End User 2025 & 2033
- Figure 45: Middle East and Africa SNP Genotyping Market Revenue Share (%), by End User 2025 & 2033
- Figure 46: Middle East and Africa SNP Genotyping Market Volume Share (%), by End User 2025 & 2033
- Figure 47: Middle East and Africa SNP Genotyping Market Revenue (billion), by Country 2025 & 2033
- Figure 48: Middle East and Africa SNP Genotyping Market Volume (K Unit), by Country 2025 & 2033
- Figure 49: Middle East and Africa SNP Genotyping Market Revenue Share (%), by Country 2025 & 2033
- Figure 50: Middle East and Africa SNP Genotyping Market Volume Share (%), by Country 2025 & 2033
- Figure 51: South America SNP Genotyping Market Revenue (billion), by Technology 2025 & 2033
- Figure 52: South America SNP Genotyping Market Volume (K Unit), by Technology 2025 & 2033
- Figure 53: South America SNP Genotyping Market Revenue Share (%), by Technology 2025 & 2033
- Figure 54: South America SNP Genotyping Market Volume Share (%), by Technology 2025 & 2033
- Figure 55: South America SNP Genotyping Market Revenue (billion), by End User 2025 & 2033
- Figure 56: South America SNP Genotyping Market Volume (K Unit), by End User 2025 & 2033
- Figure 57: South America SNP Genotyping Market Revenue Share (%), by End User 2025 & 2033
- Figure 58: South America SNP Genotyping Market Volume Share (%), by End User 2025 & 2033
- Figure 59: South America SNP Genotyping Market Revenue (billion), by Country 2025 & 2033
- Figure 60: South America SNP Genotyping Market Volume (K Unit), by Country 2025 & 2033
- Figure 61: South America SNP Genotyping Market Revenue Share (%), by Country 2025 & 2033
- Figure 62: South America SNP Genotyping Market Volume Share (%), by Country 2025 & 2033
List of Tables
- Table 1: Global SNP Genotyping Market Revenue billion Forecast, by Technology 2020 & 2033
- Table 2: Global SNP Genotyping Market Volume K Unit Forecast, by Technology 2020 & 2033
- Table 3: Global SNP Genotyping Market Revenue billion Forecast, by End User 2020 & 2033
- Table 4: Global SNP Genotyping Market Volume K Unit Forecast, by End User 2020 & 2033
- Table 5: Global SNP Genotyping Market Revenue billion Forecast, by Region 2020 & 2033
- Table 6: Global SNP Genotyping Market Volume K Unit Forecast, by Region 2020 & 2033
- Table 7: Global SNP Genotyping Market Revenue billion Forecast, by Technology 2020 & 2033
- Table 8: Global SNP Genotyping Market Volume K Unit Forecast, by Technology 2020 & 2033
- Table 9: Global SNP Genotyping Market Revenue billion Forecast, by End User 2020 & 2033
- Table 10: Global SNP Genotyping Market Volume K Unit Forecast, by End User 2020 & 2033
- Table 11: Global SNP Genotyping Market Revenue billion Forecast, by Country 2020 & 2033
- Table 12: Global SNP Genotyping Market Volume K Unit Forecast, by Country 2020 & 2033
- Table 13: United States SNP Genotyping Market Revenue (billion) Forecast, by Application 2020 & 2033
- Table 14: United States SNP Genotyping Market Volume (K Unit) Forecast, by Application 2020 & 2033
- Table 15: Canada SNP Genotyping Market Revenue (billion) Forecast, by Application 2020 & 2033
- Table 16: Canada SNP Genotyping Market Volume (K Unit) Forecast, by Application 2020 & 2033
- Table 17: Mexico SNP Genotyping Market Revenue (billion) Forecast, by Application 2020 & 2033
- Table 18: Mexico SNP Genotyping Market Volume (K Unit) Forecast, by Application 2020 & 2033
- Table 19: Global SNP Genotyping Market Revenue billion Forecast, by Technology 2020 & 2033
- Table 20: Global SNP Genotyping Market Volume K Unit Forecast, by Technology 2020 & 2033
- Table 21: Global SNP Genotyping Market Revenue billion Forecast, by End User 2020 & 2033
- Table 22: Global SNP Genotyping Market Volume K Unit Forecast, by End User 2020 & 2033
- Table 23: Global SNP Genotyping Market Revenue billion Forecast, by Country 2020 & 2033
- Table 24: Global SNP Genotyping Market Volume K Unit Forecast, by Country 2020 & 2033
- Table 25: Germany SNP Genotyping Market Revenue (billion) Forecast, by Application 2020 & 2033
- Table 26: Germany SNP Genotyping Market Volume (K Unit) Forecast, by Application 2020 & 2033
- Table 27: United Kingdom SNP Genotyping Market Revenue (billion) Forecast, by Application 2020 & 2033
- Table 28: United Kingdom SNP Genotyping Market Volume (K Unit) Forecast, by Application 2020 & 2033
- Table 29: France SNP Genotyping Market Revenue (billion) Forecast, by Application 2020 & 2033
- Table 30: France SNP Genotyping Market Volume (K Unit) Forecast, by Application 2020 & 2033
- Table 31: Italy SNP Genotyping Market Revenue (billion) Forecast, by Application 2020 & 2033
- Table 32: Italy SNP Genotyping Market Volume (K Unit) Forecast, by Application 2020 & 2033
- Table 33: Spain SNP Genotyping Market Revenue (billion) Forecast, by Application 2020 & 2033
- Table 34: Spain SNP Genotyping Market Volume (K Unit) Forecast, by Application 2020 & 2033
- Table 35: Rest of Europe SNP Genotyping Market Revenue (billion) Forecast, by Application 2020 & 2033
- Table 36: Rest of Europe SNP Genotyping Market Volume (K Unit) Forecast, by Application 2020 & 2033
- Table 37: Global SNP Genotyping Market Revenue billion Forecast, by Technology 2020 & 2033
- Table 38: Global SNP Genotyping Market Volume K Unit Forecast, by Technology 2020 & 2033
- Table 39: Global SNP Genotyping Market Revenue billion Forecast, by End User 2020 & 2033
- Table 40: Global SNP Genotyping Market Volume K Unit Forecast, by End User 2020 & 2033
- Table 41: Global SNP Genotyping Market Revenue billion Forecast, by Country 2020 & 2033
- Table 42: Global SNP Genotyping Market Volume K Unit Forecast, by Country 2020 & 2033
- Table 43: China SNP Genotyping Market Revenue (billion) Forecast, by Application 2020 & 2033
- Table 44: China SNP Genotyping Market Volume (K Unit) Forecast, by Application 2020 & 2033
- Table 45: Japan SNP Genotyping Market Revenue (billion) Forecast, by Application 2020 & 2033
- Table 46: Japan SNP Genotyping Market Volume (K Unit) Forecast, by Application 2020 & 2033
- Table 47: India SNP Genotyping Market Revenue (billion) Forecast, by Application 2020 & 2033
- Table 48: India SNP Genotyping Market Volume (K Unit) Forecast, by Application 2020 & 2033
- Table 49: Australia SNP Genotyping Market Revenue (billion) Forecast, by Application 2020 & 2033
- Table 50: Australia SNP Genotyping Market Volume (K Unit) Forecast, by Application 2020 & 2033
- Table 51: South Korea SNP Genotyping Market Revenue (billion) Forecast, by Application 2020 & 2033
- Table 52: South Korea SNP Genotyping Market Volume (K Unit) Forecast, by Application 2020 & 2033
- Table 53: Rest of Asia Pacific SNP Genotyping Market Revenue (billion) Forecast, by Application 2020 & 2033
- Table 54: Rest of Asia Pacific SNP Genotyping Market Volume (K Unit) Forecast, by Application 2020 & 2033
- Table 55: Global SNP Genotyping Market Revenue billion Forecast, by Technology 2020 & 2033
- Table 56: Global SNP Genotyping Market Volume K Unit Forecast, by Technology 2020 & 2033
- Table 57: Global SNP Genotyping Market Revenue billion Forecast, by End User 2020 & 2033
- Table 58: Global SNP Genotyping Market Volume K Unit Forecast, by End User 2020 & 2033
- Table 59: Global SNP Genotyping Market Revenue billion Forecast, by Country 2020 & 2033
- Table 60: Global SNP Genotyping Market Volume K Unit Forecast, by Country 2020 & 2033
- Table 61: GCC SNP Genotyping Market Revenue (billion) Forecast, by Application 2020 & 2033
- Table 62: GCC SNP Genotyping Market Volume (K Unit) Forecast, by Application 2020 & 2033
- Table 63: South Africa SNP Genotyping Market Revenue (billion) Forecast, by Application 2020 & 2033
- Table 64: South Africa SNP Genotyping Market Volume (K Unit) Forecast, by Application 2020 & 2033
- Table 65: Rest of Middle East and Africa SNP Genotyping Market Revenue (billion) Forecast, by Application 2020 & 2033
- Table 66: Rest of Middle East and Africa SNP Genotyping Market Volume (K Unit) Forecast, by Application 2020 & 2033
- Table 67: Global SNP Genotyping Market Revenue billion Forecast, by Technology 2020 & 2033
- Table 68: Global SNP Genotyping Market Volume K Unit Forecast, by Technology 2020 & 2033
- Table 69: Global SNP Genotyping Market Revenue billion Forecast, by End User 2020 & 2033
- Table 70: Global SNP Genotyping Market Volume K Unit Forecast, by End User 2020 & 2033
- Table 71: Global SNP Genotyping Market Revenue billion Forecast, by Country 2020 & 2033
- Table 72: Global SNP Genotyping Market Volume K Unit Forecast, by Country 2020 & 2033
- Table 73: Brazil SNP Genotyping Market Revenue (billion) Forecast, by Application 2020 & 2033
- Table 74: Brazil SNP Genotyping Market Volume (K Unit) Forecast, by Application 2020 & 2033
- Table 75: Argentina SNP Genotyping Market Revenue (billion) Forecast, by Application 2020 & 2033
- Table 76: Argentina SNP Genotyping Market Volume (K Unit) Forecast, by Application 2020 & 2033
- Table 77: Rest of South America SNP Genotyping Market Revenue (billion) Forecast, by Application 2020 & 2033
- Table 78: Rest of South America SNP Genotyping Market Volume (K Unit) Forecast, by Application 2020 & 2033
Frequently Asked Questions
1. What is the projected Compound Annual Growth Rate (CAGR) of the SNP Genotyping Market?
The projected CAGR is approximately 3.52%.
2. Which companies are prominent players in the SNP Genotyping Market?
Key companies in the market include LGC Group, PREMIER Biosoft, Promega Corporation, Bio-Rad Laboratories Inc, Luminex Corp, Douglas Scientific LLC, Danaher Corporation, Agilent Technologies Inc, Thermo Fischer Scientific Inc, Life Technologies Corp, Illumina Inc, Sequenom, Fluidigm Corporation.
3. What are the main segments of the SNP Genotyping Market?
The market segments include Technology, End User.
4. Can you provide details about the market size?
The market size is estimated to be USD 6.48 billion as of 2022.
5. What are some drivers contributing to market growth?
Miniaturisation of Equipment and Instruments; Increased Multiplexing Capacity Leading to Increased Application.
6. What are the notable trends driving market growth?
Pharmacogenomics Segment Expected to Witness High Growth Over the Forecast Period.
7. Are there any restraints impacting market growth?
Lack of Standardisation in SNP Processes; Privacy Concerns Pose a Threat to Broad Technology Adoption.
8. Can you provide examples of recent developments in the market?
Feb 2021: Novacyt launched its SNPsig portfolio of PCR genotyping assays that can be used to aid the diagnosis of new variants of SARS-CoV-2.
9. What pricing options are available for accessing the report?
Pricing options include single-user, multi-user, and enterprise licenses priced at USD 4750, USD 5250, and USD 8750 respectively.
10. Is the market size provided in terms of value or volume?
The market size is provided in terms of value, measured in billion and volume, measured in K Unit.
11. Are there any specific market keywords associated with the report?
Yes, the market keyword associated with the report is "SNP Genotyping Market," which aids in identifying and referencing the specific market segment covered.
12. How do I determine which pricing option suits my needs best?
The pricing options vary based on user requirements and access needs. Individual users may opt for single-user licenses, while businesses requiring broader access may choose multi-user or enterprise licenses for cost-effective access to the report.
13. Are there any additional resources or data provided in the SNP Genotyping Market report?
While the report offers comprehensive insights, it's advisable to review the specific contents or supplementary materials provided to ascertain if additional resources or data are available.
14. How can I stay updated on further developments or reports in the SNP Genotyping Market?
To stay informed about further developments, trends, and reports in the SNP Genotyping Market, consider subscribing to industry newsletters, following relevant companies and organizations, or regularly checking reputable industry news sources and publications.
Methodology
Step 1 - Identification of Relevant Samples Size from Population Database


Step 2 - Approaches for Defining Global Market Size (Value, Volume* & Price*)

Note*: In applicable scenarios
Step 3 - Data Sources
Primary Research
- Web Analytics
- Survey Reports
- Research Institute
- Latest Research Reports
- Opinion Leaders
Secondary Research
- Annual Reports
- White Paper
- Latest Press Release
- Industry Association
- Paid Database
- Investor Presentations

Step 4 - Data Triangulation
Involves using different sources of information in order to increase the validity of a study
These sources are likely to be stakeholders in a program - participants, other researchers, program staff, other community members, and so on.
Then we put all data in single framework & apply various statistical tools to find out the dynamic on the market.
During the analysis stage, feedback from the stakeholder groups would be compared to determine areas of agreement as well as areas of divergence