

Key Insights
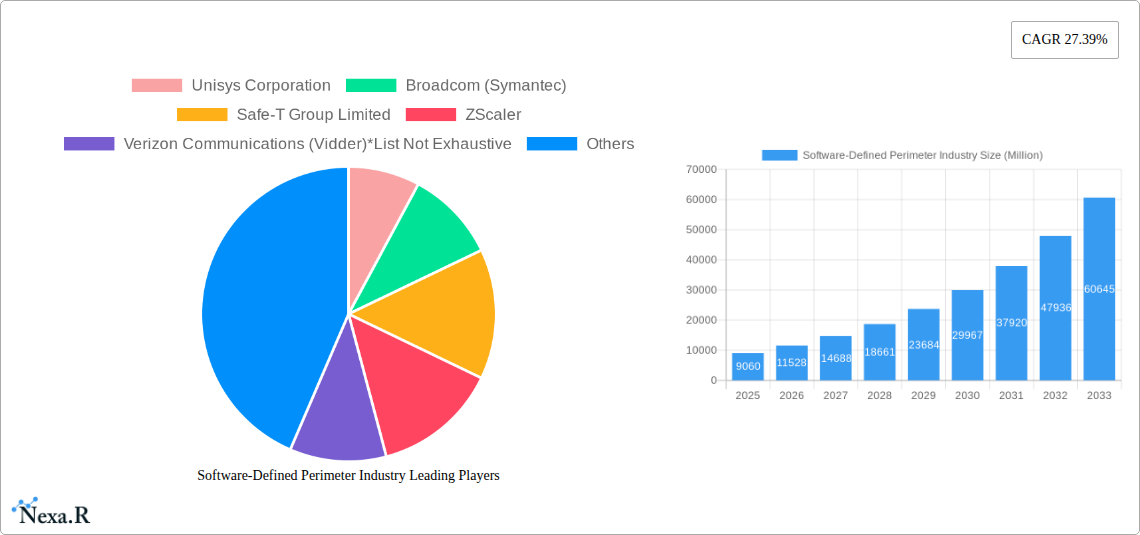
The Software-Defined Perimeter (SDP) market is experiencing robust growth, projected to reach a valuation of $9.06 billion in 2025 and exhibiting a Compound Annual Growth Rate (CAGR) of 27.39% from 2025 to 2033. This expansion is fueled by several key factors. Increasing cyber threats and the rising adoption of cloud computing and remote work models are driving the demand for secure access solutions. SDP's ability to provide granular access control and enhanced security compared to traditional VPNs is a significant advantage. The market is segmented by end-user verticals (BFSI, Telecom & IT, Healthcare, Retail, Government, and Others), solution types (Solutions and Services), and deployment modes (Cloud and On-Premise). The BFSI sector is a major adopter, given its stringent regulatory compliance and sensitivity to data breaches. The growth of cloud-based SDP solutions reflects the broader industry trend towards cloud adoption for increased scalability and flexibility. Competitive forces are strong, with key players like Unisys, Broadcom (Symantec), Safe-T Group, ZScaler, and Cisco continuously innovating and expanding their offerings.
The continued adoption of SDP is expected to accelerate through 2033. Government initiatives promoting cybersecurity and data privacy will further stimulate market growth. Challenges such as integration complexities and the need for skilled professionals to manage SDP deployments might hinder wider adoption initially. However, these obstacles are likely to be overcome with ongoing technological advancements and increased market maturity. The increasing sophistication of cyberattacks and the ever-expanding attack surface presented by remote work necessitates robust security solutions, making SDP a critical investment for organizations across various sectors. The Asia-Pacific region, driven by expanding digital economies and increasing cybersecurity awareness, is predicted to demonstrate significant growth potential in the coming years. This strong demand and technological advancements suggest the SDP market's upward trajectory will continue, making it an attractive investment area and an essential component of modern cybersecurity strategies.
Software-Defined Perimeter (SDP) Industry Market Report: 2019-2033
This comprehensive report provides a detailed analysis of the Software-Defined Perimeter (SDP) industry, encompassing market dynamics, growth trends, regional analysis, competitive landscape, and future outlook. The study period covers 2019-2033, with 2025 as the base and estimated year. The report offers invaluable insights for industry professionals, investors, and strategic decision-makers seeking to understand and capitalize on the burgeoning SDP market. The total market size is predicted to reach xx Million by 2033.
Software-Defined Perimeter Industry Market Dynamics & Structure
The Software-Defined Perimeter (SDP) market is experiencing significant growth driven by the increasing adoption of cloud computing, remote work, and the need for enhanced cybersecurity. Market concentration is moderate, with several key players vying for market share. Technological innovation, particularly in zero-trust security architectures and AI-driven threat detection, are key drivers. Regulatory frameworks, such as GDPR and CCPA, are indirectly influencing market growth by increasing the demand for robust security solutions. Competitive substitutes include traditional VPNs and firewalls, but SDP's superior security posture is driving market shift. M&A activity is moderate, with strategic acquisitions aimed at expanding product portfolios and geographic reach.
- Market Concentration: Moderate, with top 5 players holding approximately xx% market share in 2024.
- Technological Innovation: Focus on AI/ML for threat detection, seamless integration with cloud platforms, and enhanced user experience.
- Regulatory Frameworks: GDPR, CCPA, and similar regulations are indirectly driving demand for more secure access solutions.
- Competitive Substitutes: Traditional VPNs and firewalls, but SDP offers stronger security and scalability.
- M&A Activity: xx deals recorded between 2019 and 2024, focused on technology acquisition and market expansion.
- End-User Demographics: Shift towards cloud-native applications and increased remote workforce driving SDP adoption.
Software-Defined Perimeter Industry Growth Trends & Insights
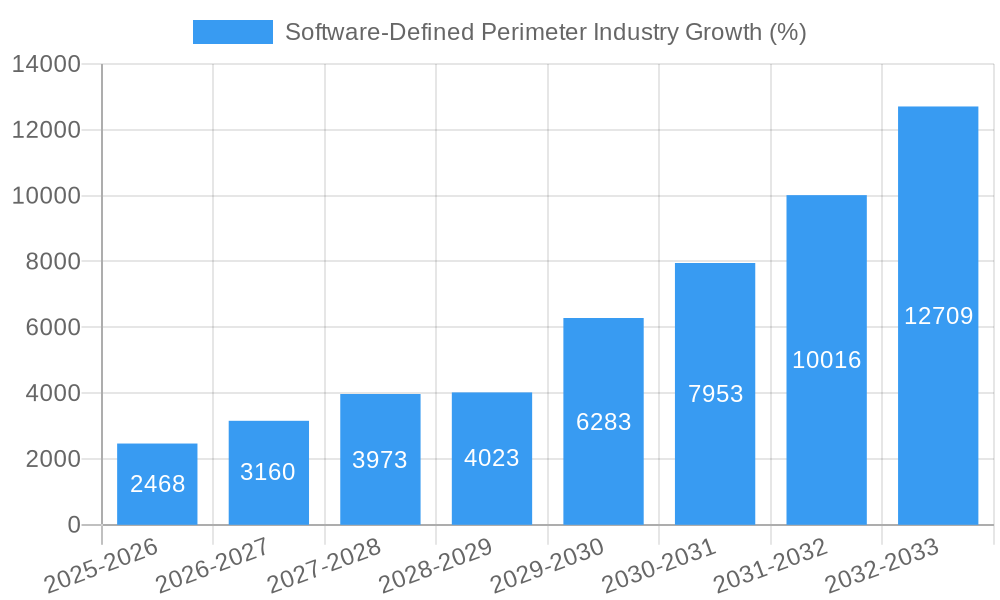
The SDP market exhibited a Compound Annual Growth Rate (CAGR) of xx% during the historical period (2019-2024), reaching a market size of xx Million in 2024. This robust growth is projected to continue throughout the forecast period (2025-2033), driven by the increasing adoption of cloud-based services, the expansion of remote workforces, and growing concerns over cybersecurity threats. Market penetration is expected to increase significantly, particularly within sectors with sensitive data such as BFSI and Healthcare. Technological advancements, such as the integration of SDP with other security solutions and automation, will further drive adoption. Consumer behavior shifts towards greater security awareness are also boosting market growth. The market is expected to reach xx Million in 2025 and xx Million by 2033, exhibiting a CAGR of xx%.
Dominant Regions, Countries, or Segments in Software-Defined Perimeter Industry
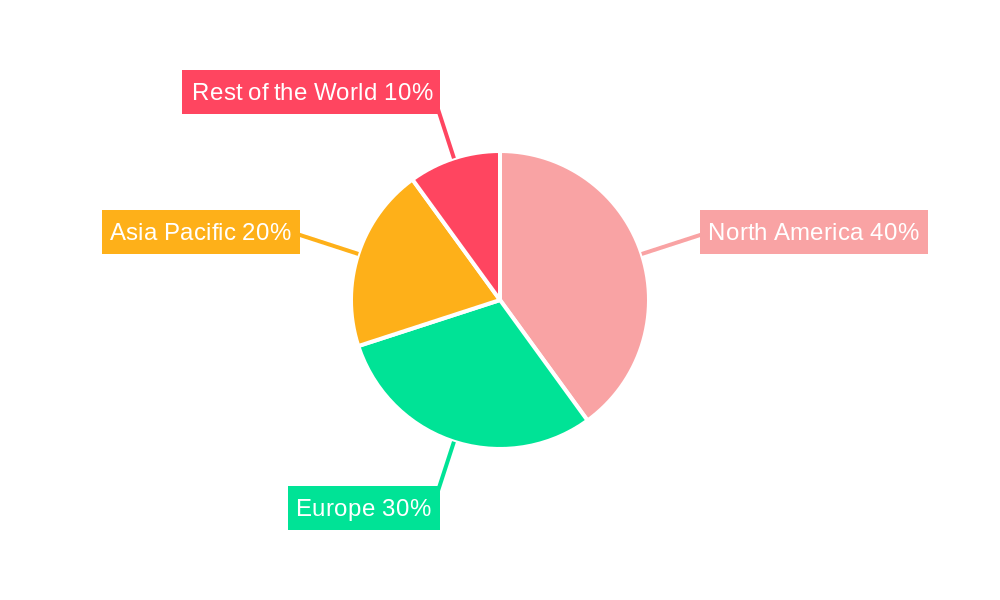
North America currently dominates the SDP market, driven by high technological adoption rates, strong regulatory frameworks, and the presence of major industry players. Within End-User Verticals, BFSI (Banking, Financial Services, and Insurance) exhibits the highest growth, followed by Telecom and IT. The Cloud deployment mode holds the largest market share due to its scalability and cost-effectiveness.
- Leading Region: North America, driven by early adoption, strong security awareness, and large IT spending.
- Leading End-User Vertical: BFSI, due to stringent regulatory compliance needs and sensitive data protection requirements.
- Leading Deployment Mode: Cloud, offering scalability, flexibility, and cost-effectiveness.
- Key Drivers (North America): Robust IT infrastructure, high technological adoption, and presence of major technology companies.
- Key Drivers (BFSI): Regulatory compliance needs, sensitive data protection, and focus on enhanced security measures.
Software-Defined Perimeter Industry Product Landscape
SDP solutions offer a range of features, including granular access control, micro-segmentation, and automated policy enforcement. Innovations focus on enhancing user experience, integrating with existing security infrastructure, and leveraging AI/ML for advanced threat detection. Key features include single-sign-on (SSO), multi-factor authentication (MFA), and real-time threat monitoring. These solutions offer significantly improved security and scalability compared to traditional VPNs, a major selling proposition attracting clients. Technological advancements include integration with cloud-native architectures like Kubernetes, improving overall security posture and flexibility.
Key Drivers, Barriers & Challenges in Software-Defined Perimeter Industry
Key Drivers: Increasing adoption of cloud-based applications, rising cybersecurity threats, growth of remote workforces, and the demand for enhanced security and compliance. The shift towards zero-trust security architectures is a major driver.
Challenges: Integration complexities with legacy systems, skilled workforce shortages, and high initial investment costs can hinder adoption. Competition from established security vendors and the need for ongoing maintenance and updates pose additional challenges. Regulatory compliance complexity, particularly for global organizations, can also hinder market growth. The predicted impact of these challenges on market growth is a reduction of approximately xx% by 2033.
Emerging Opportunities in Software-Defined Perimeter Industry
Emerging opportunities lie in expanding into untapped markets (e.g., developing economies), integrating SDP with IoT devices and expanding into edge computing environments, and developing specialized solutions for specific industry verticals. Opportunities also exist in developing more user-friendly interfaces and integrating SDP with advanced threat detection technologies.
Growth Accelerators in the Software-Defined Perimeter Industry Industry
Technological breakthroughs like AI-driven threat intelligence and seamless integration with cloud platforms are key growth accelerators. Strategic partnerships between SDP vendors and other security solution providers will also fuel market growth. Market expansion strategies, particularly into emerging economies and untapped verticals, will further drive market expansion.
Key Players Shaping the Software-Defined Perimeter Industry Market
- Unisys Corporation
- Broadcom (Symantec)
- Safe-T Group Limited
- ZScaler
- Verizon Communications (Vidder)
- Cato Networks Limited
- Cisco Systems Inc
- Fortinet Corporation
- APPGate
- Perimeter
- Okta Inc
- Akamai Technologies Inc (Soha Systems)
- Palo Alto Networks Inc
- Check Point
Notable Milestones in Software-Defined Perimeter Industry Sector
- January 2023: InstaSafe expands its product base across India and SAARC through a partnership with iValue InfoSolutions, boosting SDP adoption in the region.
- February 2022: Appgate extends SDP solution support for Kubernetes clusters, enhancing zero-trust security in cloud-native environments.
In-Depth Software-Defined Perimeter Industry Market Outlook
The Software-Defined Perimeter market holds significant future potential, driven by the continuous growth of cloud adoption, remote work, and heightened cybersecurity concerns. Strategic partnerships, technological innovations, and expansion into new markets will be key factors in shaping the market's future trajectory. The market is poised for sustained growth, presenting lucrative opportunities for both established players and new entrants.
Software-Defined Perimeter Industry Segmentation
-
1. Type
- 1.1. Solutions
- 1.2. Services
-
2. Deployment Mode
- 2.1. Cloud
- 2.2. On-Premise
-
3. End-User Verticals
- 3.1. BFSI
- 3.2. Telecom and IT
- 3.3. Healthcare
- 3.4. Retail
- 3.5. Government
- 3.6. Other End-user Verticals
Software-Defined Perimeter Industry Segmentation By Geography
- 1. North America
- 2. Europe
- 3. Asia Pacific
- 4. Rest of the World
Software-Defined Perimeter Industry REPORT HIGHLIGHTS
| Aspects | Details |
|---|---|
| Study Period | 2019-2033 |
| Base Year | 2024 |
| Estimated Year | 2025 |
| Forecast Period | 2025-2033 |
| Historical Period | 2019-2024 |
| Growth Rate | CAGR of 27.39% from 2019-2033 |
| Segmentation |
|
Table of Contents
- 1. Introduction
- 1.1. Research Scope
- 1.2. Market Segmentation
- 1.3. Research Methodology
- 1.4. Definitions and Assumptions
- 2. Executive Summary
- 2.1. Introduction
- 3. Market Dynamics
- 3.1. Introduction
- 3.2. Market Drivers
- 3.2.1 Ongoing Migration to The Cloud
- 3.2.2 Adoption of IoT & BYOD; Stringent Data Compliance Requirements and Need for Scalable Data Safeguarding Strategies
- 3.3. Market Restrains
- 3.3.1. Growing Demand for Open-Source Security Standards
- 3.4. Market Trends
- 3.4.1. BFSI Sector Will Experience Significant Growth
- 4. Market Factor Analysis
- 4.1. Porters Five Forces
- 4.2. Supply/Value Chain
- 4.3. PESTEL analysis
- 4.4. Market Entropy
- 4.5. Patent/Trademark Analysis
- 5. Global Software-Defined Perimeter Industry Analysis, Insights and Forecast, 2019-2031
- 5.1. Market Analysis, Insights and Forecast - by Type
- 5.1.1. Solutions
- 5.1.2. Services
- 5.2. Market Analysis, Insights and Forecast - by Deployment Mode
- 5.2.1. Cloud
- 5.2.2. On-Premise
- 5.3. Market Analysis, Insights and Forecast - by End-User Verticals
- 5.3.1. BFSI
- 5.3.2. Telecom and IT
- 5.3.3. Healthcare
- 5.3.4. Retail
- 5.3.5. Government
- 5.3.6. Other End-user Verticals
- 5.4. Market Analysis, Insights and Forecast - by Region
- 5.4.1. North America
- 5.4.2. Europe
- 5.4.3. Asia Pacific
- 5.4.4. Rest of the World
- 5.1. Market Analysis, Insights and Forecast - by Type
- 6. North America Software-Defined Perimeter Industry Analysis, Insights and Forecast, 2019-2031
- 6.1. Market Analysis, Insights and Forecast - by Type
- 6.1.1. Solutions
- 6.1.2. Services
- 6.2. Market Analysis, Insights and Forecast - by Deployment Mode
- 6.2.1. Cloud
- 6.2.2. On-Premise
- 6.3. Market Analysis, Insights and Forecast - by End-User Verticals
- 6.3.1. BFSI
- 6.3.2. Telecom and IT
- 6.3.3. Healthcare
- 6.3.4. Retail
- 6.3.5. Government
- 6.3.6. Other End-user Verticals
- 6.1. Market Analysis, Insights and Forecast - by Type
- 7. Europe Software-Defined Perimeter Industry Analysis, Insights and Forecast, 2019-2031
- 7.1. Market Analysis, Insights and Forecast - by Type
- 7.1.1. Solutions
- 7.1.2. Services
- 7.2. Market Analysis, Insights and Forecast - by Deployment Mode
- 7.2.1. Cloud
- 7.2.2. On-Premise
- 7.3. Market Analysis, Insights and Forecast - by End-User Verticals
- 7.3.1. BFSI
- 7.3.2. Telecom and IT
- 7.3.3. Healthcare
- 7.3.4. Retail
- 7.3.5. Government
- 7.3.6. Other End-user Verticals
- 7.1. Market Analysis, Insights and Forecast - by Type
- 8. Asia Pacific Software-Defined Perimeter Industry Analysis, Insights and Forecast, 2019-2031
- 8.1. Market Analysis, Insights and Forecast - by Type
- 8.1.1. Solutions
- 8.1.2. Services
- 8.2. Market Analysis, Insights and Forecast - by Deployment Mode
- 8.2.1. Cloud
- 8.2.2. On-Premise
- 8.3. Market Analysis, Insights and Forecast - by End-User Verticals
- 8.3.1. BFSI
- 8.3.2. Telecom and IT
- 8.3.3. Healthcare
- 8.3.4. Retail
- 8.3.5. Government
- 8.3.6. Other End-user Verticals
- 8.1. Market Analysis, Insights and Forecast - by Type
- 9. Rest of the World Software-Defined Perimeter Industry Analysis, Insights and Forecast, 2019-2031
- 9.1. Market Analysis, Insights and Forecast - by Type
- 9.1.1. Solutions
- 9.1.2. Services
- 9.2. Market Analysis, Insights and Forecast - by Deployment Mode
- 9.2.1. Cloud
- 9.2.2. On-Premise
- 9.3. Market Analysis, Insights and Forecast - by End-User Verticals
- 9.3.1. BFSI
- 9.3.2. Telecom and IT
- 9.3.3. Healthcare
- 9.3.4. Retail
- 9.3.5. Government
- 9.3.6. Other End-user Verticals
- 9.1. Market Analysis, Insights and Forecast - by Type
- 10. North America Software-Defined Perimeter Industry Analysis, Insights and Forecast, 2019-2031
- 10.1. Market Analysis, Insights and Forecast - By Country/Sub-region
- 10.1.1.
- 11. Europe Software-Defined Perimeter Industry Analysis, Insights and Forecast, 2019-2031
- 11.1. Market Analysis, Insights and Forecast - By Country/Sub-region
- 11.1.1.
- 12. Asia Pacific Software-Defined Perimeter Industry Analysis, Insights and Forecast, 2019-2031
- 12.1. Market Analysis, Insights and Forecast - By Country/Sub-region
- 12.1.1.
- 13. Rest of the World Software-Defined Perimeter Industry Analysis, Insights and Forecast, 2019-2031
- 13.1. Market Analysis, Insights and Forecast - By Country/Sub-region
- 13.1.1.
- 14. Competitive Analysis
- 14.1. Global Market Share Analysis 2024
- 14.2. Company Profiles
- 14.2.1 Unisys Corporation
- 14.2.1.1. Overview
- 14.2.1.2. Products
- 14.2.1.3. SWOT Analysis
- 14.2.1.4. Recent Developments
- 14.2.1.5. Financials (Based on Availability)
- 14.2.2 Broadcom (Symantec)
- 14.2.2.1. Overview
- 14.2.2.2. Products
- 14.2.2.3. SWOT Analysis
- 14.2.2.4. Recent Developments
- 14.2.2.5. Financials (Based on Availability)
- 14.2.3 Safe-T Group Limited
- 14.2.3.1. Overview
- 14.2.3.2. Products
- 14.2.3.3. SWOT Analysis
- 14.2.3.4. Recent Developments
- 14.2.3.5. Financials (Based on Availability)
- 14.2.4 ZScaler
- 14.2.4.1. Overview
- 14.2.4.2. Products
- 14.2.4.3. SWOT Analysis
- 14.2.4.4. Recent Developments
- 14.2.4.5. Financials (Based on Availability)
- 14.2.5 Verizon Communications (Vidder)*List Not Exhaustive
- 14.2.5.1. Overview
- 14.2.5.2. Products
- 14.2.5.3. SWOT Analysis
- 14.2.5.4. Recent Developments
- 14.2.5.5. Financials (Based on Availability)
- 14.2.6 Cato Networks Limited
- 14.2.6.1. Overview
- 14.2.6.2. Products
- 14.2.6.3. SWOT Analysis
- 14.2.6.4. Recent Developments
- 14.2.6.5. Financials (Based on Availability)
- 14.2.7 Cisco Systems Inc
- 14.2.7.1. Overview
- 14.2.7.2. Products
- 14.2.7.3. SWOT Analysis
- 14.2.7.4. Recent Developments
- 14.2.7.5. Financials (Based on Availability)
- 14.2.8 Fortinent Corporation
- 14.2.8.1. Overview
- 14.2.8.2. Products
- 14.2.8.3. SWOT Analysis
- 14.2.8.4. Recent Developments
- 14.2.8.5. Financials (Based on Availability)
- 14.2.9 APPGate
- 14.2.9.1. Overview
- 14.2.9.2. Products
- 14.2.9.3. SWOT Analysis
- 14.2.9.4. Recent Developments
- 14.2.9.5. Financials (Based on Availability)
- 14.2.10 Perimeter
- 14.2.10.1. Overview
- 14.2.10.2. Products
- 14.2.10.3. SWOT Analysis
- 14.2.10.4. Recent Developments
- 14.2.10.5. Financials (Based on Availability)
- 14.2.11 Okta Inc
- 14.2.11.1. Overview
- 14.2.11.2. Products
- 14.2.11.3. SWOT Analysis
- 14.2.11.4. Recent Developments
- 14.2.11.5. Financials (Based on Availability)
- 14.2.12 Akamai Technologies Inc (Soha Systems)
- 14.2.12.1. Overview
- 14.2.12.2. Products
- 14.2.12.3. SWOT Analysis
- 14.2.12.4. Recent Developments
- 14.2.12.5. Financials (Based on Availability)
- 14.2.13 Palo Alto Networks Inc
- 14.2.13.1. Overview
- 14.2.13.2. Products
- 14.2.13.3. SWOT Analysis
- 14.2.13.4. Recent Developments
- 14.2.13.5. Financials (Based on Availability)
- 14.2.14 Check Point
- 14.2.14.1. Overview
- 14.2.14.2. Products
- 14.2.14.3. SWOT Analysis
- 14.2.14.4. Recent Developments
- 14.2.14.5. Financials (Based on Availability)
- 14.2.1 Unisys Corporation
List of Figures
- Figure 1: Global Software-Defined Perimeter Industry Revenue Breakdown (Million, %) by Region 2024 & 2032
- Figure 2: North America Software-Defined Perimeter Industry Revenue (Million), by Country 2024 & 2032
- Figure 3: North America Software-Defined Perimeter Industry Revenue Share (%), by Country 2024 & 2032
- Figure 4: Europe Software-Defined Perimeter Industry Revenue (Million), by Country 2024 & 2032
- Figure 5: Europe Software-Defined Perimeter Industry Revenue Share (%), by Country 2024 & 2032
- Figure 6: Asia Pacific Software-Defined Perimeter Industry Revenue (Million), by Country 2024 & 2032
- Figure 7: Asia Pacific Software-Defined Perimeter Industry Revenue Share (%), by Country 2024 & 2032
- Figure 8: Rest of the World Software-Defined Perimeter Industry Revenue (Million), by Country 2024 & 2032
- Figure 9: Rest of the World Software-Defined Perimeter Industry Revenue Share (%), by Country 2024 & 2032
- Figure 10: North America Software-Defined Perimeter Industry Revenue (Million), by Type 2024 & 2032
- Figure 11: North America Software-Defined Perimeter Industry Revenue Share (%), by Type 2024 & 2032
- Figure 12: North America Software-Defined Perimeter Industry Revenue (Million), by Deployment Mode 2024 & 2032
- Figure 13: North America Software-Defined Perimeter Industry Revenue Share (%), by Deployment Mode 2024 & 2032
- Figure 14: North America Software-Defined Perimeter Industry Revenue (Million), by End-User Verticals 2024 & 2032
- Figure 15: North America Software-Defined Perimeter Industry Revenue Share (%), by End-User Verticals 2024 & 2032
- Figure 16: North America Software-Defined Perimeter Industry Revenue (Million), by Country 2024 & 2032
- Figure 17: North America Software-Defined Perimeter Industry Revenue Share (%), by Country 2024 & 2032
- Figure 18: Europe Software-Defined Perimeter Industry Revenue (Million), by Type 2024 & 2032
- Figure 19: Europe Software-Defined Perimeter Industry Revenue Share (%), by Type 2024 & 2032
- Figure 20: Europe Software-Defined Perimeter Industry Revenue (Million), by Deployment Mode 2024 & 2032
- Figure 21: Europe Software-Defined Perimeter Industry Revenue Share (%), by Deployment Mode 2024 & 2032
- Figure 22: Europe Software-Defined Perimeter Industry Revenue (Million), by End-User Verticals 2024 & 2032
- Figure 23: Europe Software-Defined Perimeter Industry Revenue Share (%), by End-User Verticals 2024 & 2032
- Figure 24: Europe Software-Defined Perimeter Industry Revenue (Million), by Country 2024 & 2032
- Figure 25: Europe Software-Defined Perimeter Industry Revenue Share (%), by Country 2024 & 2032
- Figure 26: Asia Pacific Software-Defined Perimeter Industry Revenue (Million), by Type 2024 & 2032
- Figure 27: Asia Pacific Software-Defined Perimeter Industry Revenue Share (%), by Type 2024 & 2032
- Figure 28: Asia Pacific Software-Defined Perimeter Industry Revenue (Million), by Deployment Mode 2024 & 2032
- Figure 29: Asia Pacific Software-Defined Perimeter Industry Revenue Share (%), by Deployment Mode 2024 & 2032
- Figure 30: Asia Pacific Software-Defined Perimeter Industry Revenue (Million), by End-User Verticals 2024 & 2032
- Figure 31: Asia Pacific Software-Defined Perimeter Industry Revenue Share (%), by End-User Verticals 2024 & 2032
- Figure 32: Asia Pacific Software-Defined Perimeter Industry Revenue (Million), by Country 2024 & 2032
- Figure 33: Asia Pacific Software-Defined Perimeter Industry Revenue Share (%), by Country 2024 & 2032
- Figure 34: Rest of the World Software-Defined Perimeter Industry Revenue (Million), by Type 2024 & 2032
- Figure 35: Rest of the World Software-Defined Perimeter Industry Revenue Share (%), by Type 2024 & 2032
- Figure 36: Rest of the World Software-Defined Perimeter Industry Revenue (Million), by Deployment Mode 2024 & 2032
- Figure 37: Rest of the World Software-Defined Perimeter Industry Revenue Share (%), by Deployment Mode 2024 & 2032
- Figure 38: Rest of the World Software-Defined Perimeter Industry Revenue (Million), by End-User Verticals 2024 & 2032
- Figure 39: Rest of the World Software-Defined Perimeter Industry Revenue Share (%), by End-User Verticals 2024 & 2032
- Figure 40: Rest of the World Software-Defined Perimeter Industry Revenue (Million), by Country 2024 & 2032
- Figure 41: Rest of the World Software-Defined Perimeter Industry Revenue Share (%), by Country 2024 & 2032
List of Tables
- Table 1: Global Software-Defined Perimeter Industry Revenue Million Forecast, by Region 2019 & 2032
- Table 2: Global Software-Defined Perimeter Industry Revenue Million Forecast, by Type 2019 & 2032
- Table 3: Global Software-Defined Perimeter Industry Revenue Million Forecast, by Deployment Mode 2019 & 2032
- Table 4: Global Software-Defined Perimeter Industry Revenue Million Forecast, by End-User Verticals 2019 & 2032
- Table 5: Global Software-Defined Perimeter Industry Revenue Million Forecast, by Region 2019 & 2032
- Table 6: Global Software-Defined Perimeter Industry Revenue Million Forecast, by Country 2019 & 2032
- Table 7: Software-Defined Perimeter Industry Revenue (Million) Forecast, by Application 2019 & 2032
- Table 8: Global Software-Defined Perimeter Industry Revenue Million Forecast, by Country 2019 & 2032
- Table 9: Software-Defined Perimeter Industry Revenue (Million) Forecast, by Application 2019 & 2032
- Table 10: Global Software-Defined Perimeter Industry Revenue Million Forecast, by Country 2019 & 2032
- Table 11: Software-Defined Perimeter Industry Revenue (Million) Forecast, by Application 2019 & 2032
- Table 12: Global Software-Defined Perimeter Industry Revenue Million Forecast, by Country 2019 & 2032
- Table 13: Software-Defined Perimeter Industry Revenue (Million) Forecast, by Application 2019 & 2032
- Table 14: Global Software-Defined Perimeter Industry Revenue Million Forecast, by Type 2019 & 2032
- Table 15: Global Software-Defined Perimeter Industry Revenue Million Forecast, by Deployment Mode 2019 & 2032
- Table 16: Global Software-Defined Perimeter Industry Revenue Million Forecast, by End-User Verticals 2019 & 2032
- Table 17: Global Software-Defined Perimeter Industry Revenue Million Forecast, by Country 2019 & 2032
- Table 18: Global Software-Defined Perimeter Industry Revenue Million Forecast, by Type 2019 & 2032
- Table 19: Global Software-Defined Perimeter Industry Revenue Million Forecast, by Deployment Mode 2019 & 2032
- Table 20: Global Software-Defined Perimeter Industry Revenue Million Forecast, by End-User Verticals 2019 & 2032
- Table 21: Global Software-Defined Perimeter Industry Revenue Million Forecast, by Country 2019 & 2032
- Table 22: Global Software-Defined Perimeter Industry Revenue Million Forecast, by Type 2019 & 2032
- Table 23: Global Software-Defined Perimeter Industry Revenue Million Forecast, by Deployment Mode 2019 & 2032
- Table 24: Global Software-Defined Perimeter Industry Revenue Million Forecast, by End-User Verticals 2019 & 2032
- Table 25: Global Software-Defined Perimeter Industry Revenue Million Forecast, by Country 2019 & 2032
- Table 26: Global Software-Defined Perimeter Industry Revenue Million Forecast, by Type 2019 & 2032
- Table 27: Global Software-Defined Perimeter Industry Revenue Million Forecast, by Deployment Mode 2019 & 2032
- Table 28: Global Software-Defined Perimeter Industry Revenue Million Forecast, by End-User Verticals 2019 & 2032
- Table 29: Global Software-Defined Perimeter Industry Revenue Million Forecast, by Country 2019 & 2032
Frequently Asked Questions
1. What is the projected Compound Annual Growth Rate (CAGR) of the Software-Defined Perimeter Industry?
The projected CAGR is approximately 27.39%.
2. Which companies are prominent players in the Software-Defined Perimeter Industry?
Key companies in the market include Unisys Corporation, Broadcom (Symantec), Safe-T Group Limited, ZScaler, Verizon Communications (Vidder)*List Not Exhaustive, Cato Networks Limited, Cisco Systems Inc, Fortinent Corporation, APPGate, Perimeter, Okta Inc, Akamai Technologies Inc (Soha Systems), Palo Alto Networks Inc, Check Point.
3. What are the main segments of the Software-Defined Perimeter Industry?
The market segments include Type, Deployment Mode, End-User Verticals.
4. Can you provide details about the market size?
The market size is estimated to be USD 9.06 Million as of 2022.
5. What are some drivers contributing to market growth?
Ongoing Migration to The Cloud. Adoption of IoT & BYOD; Stringent Data Compliance Requirements and Need for Scalable Data Safeguarding Strategies.
6. What are the notable trends driving market growth?
BFSI Sector Will Experience Significant Growth.
7. Are there any restraints impacting market growth?
Growing Demand for Open-Source Security Standards.
8. Can you provide examples of recent developments in the market?
January 2023: InstaSafe, a Bangalore-based security service provider, announced the expansion of its product base across India and SAARC by partnering with iValue InfoSolutions, a technology services and solutions aggregator across India and South-East Asia. Both organizations are working towards promoting software-defined perimeter (SDP) based zero trust security solutions to address cloud security, identity management, and remote access across the Indian subcontinent.
9. What pricing options are available for accessing the report?
Pricing options include single-user, multi-user, and enterprise licenses priced at USD 4750, USD 5250, and USD 8750 respectively.
10. Is the market size provided in terms of value or volume?
The market size is provided in terms of value, measured in Million.
11. Are there any specific market keywords associated with the report?
Yes, the market keyword associated with the report is "Software-Defined Perimeter Industry," which aids in identifying and referencing the specific market segment covered.
12. How do I determine which pricing option suits my needs best?
The pricing options vary based on user requirements and access needs. Individual users may opt for single-user licenses, while businesses requiring broader access may choose multi-user or enterprise licenses for cost-effective access to the report.
13. Are there any additional resources or data provided in the Software-Defined Perimeter Industry report?
While the report offers comprehensive insights, it's advisable to review the specific contents or supplementary materials provided to ascertain if additional resources or data are available.
14. How can I stay updated on further developments or reports in the Software-Defined Perimeter Industry?
To stay informed about further developments, trends, and reports in the Software-Defined Perimeter Industry, consider subscribing to industry newsletters, following relevant companies and organizations, or regularly checking reputable industry news sources and publications.
Methodology
Step 1 - Identification of Relevant Samples Size from Population Database


Step 2 - Approaches for Defining Global Market Size (Value, Volume* & Price*)

Note*: In applicable scenarios
Step 3 - Data Sources
Primary Research
- Web Analytics
- Survey Reports
- Research Institute
- Latest Research Reports
- Opinion Leaders
Secondary Research
- Annual Reports
- White Paper
- Latest Press Release
- Industry Association
- Paid Database
- Investor Presentations

Step 4 - Data Triangulation
Involves using different sources of information in order to increase the validity of a study
These sources are likely to be stakeholders in a program - participants, other researchers, program staff, other community members, and so on.
Then we put all data in single framework & apply various statistical tools to find out the dynamic on the market.
During the analysis stage, feedback from the stakeholder groups would be compared to determine areas of agreement as well as areas of divergence
