

Key Insights
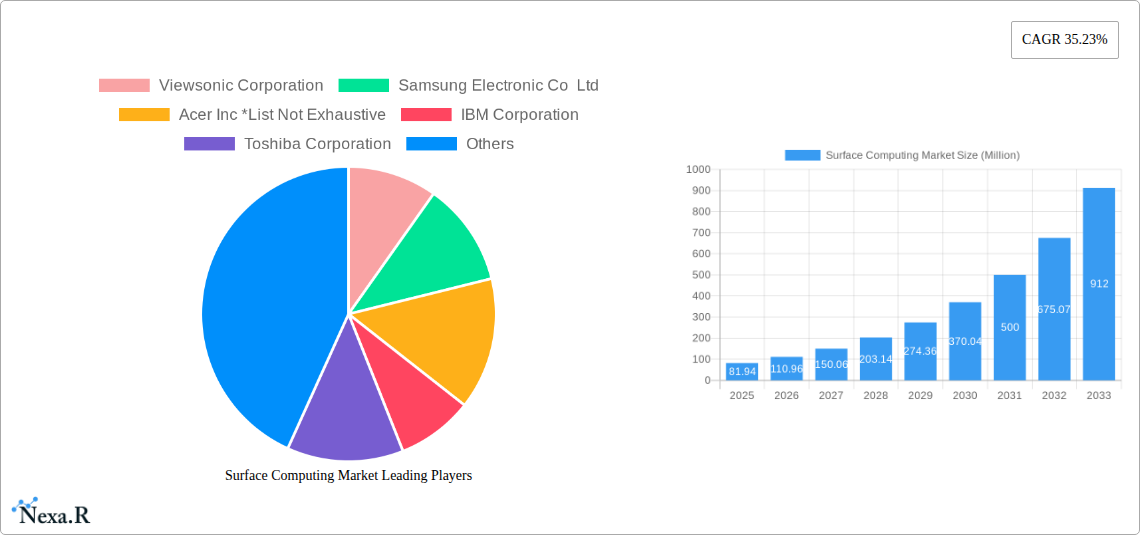
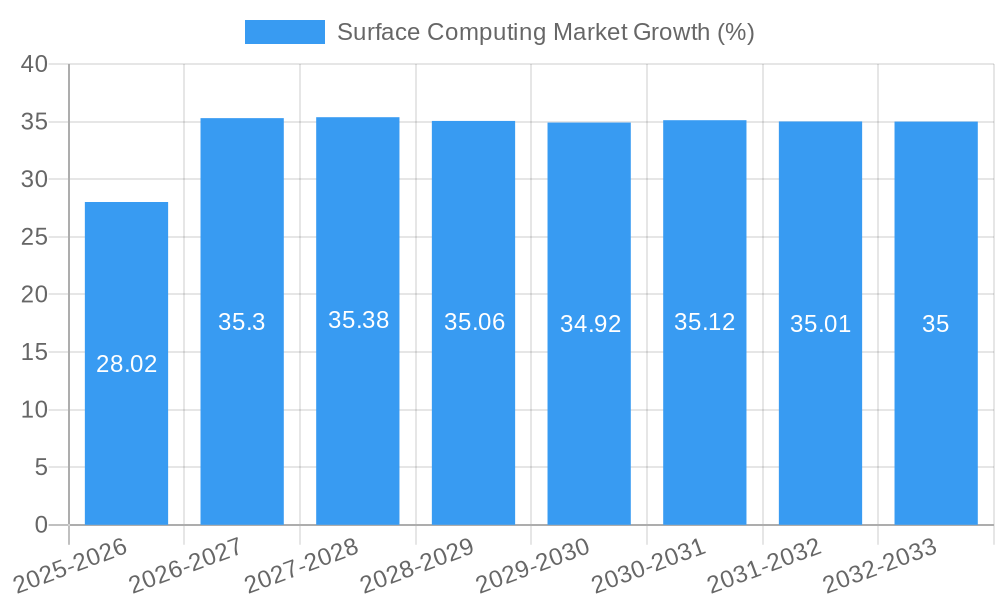
The surface computing market, valued at $81.94 million in 2025, is projected to experience robust growth, exhibiting a Compound Annual Growth Rate (CAGR) of 35.23% from 2025 to 2033. This expansion is driven by several key factors. The increasing adoption of interactive displays across diverse sectors like retail (for interactive kiosks), hospitality (for enhanced guest experiences), and healthcare (for improved patient engagement and diagnostic tools) fuels significant market demand. Technological advancements, including the development of more intuitive multi-touch and multi-user interfaces, higher resolution displays (both flat and curved), and the integration of advanced 3D visualization capabilities, are further propelling market growth. Furthermore, the rising demand for seamless user experiences and the integration of surface computing into smart homes and workplaces are contributing to market expansion. While challenges such as the relatively high initial investment cost of implementing surface computing solutions and the need for robust software and maintenance support could act as minor restraints, the overall market trajectory remains positive.
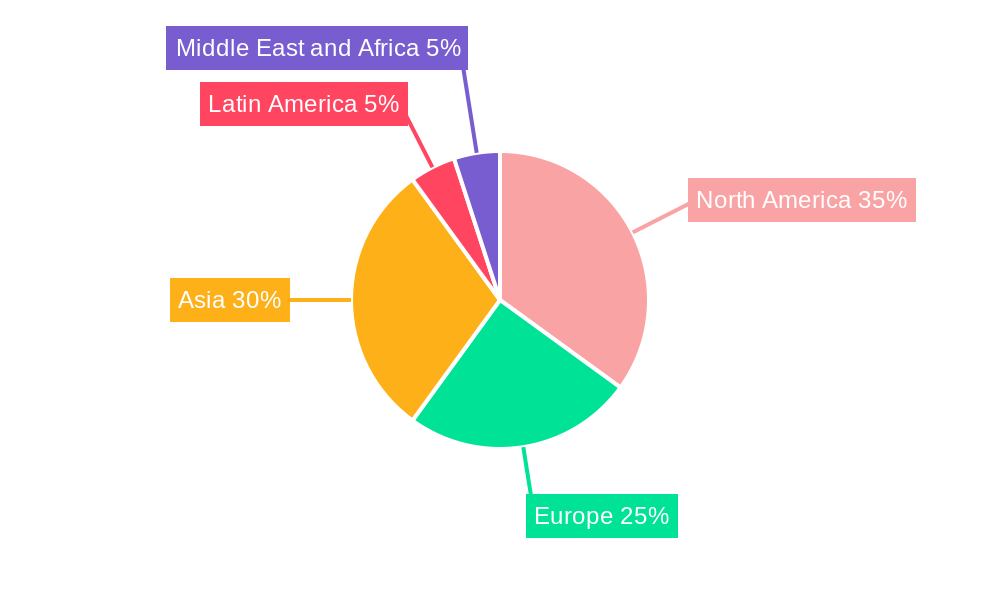
The market segmentation reveals a dynamic landscape. While flat displays currently dominate, curved displays are gaining traction due to their enhanced visual appeal and immersive experiences. The multi-touch and multi-user interface segments are witnessing rapid growth, reflecting the demand for collaborative and engaging applications. Three-dimensional visualization is becoming increasingly prevalent, particularly in sectors like healthcare and design, further fueling market segmentation diversity. Geographically, North America and Asia, especially China and Japan, are expected to lead the market due to strong technological advancements and high adoption rates across various application areas. Key players such as Samsung, LG, Microsoft, and Apple are strategically investing in research and development to enhance product offerings and strengthen their market positions. The continuous improvement in processing power, affordability of components, and expanding applications ensure that the surface computing market will continue its upward trajectory throughout the forecast period.
Surface Computing Market: A Comprehensive Report (2019-2033)
This in-depth report provides a comprehensive analysis of the Surface Computing Market, encompassing market dynamics, growth trends, regional segmentation, product landscape, key players, and future outlook. The study period spans from 2019 to 2033, with 2025 as the base and estimated year. The report utilizes data from various sources to provide a robust and reliable market projection. The global Surface Computing market is projected to reach xx Million units by 2033.
Surface Computing Market Dynamics & Structure
The Surface Computing market, encompassing parent markets like Interactive Displays and the child market of specialized computing devices, is characterized by moderate concentration, with key players vying for market share. Technological innovation, particularly in AI integration and enhanced touch capabilities, serves as a primary growth driver. Regulatory frameworks related to data privacy and security increasingly influence market dynamics. Competitive substitutes include traditional computing devices and emerging technologies like augmented reality. End-user demographics are diversifying, with adoption across diverse sectors. The M&A landscape has witnessed xx deals in the past five years, reflecting industry consolidation and strategic expansion efforts.
- Market Concentration: Moderately concentrated, with top 5 players holding approximately xx% market share (2024).
- Technological Innovation: AI integration, improved touch sensitivity, and advanced display technologies are key drivers.
- Regulatory Landscape: Data privacy regulations (e.g., GDPR, CCPA) are shaping market practices.
- Competitive Substitutes: Traditional PCs, tablets, and emerging AR/VR technologies pose competitive pressure.
- End-User Demographics: Growing adoption across diverse sectors, including healthcare, retail, and education.
- M&A Activity: xx M&A deals recorded between 2019-2024, indicating strategic consolidation.
Surface Computing Market Growth Trends & Insights
The Surface Computing market experienced significant growth during the historical period (2019-2024), driven by factors such as increasing demand for interactive displays in various sectors, technological advancements, and rising disposable incomes. The market is expected to continue its growth trajectory during the forecast period (2025-2033), with a projected CAGR of xx%. This growth is attributed to the rising adoption of multi-touch technologies, the growing demand for interactive displays in the education sector, and the increasing adoption of surface computing solutions in the commercial sector. Consumer behavior is shifting towards interactive and user-friendly devices, further fueling market expansion. The integration of AI is rapidly transforming the landscape, adding another layer of growth. The market penetration rate is projected to reach xx% by 2033.
Dominant Regions, Countries, or Segments in Surface Computing Market
North America currently holds the largest market share in the Surface Computing market, driven by strong demand from the commercial and education sectors, coupled with advanced technological infrastructure. Europe and Asia-Pacific follow, showing significant growth potential. Within product segments, the flat display segment is currently dominant, however, the curved display segment is showing rapid growth, boosted by aesthetic appeal and enhanced user experience. The multi-touch segment dominates the touch category, reflecting the increasing demand for interactive applications. In applications, the commercial segment exhibits high adoption, due to its usefulness for collaboration and presentations. The healthcare and education sectors are rapidly expanding segments.
- Key Regional Drivers: North America (high adoption, advanced technology), Europe (growing demand, robust regulatory framework), Asia-Pacific (rapid expansion, rising disposable income).
- Dominant Segments: Flat Displays (largest market share), Multi-touch (highest adoption), Commercial Applications (highest demand).
- Growth Potential: Curved Displays, Multi-user touch, and the Healthcare & Education sectors show substantial growth potential.
Surface Computing Market Product Landscape
Surface computing devices are constantly evolving, integrating advancements in display technology, touch capabilities, and processing power. Products are increasingly leveraging AI for enhanced functionality and user experiences. Unique selling propositions often revolve around seamless integration with other devices and software, and improved ergonomics. Key performance metrics include screen size, resolution, touch sensitivity, and processing speed. Innovative features like holographic projection and 3D interaction are emerging, further expanding the possibilities of this technology.
Key Drivers, Barriers & Challenges in Surface Computing Market
Key Drivers: Increasing demand for interactive solutions across sectors, technological advancements (AI integration, improved touch sensitivity), rising disposable incomes in developing economies.
Challenges: High initial investment costs, limited awareness in certain sectors, potential security and privacy concerns associated with data collection, supply chain disruptions, and competition from traditional computing devices. These factors contribute to an estimated xx% reduction in projected growth in certain regional markets.
Emerging Opportunities in Surface Computing Market
Untapped markets in emerging economies present significant opportunities. Innovative applications in healthcare (surgical simulations, telehealth), education (interactive learning tools), and automotive (in-car infotainment) are expanding. Consumer preferences are shifting towards seamless integration and personalized experiences, opening opportunities for tailored solutions.
Growth Accelerators in the Surface Computing Market Industry
Technological breakthroughs, such as the integration of AI and advanced display technologies, are fueling market expansion. Strategic partnerships among hardware and software providers are creating innovative solutions, expanding market reach and enhancing user experiences. Expansion into new market segments, such as the healthcare and automotive sectors, presents significant growth opportunities.
Key Players Shaping the Surface Computing Market Market
- Viewsonic Corporation
- Samsung Electronic Co Ltd
- Acer Inc
- IBM Corporation
- Toshiba Corporation
- LG Electronics Inc
- Fujitsu Ltd
- Planar Systems Inc
- Microsoft Corporation
- Dell Inc
- 3M Co
- Qualcomm Technologies Inc
- Hewlett-Packard Ltd
- Lenovo Group Ltd
- Apple Inc
- Panasonic Corporation
- Intel Corporation
- Sony Corporation
Notable Milestones in Surface Computing Market Sector
- March 2024: Microsoft announced the release of two new AI-powered PCs and the Surface Laptop 6, highlighting advancements in AI integration and performance.
- May 2024: Microsoft announced new computers with AI technology built-in, accelerating the adoption of AI-powered computing devices.
In-Depth Surface Computing Market Market Outlook
The future of the Surface Computing market is bright, driven by ongoing technological innovation, expanding applications across diverse sectors, and increasing consumer demand for interactive and user-friendly devices. Strategic partnerships and expansion into new markets will further fuel growth. The integration of AI and the development of new display technologies will create new opportunities for market expansion and value creation, positioning the sector for continued growth and success over the next decade.
Surface Computing Market Segmentation
-
1. Type
- 1.1. Flat Display
- 1.2. Curved Display
-
1.3. Components
- 1.3.1. Screen
- 1.3.2. Camera
- 1.3.3. Sensor
- 1.3.4. Processor
- 1.3.5. Software
- 1.3.6. Projector
- 1.3.7. Other Components
-
2. Touch
- 2.1. Single Touch
- 2.2. Multi-touch
- 2.3. Multi-user
- 2.4. Other Touches
-
3. Vision
- 3.1. Two Dimensional
- 3.2. Three Dimensional
-
4. Application
- 4.1. Entertainment
- 4.2. Retail
- 4.3. Hospitality
- 4.4. Healthcare
- 4.5. Commercial
- 4.6. Advertisement
- 4.7. Automotive
- 4.8. Education
- 4.9. Other Applications
Surface Computing Market Segmentation By Geography
-
1. North America
- 1.1. United States
- 1.2. Canada
-
2. Europe
- 2.1. United Kingdom
- 2.2. Germany
- 2.3. France
-
3. Asia
- 3.1. China
- 3.2. Japan
- 3.3. India
- 3.4. Australia and New Zealand
-
4. Latin America
- 4.1. Mexico
- 4.2. Brazil
- 4.3. Argentina
-
5. Middle East and Africa
- 5.1. Saudi Arabia
- 5.2. United Arab Emirates
- 5.3. South Africa
Surface Computing Market REPORT HIGHLIGHTS
| Aspects | Details |
|---|---|
| Study Period | 2019-2033 |
| Base Year | 2024 |
| Estimated Year | 2025 |
| Forecast Period | 2025-2033 |
| Historical Period | 2019-2024 |
| Growth Rate | CAGR of 35.23% from 2019-2033 |
| Segmentation |
|
Table of Contents
- 1. Introduction
- 1.1. Research Scope
- 1.2. Market Segmentation
- 1.3. Research Methodology
- 1.4. Definitions and Assumptions
- 2. Executive Summary
- 2.1. Introduction
- 3. Market Dynamics
- 3.1. Introduction
- 3.2. Market Drivers
- 3.2.1. More Advanced and User-friendly Interface - Natural User Interface (NUI); Increasing Business Revenue Due to Adoption of Multi-user Tabletops
- 3.3. Market Restrains
- 3.3.1. Limited Availability of Features; High Cost of Surface Computers
- 3.4. Market Trends
- 3.4.1. The Retail Sector is Expected to Hold a Significant Market Share
- 4. Market Factor Analysis
- 4.1. Porters Five Forces
- 4.2. Supply/Value Chain
- 4.3. PESTEL analysis
- 4.4. Market Entropy
- 4.5. Patent/Trademark Analysis
- 5. Global Surface Computing Market Analysis, Insights and Forecast, 2019-2031
- 5.1. Market Analysis, Insights and Forecast - by Type
- 5.1.1. Flat Display
- 5.1.2. Curved Display
- 5.1.3. Components
- 5.1.3.1. Screen
- 5.1.3.2. Camera
- 5.1.3.3. Sensor
- 5.1.3.4. Processor
- 5.1.3.5. Software
- 5.1.3.6. Projector
- 5.1.3.7. Other Components
- 5.2. Market Analysis, Insights and Forecast - by Touch
- 5.2.1. Single Touch
- 5.2.2. Multi-touch
- 5.2.3. Multi-user
- 5.2.4. Other Touches
- 5.3. Market Analysis, Insights and Forecast - by Vision
- 5.3.1. Two Dimensional
- 5.3.2. Three Dimensional
- 5.4. Market Analysis, Insights and Forecast - by Application
- 5.4.1. Entertainment
- 5.4.2. Retail
- 5.4.3. Hospitality
- 5.4.4. Healthcare
- 5.4.5. Commercial
- 5.4.6. Advertisement
- 5.4.7. Automotive
- 5.4.8. Education
- 5.4.9. Other Applications
- 5.5. Market Analysis, Insights and Forecast - by Region
- 5.5.1. North America
- 5.5.2. Europe
- 5.5.3. Asia
- 5.5.4. Latin America
- 5.5.5. Middle East and Africa
- 5.1. Market Analysis, Insights and Forecast - by Type
- 6. North America Surface Computing Market Analysis, Insights and Forecast, 2019-2031
- 6.1. Market Analysis, Insights and Forecast - by Type
- 6.1.1. Flat Display
- 6.1.2. Curved Display
- 6.1.3. Components
- 6.1.3.1. Screen
- 6.1.3.2. Camera
- 6.1.3.3. Sensor
- 6.1.3.4. Processor
- 6.1.3.5. Software
- 6.1.3.6. Projector
- 6.1.3.7. Other Components
- 6.2. Market Analysis, Insights and Forecast - by Touch
- 6.2.1. Single Touch
- 6.2.2. Multi-touch
- 6.2.3. Multi-user
- 6.2.4. Other Touches
- 6.3. Market Analysis, Insights and Forecast - by Vision
- 6.3.1. Two Dimensional
- 6.3.2. Three Dimensional
- 6.4. Market Analysis, Insights and Forecast - by Application
- 6.4.1. Entertainment
- 6.4.2. Retail
- 6.4.3. Hospitality
- 6.4.4. Healthcare
- 6.4.5. Commercial
- 6.4.6. Advertisement
- 6.4.7. Automotive
- 6.4.8. Education
- 6.4.9. Other Applications
- 6.1. Market Analysis, Insights and Forecast - by Type
- 7. Europe Surface Computing Market Analysis, Insights and Forecast, 2019-2031
- 7.1. Market Analysis, Insights and Forecast - by Type
- 7.1.1. Flat Display
- 7.1.2. Curved Display
- 7.1.3. Components
- 7.1.3.1. Screen
- 7.1.3.2. Camera
- 7.1.3.3. Sensor
- 7.1.3.4. Processor
- 7.1.3.5. Software
- 7.1.3.6. Projector
- 7.1.3.7. Other Components
- 7.2. Market Analysis, Insights and Forecast - by Touch
- 7.2.1. Single Touch
- 7.2.2. Multi-touch
- 7.2.3. Multi-user
- 7.2.4. Other Touches
- 7.3. Market Analysis, Insights and Forecast - by Vision
- 7.3.1. Two Dimensional
- 7.3.2. Three Dimensional
- 7.4. Market Analysis, Insights and Forecast - by Application
- 7.4.1. Entertainment
- 7.4.2. Retail
- 7.4.3. Hospitality
- 7.4.4. Healthcare
- 7.4.5. Commercial
- 7.4.6. Advertisement
- 7.4.7. Automotive
- 7.4.8. Education
- 7.4.9. Other Applications
- 7.1. Market Analysis, Insights and Forecast - by Type
- 8. Asia Surface Computing Market Analysis, Insights and Forecast, 2019-2031
- 8.1. Market Analysis, Insights and Forecast - by Type
- 8.1.1. Flat Display
- 8.1.2. Curved Display
- 8.1.3. Components
- 8.1.3.1. Screen
- 8.1.3.2. Camera
- 8.1.3.3. Sensor
- 8.1.3.4. Processor
- 8.1.3.5. Software
- 8.1.3.6. Projector
- 8.1.3.7. Other Components
- 8.2. Market Analysis, Insights and Forecast - by Touch
- 8.2.1. Single Touch
- 8.2.2. Multi-touch
- 8.2.3. Multi-user
- 8.2.4. Other Touches
- 8.3. Market Analysis, Insights and Forecast - by Vision
- 8.3.1. Two Dimensional
- 8.3.2. Three Dimensional
- 8.4. Market Analysis, Insights and Forecast - by Application
- 8.4.1. Entertainment
- 8.4.2. Retail
- 8.4.3. Hospitality
- 8.4.4. Healthcare
- 8.4.5. Commercial
- 8.4.6. Advertisement
- 8.4.7. Automotive
- 8.4.8. Education
- 8.4.9. Other Applications
- 8.1. Market Analysis, Insights and Forecast - by Type
- 9. Latin America Surface Computing Market Analysis, Insights and Forecast, 2019-2031
- 9.1. Market Analysis, Insights and Forecast - by Type
- 9.1.1. Flat Display
- 9.1.2. Curved Display
- 9.1.3. Components
- 9.1.3.1. Screen
- 9.1.3.2. Camera
- 9.1.3.3. Sensor
- 9.1.3.4. Processor
- 9.1.3.5. Software
- 9.1.3.6. Projector
- 9.1.3.7. Other Components
- 9.2. Market Analysis, Insights and Forecast - by Touch
- 9.2.1. Single Touch
- 9.2.2. Multi-touch
- 9.2.3. Multi-user
- 9.2.4. Other Touches
- 9.3. Market Analysis, Insights and Forecast - by Vision
- 9.3.1. Two Dimensional
- 9.3.2. Three Dimensional
- 9.4. Market Analysis, Insights and Forecast - by Application
- 9.4.1. Entertainment
- 9.4.2. Retail
- 9.4.3. Hospitality
- 9.4.4. Healthcare
- 9.4.5. Commercial
- 9.4.6. Advertisement
- 9.4.7. Automotive
- 9.4.8. Education
- 9.4.9. Other Applications
- 9.1. Market Analysis, Insights and Forecast - by Type
- 10. Middle East and Africa Surface Computing Market Analysis, Insights and Forecast, 2019-2031
- 10.1. Market Analysis, Insights and Forecast - by Type
- 10.1.1. Flat Display
- 10.1.2. Curved Display
- 10.1.3. Components
- 10.1.3.1. Screen
- 10.1.3.2. Camera
- 10.1.3.3. Sensor
- 10.1.3.4. Processor
- 10.1.3.5. Software
- 10.1.3.6. Projector
- 10.1.3.7. Other Components
- 10.2. Market Analysis, Insights and Forecast - by Touch
- 10.2.1. Single Touch
- 10.2.2. Multi-touch
- 10.2.3. Multi-user
- 10.2.4. Other Touches
- 10.3. Market Analysis, Insights and Forecast - by Vision
- 10.3.1. Two Dimensional
- 10.3.2. Three Dimensional
- 10.4. Market Analysis, Insights and Forecast - by Application
- 10.4.1. Entertainment
- 10.4.2. Retail
- 10.4.3. Hospitality
- 10.4.4. Healthcare
- 10.4.5. Commercial
- 10.4.6. Advertisement
- 10.4.7. Automotive
- 10.4.8. Education
- 10.4.9. Other Applications
- 10.1. Market Analysis, Insights and Forecast - by Type
- 11. North America Surface Computing Market Analysis, Insights and Forecast, 2019-2031
- 11.1. Market Analysis, Insights and Forecast - By Country/Sub-region
- 11.1.1 United States
- 11.1.2 Canada
- 12. Europe Surface Computing Market Analysis, Insights and Forecast, 2019-2031
- 12.1. Market Analysis, Insights and Forecast - By Country/Sub-region
- 12.1.1 United Kingdom
- 12.1.2 Germany
- 12.1.3 France
- 13. Asia Surface Computing Market Analysis, Insights and Forecast, 2019-2031
- 13.1. Market Analysis, Insights and Forecast - By Country/Sub-region
- 13.1.1 China
- 13.1.2 Japan
- 13.1.3 India
- 13.1.4 Australia and New Zealand
- 14. Latin America Surface Computing Market Analysis, Insights and Forecast, 2019-2031
- 14.1. Market Analysis, Insights and Forecast - By Country/Sub-region
- 14.1.1 Mexico
- 14.1.2 Brazil
- 14.1.3 Argentina
- 15. Middle East and Africa Surface Computing Market Analysis, Insights and Forecast, 2019-2031
- 15.1. Market Analysis, Insights and Forecast - By Country/Sub-region
- 15.1.1 Saudi Arabia
- 15.1.2 United Arab Emirates
- 15.1.3 South Africa
- 16. Competitive Analysis
- 16.1. Global Market Share Analysis 2024
- 16.2. Company Profiles
- 16.2.1 Viewsonic Corporation
- 16.2.1.1. Overview
- 16.2.1.2. Products
- 16.2.1.3. SWOT Analysis
- 16.2.1.4. Recent Developments
- 16.2.1.5. Financials (Based on Availability)
- 16.2.2 Samsung Electronic Co Ltd
- 16.2.2.1. Overview
- 16.2.2.2. Products
- 16.2.2.3. SWOT Analysis
- 16.2.2.4. Recent Developments
- 16.2.2.5. Financials (Based on Availability)
- 16.2.3 Acer Inc *List Not Exhaustive
- 16.2.3.1. Overview
- 16.2.3.2. Products
- 16.2.3.3. SWOT Analysis
- 16.2.3.4. Recent Developments
- 16.2.3.5. Financials (Based on Availability)
- 16.2.4 IBM Corporation
- 16.2.4.1. Overview
- 16.2.4.2. Products
- 16.2.4.3. SWOT Analysis
- 16.2.4.4. Recent Developments
- 16.2.4.5. Financials (Based on Availability)
- 16.2.5 Toshiba Corporation
- 16.2.5.1. Overview
- 16.2.5.2. Products
- 16.2.5.3. SWOT Analysis
- 16.2.5.4. Recent Developments
- 16.2.5.5. Financials (Based on Availability)
- 16.2.6 LG Electronics Inc
- 16.2.6.1. Overview
- 16.2.6.2. Products
- 16.2.6.3. SWOT Analysis
- 16.2.6.4. Recent Developments
- 16.2.6.5. Financials (Based on Availability)
- 16.2.7 Fujitsu Ltd
- 16.2.7.1. Overview
- 16.2.7.2. Products
- 16.2.7.3. SWOT Analysis
- 16.2.7.4. Recent Developments
- 16.2.7.5. Financials (Based on Availability)
- 16.2.8 Planar Systems Inc
- 16.2.8.1. Overview
- 16.2.8.2. Products
- 16.2.8.3. SWOT Analysis
- 16.2.8.4. Recent Developments
- 16.2.8.5. Financials (Based on Availability)
- 16.2.9 Microsoft Corporation
- 16.2.9.1. Overview
- 16.2.9.2. Products
- 16.2.9.3. SWOT Analysis
- 16.2.9.4. Recent Developments
- 16.2.9.5. Financials (Based on Availability)
- 16.2.10 Dell Inc
- 16.2.10.1. Overview
- 16.2.10.2. Products
- 16.2.10.3. SWOT Analysis
- 16.2.10.4. Recent Developments
- 16.2.10.5. Financials (Based on Availability)
- 16.2.11 3M Co
- 16.2.11.1. Overview
- 16.2.11.2. Products
- 16.2.11.3. SWOT Analysis
- 16.2.11.4. Recent Developments
- 16.2.11.5. Financials (Based on Availability)
- 16.2.12 Qualcomm Technologies Inc
- 16.2.12.1. Overview
- 16.2.12.2. Products
- 16.2.12.3. SWOT Analysis
- 16.2.12.4. Recent Developments
- 16.2.12.5. Financials (Based on Availability)
- 16.2.13 Hewlett-Packard Ltd
- 16.2.13.1. Overview
- 16.2.13.2. Products
- 16.2.13.3. SWOT Analysis
- 16.2.13.4. Recent Developments
- 16.2.13.5. Financials (Based on Availability)
- 16.2.14 Lenovo Group Ltd
- 16.2.14.1. Overview
- 16.2.14.2. Products
- 16.2.14.3. SWOT Analysis
- 16.2.14.4. Recent Developments
- 16.2.14.5. Financials (Based on Availability)
- 16.2.15 Apple Inc
- 16.2.15.1. Overview
- 16.2.15.2. Products
- 16.2.15.3. SWOT Analysis
- 16.2.15.4. Recent Developments
- 16.2.15.5. Financials (Based on Availability)
- 16.2.16 Panasonic Corporation
- 16.2.16.1. Overview
- 16.2.16.2. Products
- 16.2.16.3. SWOT Analysis
- 16.2.16.4. Recent Developments
- 16.2.16.5. Financials (Based on Availability)
- 16.2.17 Intel Corporation
- 16.2.17.1. Overview
- 16.2.17.2. Products
- 16.2.17.3. SWOT Analysis
- 16.2.17.4. Recent Developments
- 16.2.17.5. Financials (Based on Availability)
- 16.2.18 Sony Corporation
- 16.2.18.1. Overview
- 16.2.18.2. Products
- 16.2.18.3. SWOT Analysis
- 16.2.18.4. Recent Developments
- 16.2.18.5. Financials (Based on Availability)
- 16.2.1 Viewsonic Corporation
List of Figures
- Figure 1: Global Surface Computing Market Revenue Breakdown (Million, %) by Region 2024 & 2032
- Figure 2: North America Surface Computing Market Revenue (Million), by Country 2024 & 2032
- Figure 3: North America Surface Computing Market Revenue Share (%), by Country 2024 & 2032
- Figure 4: Europe Surface Computing Market Revenue (Million), by Country 2024 & 2032
- Figure 5: Europe Surface Computing Market Revenue Share (%), by Country 2024 & 2032
- Figure 6: Asia Surface Computing Market Revenue (Million), by Country 2024 & 2032
- Figure 7: Asia Surface Computing Market Revenue Share (%), by Country 2024 & 2032
- Figure 8: Latin America Surface Computing Market Revenue (Million), by Country 2024 & 2032
- Figure 9: Latin America Surface Computing Market Revenue Share (%), by Country 2024 & 2032
- Figure 10: Middle East and Africa Surface Computing Market Revenue (Million), by Country 2024 & 2032
- Figure 11: Middle East and Africa Surface Computing Market Revenue Share (%), by Country 2024 & 2032
- Figure 12: North America Surface Computing Market Revenue (Million), by Type 2024 & 2032
- Figure 13: North America Surface Computing Market Revenue Share (%), by Type 2024 & 2032
- Figure 14: North America Surface Computing Market Revenue (Million), by Touch 2024 & 2032
- Figure 15: North America Surface Computing Market Revenue Share (%), by Touch 2024 & 2032
- Figure 16: North America Surface Computing Market Revenue (Million), by Vision 2024 & 2032
- Figure 17: North America Surface Computing Market Revenue Share (%), by Vision 2024 & 2032
- Figure 18: North America Surface Computing Market Revenue (Million), by Application 2024 & 2032
- Figure 19: North America Surface Computing Market Revenue Share (%), by Application 2024 & 2032
- Figure 20: North America Surface Computing Market Revenue (Million), by Country 2024 & 2032
- Figure 21: North America Surface Computing Market Revenue Share (%), by Country 2024 & 2032
- Figure 22: Europe Surface Computing Market Revenue (Million), by Type 2024 & 2032
- Figure 23: Europe Surface Computing Market Revenue Share (%), by Type 2024 & 2032
- Figure 24: Europe Surface Computing Market Revenue (Million), by Touch 2024 & 2032
- Figure 25: Europe Surface Computing Market Revenue Share (%), by Touch 2024 & 2032
- Figure 26: Europe Surface Computing Market Revenue (Million), by Vision 2024 & 2032
- Figure 27: Europe Surface Computing Market Revenue Share (%), by Vision 2024 & 2032
- Figure 28: Europe Surface Computing Market Revenue (Million), by Application 2024 & 2032
- Figure 29: Europe Surface Computing Market Revenue Share (%), by Application 2024 & 2032
- Figure 30: Europe Surface Computing Market Revenue (Million), by Country 2024 & 2032
- Figure 31: Europe Surface Computing Market Revenue Share (%), by Country 2024 & 2032
- Figure 32: Asia Surface Computing Market Revenue (Million), by Type 2024 & 2032
- Figure 33: Asia Surface Computing Market Revenue Share (%), by Type 2024 & 2032
- Figure 34: Asia Surface Computing Market Revenue (Million), by Touch 2024 & 2032
- Figure 35: Asia Surface Computing Market Revenue Share (%), by Touch 2024 & 2032
- Figure 36: Asia Surface Computing Market Revenue (Million), by Vision 2024 & 2032
- Figure 37: Asia Surface Computing Market Revenue Share (%), by Vision 2024 & 2032
- Figure 38: Asia Surface Computing Market Revenue (Million), by Application 2024 & 2032
- Figure 39: Asia Surface Computing Market Revenue Share (%), by Application 2024 & 2032
- Figure 40: Asia Surface Computing Market Revenue (Million), by Country 2024 & 2032
- Figure 41: Asia Surface Computing Market Revenue Share (%), by Country 2024 & 2032
- Figure 42: Latin America Surface Computing Market Revenue (Million), by Type 2024 & 2032
- Figure 43: Latin America Surface Computing Market Revenue Share (%), by Type 2024 & 2032
- Figure 44: Latin America Surface Computing Market Revenue (Million), by Touch 2024 & 2032
- Figure 45: Latin America Surface Computing Market Revenue Share (%), by Touch 2024 & 2032
- Figure 46: Latin America Surface Computing Market Revenue (Million), by Vision 2024 & 2032
- Figure 47: Latin America Surface Computing Market Revenue Share (%), by Vision 2024 & 2032
- Figure 48: Latin America Surface Computing Market Revenue (Million), by Application 2024 & 2032
- Figure 49: Latin America Surface Computing Market Revenue Share (%), by Application 2024 & 2032
- Figure 50: Latin America Surface Computing Market Revenue (Million), by Country 2024 & 2032
- Figure 51: Latin America Surface Computing Market Revenue Share (%), by Country 2024 & 2032
- Figure 52: Middle East and Africa Surface Computing Market Revenue (Million), by Type 2024 & 2032
- Figure 53: Middle East and Africa Surface Computing Market Revenue Share (%), by Type 2024 & 2032
- Figure 54: Middle East and Africa Surface Computing Market Revenue (Million), by Touch 2024 & 2032
- Figure 55: Middle East and Africa Surface Computing Market Revenue Share (%), by Touch 2024 & 2032
- Figure 56: Middle East and Africa Surface Computing Market Revenue (Million), by Vision 2024 & 2032
- Figure 57: Middle East and Africa Surface Computing Market Revenue Share (%), by Vision 2024 & 2032
- Figure 58: Middle East and Africa Surface Computing Market Revenue (Million), by Application 2024 & 2032
- Figure 59: Middle East and Africa Surface Computing Market Revenue Share (%), by Application 2024 & 2032
- Figure 60: Middle East and Africa Surface Computing Market Revenue (Million), by Country 2024 & 2032
- Figure 61: Middle East and Africa Surface Computing Market Revenue Share (%), by Country 2024 & 2032
List of Tables
- Table 1: Global Surface Computing Market Revenue Million Forecast, by Region 2019 & 2032
- Table 2: Global Surface Computing Market Revenue Million Forecast, by Type 2019 & 2032
- Table 3: Global Surface Computing Market Revenue Million Forecast, by Touch 2019 & 2032
- Table 4: Global Surface Computing Market Revenue Million Forecast, by Vision 2019 & 2032
- Table 5: Global Surface Computing Market Revenue Million Forecast, by Application 2019 & 2032
- Table 6: Global Surface Computing Market Revenue Million Forecast, by Region 2019 & 2032
- Table 7: Global Surface Computing Market Revenue Million Forecast, by Country 2019 & 2032
- Table 8: United States Surface Computing Market Revenue (Million) Forecast, by Application 2019 & 2032
- Table 9: Canada Surface Computing Market Revenue (Million) Forecast, by Application 2019 & 2032
- Table 10: Global Surface Computing Market Revenue Million Forecast, by Country 2019 & 2032
- Table 11: United Kingdom Surface Computing Market Revenue (Million) Forecast, by Application 2019 & 2032
- Table 12: Germany Surface Computing Market Revenue (Million) Forecast, by Application 2019 & 2032
- Table 13: France Surface Computing Market Revenue (Million) Forecast, by Application 2019 & 2032
- Table 14: Global Surface Computing Market Revenue Million Forecast, by Country 2019 & 2032
- Table 15: China Surface Computing Market Revenue (Million) Forecast, by Application 2019 & 2032
- Table 16: Japan Surface Computing Market Revenue (Million) Forecast, by Application 2019 & 2032
- Table 17: India Surface Computing Market Revenue (Million) Forecast, by Application 2019 & 2032
- Table 18: Australia and New Zealand Surface Computing Market Revenue (Million) Forecast, by Application 2019 & 2032
- Table 19: Global Surface Computing Market Revenue Million Forecast, by Country 2019 & 2032
- Table 20: Mexico Surface Computing Market Revenue (Million) Forecast, by Application 2019 & 2032
- Table 21: Brazil Surface Computing Market Revenue (Million) Forecast, by Application 2019 & 2032
- Table 22: Argentina Surface Computing Market Revenue (Million) Forecast, by Application 2019 & 2032
- Table 23: Global Surface Computing Market Revenue Million Forecast, by Country 2019 & 2032
- Table 24: Saudi Arabia Surface Computing Market Revenue (Million) Forecast, by Application 2019 & 2032
- Table 25: United Arab Emirates Surface Computing Market Revenue (Million) Forecast, by Application 2019 & 2032
- Table 26: South Africa Surface Computing Market Revenue (Million) Forecast, by Application 2019 & 2032
- Table 27: Global Surface Computing Market Revenue Million Forecast, by Type 2019 & 2032
- Table 28: Global Surface Computing Market Revenue Million Forecast, by Touch 2019 & 2032
- Table 29: Global Surface Computing Market Revenue Million Forecast, by Vision 2019 & 2032
- Table 30: Global Surface Computing Market Revenue Million Forecast, by Application 2019 & 2032
- Table 31: Global Surface Computing Market Revenue Million Forecast, by Country 2019 & 2032
- Table 32: United States Surface Computing Market Revenue (Million) Forecast, by Application 2019 & 2032
- Table 33: Canada Surface Computing Market Revenue (Million) Forecast, by Application 2019 & 2032
- Table 34: Global Surface Computing Market Revenue Million Forecast, by Type 2019 & 2032
- Table 35: Global Surface Computing Market Revenue Million Forecast, by Touch 2019 & 2032
- Table 36: Global Surface Computing Market Revenue Million Forecast, by Vision 2019 & 2032
- Table 37: Global Surface Computing Market Revenue Million Forecast, by Application 2019 & 2032
- Table 38: Global Surface Computing Market Revenue Million Forecast, by Country 2019 & 2032
- Table 39: United Kingdom Surface Computing Market Revenue (Million) Forecast, by Application 2019 & 2032
- Table 40: Germany Surface Computing Market Revenue (Million) Forecast, by Application 2019 & 2032
- Table 41: France Surface Computing Market Revenue (Million) Forecast, by Application 2019 & 2032
- Table 42: Global Surface Computing Market Revenue Million Forecast, by Type 2019 & 2032
- Table 43: Global Surface Computing Market Revenue Million Forecast, by Touch 2019 & 2032
- Table 44: Global Surface Computing Market Revenue Million Forecast, by Vision 2019 & 2032
- Table 45: Global Surface Computing Market Revenue Million Forecast, by Application 2019 & 2032
- Table 46: Global Surface Computing Market Revenue Million Forecast, by Country 2019 & 2032
- Table 47: China Surface Computing Market Revenue (Million) Forecast, by Application 2019 & 2032
- Table 48: Japan Surface Computing Market Revenue (Million) Forecast, by Application 2019 & 2032
- Table 49: India Surface Computing Market Revenue (Million) Forecast, by Application 2019 & 2032
- Table 50: Australia and New Zealand Surface Computing Market Revenue (Million) Forecast, by Application 2019 & 2032
- Table 51: Global Surface Computing Market Revenue Million Forecast, by Type 2019 & 2032
- Table 52: Global Surface Computing Market Revenue Million Forecast, by Touch 2019 & 2032
- Table 53: Global Surface Computing Market Revenue Million Forecast, by Vision 2019 & 2032
- Table 54: Global Surface Computing Market Revenue Million Forecast, by Application 2019 & 2032
- Table 55: Global Surface Computing Market Revenue Million Forecast, by Country 2019 & 2032
- Table 56: Mexico Surface Computing Market Revenue (Million) Forecast, by Application 2019 & 2032
- Table 57: Brazil Surface Computing Market Revenue (Million) Forecast, by Application 2019 & 2032
- Table 58: Argentina Surface Computing Market Revenue (Million) Forecast, by Application 2019 & 2032
- Table 59: Global Surface Computing Market Revenue Million Forecast, by Type 2019 & 2032
- Table 60: Global Surface Computing Market Revenue Million Forecast, by Touch 2019 & 2032
- Table 61: Global Surface Computing Market Revenue Million Forecast, by Vision 2019 & 2032
- Table 62: Global Surface Computing Market Revenue Million Forecast, by Application 2019 & 2032
- Table 63: Global Surface Computing Market Revenue Million Forecast, by Country 2019 & 2032
- Table 64: Saudi Arabia Surface Computing Market Revenue (Million) Forecast, by Application 2019 & 2032
- Table 65: United Arab Emirates Surface Computing Market Revenue (Million) Forecast, by Application 2019 & 2032
- Table 66: South Africa Surface Computing Market Revenue (Million) Forecast, by Application 2019 & 2032
Frequently Asked Questions
1. What is the projected Compound Annual Growth Rate (CAGR) of the Surface Computing Market?
The projected CAGR is approximately 35.23%.
2. Which companies are prominent players in the Surface Computing Market?
Key companies in the market include Viewsonic Corporation, Samsung Electronic Co Ltd, Acer Inc *List Not Exhaustive, IBM Corporation, Toshiba Corporation, LG Electronics Inc, Fujitsu Ltd, Planar Systems Inc, Microsoft Corporation, Dell Inc, 3M Co, Qualcomm Technologies Inc, Hewlett-Packard Ltd, Lenovo Group Ltd, Apple Inc, Panasonic Corporation, Intel Corporation, Sony Corporation.
3. What are the main segments of the Surface Computing Market?
The market segments include Type, Touch, Vision, Application.
4. Can you provide details about the market size?
The market size is estimated to be USD 81.94 Million as of 2022.
5. What are some drivers contributing to market growth?
More Advanced and User-friendly Interface - Natural User Interface (NUI); Increasing Business Revenue Due to Adoption of Multi-user Tabletops.
6. What are the notable trends driving market growth?
The Retail Sector is Expected to Hold a Significant Market Share.
7. Are there any restraints impacting market growth?
Limited Availability of Features; High Cost of Surface Computers.
8. Can you provide examples of recent developments in the market?
May 2024 - Microsoft announced new computers with the company’s artificial intelligence tech built directly into them, boosting the race among tech giants to push out AI tools to the public and adding computer chips that are tailored to run AI technology to the company’s PCs and tablets will make AI tools and features run faster than if the technology runs through an internet connection, as most chatbots.
9. What pricing options are available for accessing the report?
Pricing options include single-user, multi-user, and enterprise licenses priced at USD 4750, USD 5250, and USD 8750 respectively.
10. Is the market size provided in terms of value or volume?
The market size is provided in terms of value, measured in Million.
11. Are there any specific market keywords associated with the report?
Yes, the market keyword associated with the report is "Surface Computing Market," which aids in identifying and referencing the specific market segment covered.
12. How do I determine which pricing option suits my needs best?
The pricing options vary based on user requirements and access needs. Individual users may opt for single-user licenses, while businesses requiring broader access may choose multi-user or enterprise licenses for cost-effective access to the report.
13. Are there any additional resources or data provided in the Surface Computing Market report?
While the report offers comprehensive insights, it's advisable to review the specific contents or supplementary materials provided to ascertain if additional resources or data are available.
14. How can I stay updated on further developments or reports in the Surface Computing Market?
To stay informed about further developments, trends, and reports in the Surface Computing Market, consider subscribing to industry newsletters, following relevant companies and organizations, or regularly checking reputable industry news sources and publications.
Methodology
Step 1 - Identification of Relevant Samples Size from Population Database


Step 2 - Approaches for Defining Global Market Size (Value, Volume* & Price*)

Note*: In applicable scenarios
Step 3 - Data Sources
Primary Research
- Web Analytics
- Survey Reports
- Research Institute
- Latest Research Reports
- Opinion Leaders
Secondary Research
- Annual Reports
- White Paper
- Latest Press Release
- Industry Association
- Paid Database
- Investor Presentations

Step 4 - Data Triangulation
Involves using different sources of information in order to increase the validity of a study
These sources are likely to be stakeholders in a program - participants, other researchers, program staff, other community members, and so on.
Then we put all data in single framework & apply various statistical tools to find out the dynamic on the market.
During the analysis stage, feedback from the stakeholder groups would be compared to determine areas of agreement as well as areas of divergence
